Direction (1-5): Study the following pie-charts carefully and answer the questions given below:
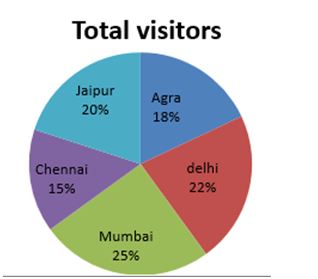
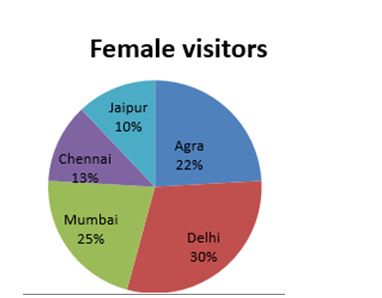
Total visitors to different places are 6500, out of which 40% are females. Percentage-wise distribution of visitors who visited 5 different places


1. What percentage of male visitors went Delhi?
(1) 16 2/3%
(2) 14 2/3%
(3) 16 1/3%
(4) 12 3/4%
(5) 15 3/4%
Explanation
(1) Total Male Visitors = 6500*60/100=3900Total visitor to Delhi = 6500*22/100 = 1430
Total female to Delhi = 2600*30/100 = 780
Male Visitor to Delhi = 1430-780 = 650.
Required % = 650*100/3900 = 16 2/3%
2. What is difference between no. of visitors, who went Chennai and Mumbai together and no. of female visitors who went Jaipur and Agra together?
(a) 1900
(b) 1850
(c) 1768
(d) 1838
(e) 1958
Explanation
(3) Difference = 6500(15+25)/100 – 2600(10+22)/100
= 65*40-26*32 = 1768
3.What is ratio of no. of female visitor to no. of male visitors, who went Jaipur?
(a) 5 : 1
(b) 1 : 3
(c) 4 : 1
(d) 1 : 4
(e) 1 : 5
Explanation
No .of female visitors,who went to Jaipur
= 6500*40/100*10/100 = 260
No .of male visitors,who went to Jaipur
= 6500*20/100-260 = 1040
Ratio = 260 : 1040 = 1 : 4
4. Total male visitors who went Chennai and Agra together are what percent of total male visitors?
(a) 32
(b) 31.67
(c) 31.50
(d) 32.67
(e) 30.65
Explanation
Total Visitors, who went Chennai & Agra
= 6500(15+18)/100= 2145
Total male visitors, who went Chennai & Agra
= 2145- (6500*40/100*35/100)= 2145 – 910= 1235
Required percentage= 1235*100/3900 = 31.67%
5. What is the no. of male visitors who went Mumbai?
(a) 1000
(b) 1100
(c) 1219
(d) 1130
(e) 1250
Explanation
6500*25/100*75/100 = 1218.75
Direction(6-10):
Study the following graph and pie-chart carefully to answer the questions that follow.
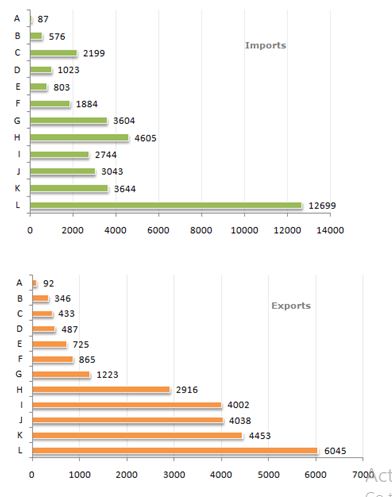
Foreign Trade (Imports and Exports) by countries for the year (1993 – 1994)

6. The ratio of the maximum exports to the minimum imports was closest to?
(a) 64
(b) 69
(c) 74
(d) 79
(e) None of these
Explanation
(B) The value of maximum exports = 6045.
The value of minimum imports = 87.
Therefore, the required ratio (6045/87) = 69.48 = 69 (approximately)
7. How many countries exhibited a trade surplus ?
(a) 5
(b) 4
(c) 3
(d) 6
(e) 7
Explanation
Ans.(B)Out of a total of 12 countries, 8 showed a deficit while 4 showed a surplus.
8. The total trade deficit/surplus for all the countries put together was ?
(a) 11286 surplus
(b) 11286 deficit
(c) 10286 surplus
(d) 10286 deficit
(e) None of these
Explanation
Ans (B).Sum of exports – Sum of imports = deficit(11286)
9. The highest trade deficit was shown by which country?
(a) C
(b) G
(c) H
(d) L
(e) None of these
Explanation
Ans.(D) Visually its clear that L has the highest trade deficit.
10. The ratio of Exports to Imports was highest for which country ?
(a) A
(b) I
(c) J
(d) K
(e) None of these
Explanation
Ans (B) I has a ratio of 4002/2744 = 1.45, which is the highest.
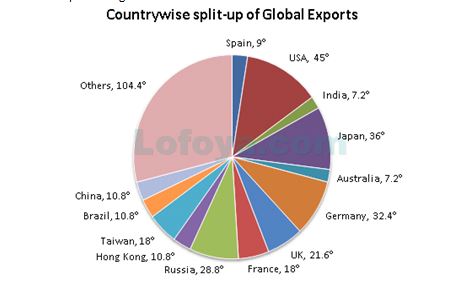
Directions (11-15): These questions are based on the following pie chart given below.

11. The difference in the value of the exports of Japan and
France is how many times that of UK and Taiwan?
(a) 2 times
(b) 3 times
(c) 5 times
(d) 12 times
(5) 15 times
Explanation
(c); The difference in the angles subtended by Japan and France:
=36°−18°=18°=36°−18°=18° ——– (A)
The difference in the angles subtended by UK and Taiwan:
=21.6°−18°=3.6°=21.6°−18°=3.6° ——– (B)
(A) is 5 times (B)
12. The value of the exports of the OPEC countries is how much more than the value of the exports of India and Australia put together; given that OPEC has a 20% share in the value of the exports of ‘Others’?
(a) $1296 billion
(b) $1298 billion
(c) $1305 billion
(d) $1386 billion
(5) None of these
Explanation
(a);Value of the exports of India and Australia:
=7.2°+7.2°=14.4°=7.2°+7.2°=14.4° ——– (A)
Value of exports OPEC countries:
=104.4°×20100=104.4°×20100
=20.88°=20.88° ——– (B)
20.88°−14.4°=6.48°20.88°−14.4°=6.48° is the difference.
In terms of value, difference is:
=72,000×6.48°360°=72,000×6.48°360°
=$1296 billion
13. Considering ‘others’ as a single country, what is the number of countries, whose exports are more than the average exports per country?
(a) 3
(b) 4
(c) 5
(d) 6
(5) None of these
Explanation
(c);
The total number of countries = 14
⇒ Average angle subtended by each country:
=360°14=360°14
≈25.7°≈25.7°
Only USA, Japan, Germany, Russia and Others are greater than 25.7.
So there are 5 such countries whose exports are more than the average exports per country.
14.If exports of developing countries accounted for 36% of the total worldwide exports, then what is the value of the exports of Japan as a percentage of the exports of the developing countries?
(a) 25.01%
(b) 26.23%
(c) 27.77%
(d) 29.87%
(5) 32.68%
Explanation
(c);
Exports of developing countries =36%=36% of total imports
Exports of Japan =10%=10% of total exports
Ratio =1036=1036
=0.2777=0.2777
⇒27.77%
15. By how much does the value of the exports of USA exceed that of Germany?
(a) $ 2300 billion
(b) $ 2520 billion
(c) $ 3516 billion
(d) $ 2860 billion
(5) None of these
Explanation
(b);
The difference in the angles subtended by USA and Germany:
=45°−32.4°=45°−32.4°
=12.6°=12.6°
Difference in the exports of USA and Germany (in $$ billion):
=72,000×12.6°360°=72,000×12.6°360°
=$2520 billion

