
Q1-2. Directions: Study the following graph carefully to answer the question given below it.
Production of Sugar (in thousand tonnes) by three different sugar factories over the years.
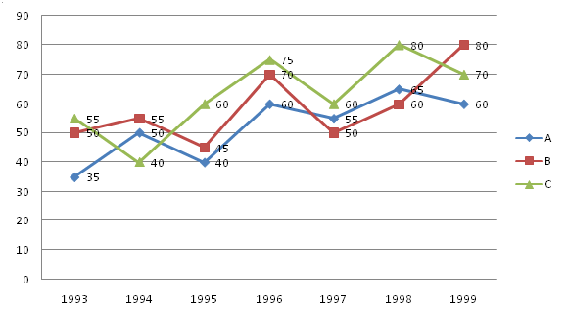
1. For which of the following pairs of years the total production of the three companies together is equal?
(A)1993 – 1994
(B) 1995 – 1997
(C)1996 – 1998
(D) 1994 – 1995
(E) None of these
(a) B only
(b) C only
(c) D only
(d) Both C and D
(e)none of these
EXPLANATION
(d)
2. In which of the following years for company ‘A’ the per cent rise/fall from the previous year is the maximum? (Diazepam)
(a)1996
(b)1993
(c)1995
(d)1998
(e)none of these
EXPLANATION
(a) Percentage increase in 1996=(60 -40)/40 * 100 = 50%
3. Average production per year for company ‘B’ is approximately what per cent of the average production per year for company ‘C’?
(a)105%
(b)85%
(c)107%
(d)93%
(e)none of these
EXPLANATION
(d)Average production per year for company B=(50 + 55 + 45 + 70 + 50 + 60 + 80)/7 =410/7
Average production per year for company C=(55 + 40 + 60 + 75 + 60 + 80 + 70)/7 =440/7
Required Percentage
= 410/440 * 100 = 93%
4. What is the percent rise in production of company ‘C’ in 1996 from 1995?
(a)20%
(b)25%
(c)18%
(d)15%
(e)none of these
EXPLANATION
(b)Required Percentage = (75 – 60)/60 * 100 = 25%
5. What is the difference between the average production of the three companies together in 1997 and the average production of the three companies together in 1999 in thousand tonnes?
(a)20
(b)15
(c)17
(d)22
(e)none of these
EXPLANATION
(b) Required difference
= (80 + 70 + 60)/3 – (60 + 55 + 50)/3
= 210/3 – 165/3 = 70 – 55
15 thousand tonnes
