
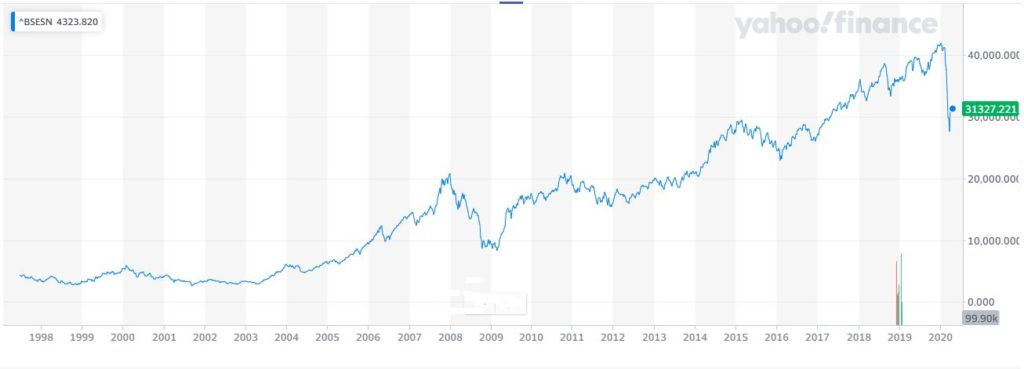
Indian stock markets ups and downs explained with important events from 2000 to 2020. Stock Market introduction and effect on Indian Economy. The BSE SENSEX (also known as the S&P Bombay Stock Exchange or Sensitive Index or simply the SENSEX) is a free-float market-weighted stock market index of 30 well-established and financially sound companies listed on Bombay Stock Exchange. These 30 companies are known as Blue chip companies.
2000 – DOT COM
The Dot-Com Bubble was a stock market bubble caused by excessive speculation in Internet-related companies in the late 1990’s, a period of massive growth in the use and adoption of the Internet. Between 1995 and its peak in March 2000, the Nasdaq Composite stock market index rose 400% only to fall 78% from its peak by October 2002, giving up all its gains during the bubble.
2003 – DECLINE
During the period from April 1, 2003 to June 10, 2003, the weightage of Sensex and Nifty scrips dipped by about five per cent to the total market capitalization (for all the traded stocks) on their respective bourses. This is despite the fact that in FY 2003-04, the Sensex surged by about 6.80 per cent and the Nifty gained around 5.5 per cent.
2006 – US HOUSING BUBBLE
The United States housing bubble was a real estate bubble affecting over half of the U.S. states. Housing prices peaked in early 2006, started to decline in 2006 and 2007, and reached new lows in 2012. On December 30, 2008, the Case–Shiller home price index reported its largest price drop in its history. The credit crisis resulting from the bursting of the housing bubble is an important cause of the 2007–2009 recession in the United States.
2008 – RBI RATE CUT
RBI had started cutting its repo rate from October 2008, when it was lowered from 9% to 8%. Thereafter, rate cuts followed rapidly one after the other and in April 2009, the repo rate was lowered to 4.75%. That was the policy rate prevailing in June and July 2009, when WPI inflation dipped briefly into negative territory. So in July 2009, with WPI inflation at minus 0.3%, the repo rate was at 4.75%.
2008 – PEAK AND CRASH *
It was January 2008 and Indian stock markets were on a hot streak at the start of the year. On 10 January, the benchmark BSE Sensex rose to a record 21,206.77 points, powered by domestic institutional funds on expectations that India will remain a favourite of foreign investors. That was the peak of a bull market that had started in mid-2003, although investors didn’t know it then. It was too good to last. By 21 January, the mood changed dramatically and the BSE Sensex plummeted 7.4%—its biggest single-day decline ever—as concerns over a possible US recession overwhelmed the market.
2010 – BOOM AND RISE
The Sensex came near the 2008 peak again in November 2010 tracking the recovery in the Indian economy. However, the gains could not be sustained, and by December 2011, the Sensex had eased to 15,000 levels, tracking the European debt crisis, which threatened to derail the world economy.
2012 – RECOVERY
India’s GDP growth rose to pre-crisis levels in 2010. This brought back portfolio investments, and Rupee, having touched a low of over 50.00 to the US$ in 2009, recovered to 44.00 by mid-2011.
2012 — 2014 – CONGRESS POLICY PARALYSIS
India’s growth slipped to 5 per cent in 2012-13 and has slumped to 4.6 per cent for the first half of the current fiscal. With economic development having become a poll issue, the Congress party is pinning its hopes on a revival of growth to help win back voters in the forthcoming Lok Sabha elections.
2014 – 2016 – GROWTH
In 2014, when BJP’s Narendra Modi won a historic mandate, equity benchmark Sensex rallied a cool 1,470 points to top the 25,000 mark.
2016 – CHINA ECONOMY SLOWDOWN
China’s economy grew at the slowest pace in 27 years, as the trade war with the United States takes a toll.The second-largest economy in the world grew 6.2% in the second quarter of 2019, a drop from 6.4% in the first quarter, according to data released by the Chinese government. The pace of growth in the second quarter was at its slowest since 1992.
2020 – TAX CUT
The India S&P BSE Sensex index jumped 5.3% to notch its biggest one-day gain since May 5, 2009. That day, the index soared 17.3%. The U.S.-listed iShares MSCI India ETF (INDA) gained about 5.3%, its best day since Sept. 4, 2013, when it popped.
2020 – COVID AND BEYOND
After falling 38% from their mid-January highs, the Sensex and Nifty have recovered around 23% from March lows. Both the key indices have so far gained around 7% in April, after losing over 20% in the previous month. However, the limited upside option for Indian stocks has triggered analysts to cut ratings and targets. With a likely steep fall in earnings estimates, analysts feel that it may be too early to assert that the equity market has discounted all negatives as the number of cases of covid-19 has been escalating.
SOURCES: wikipedia,livemint,business standard,economic times,cnbc,npr,personal research.
