Questions 141–145 share this
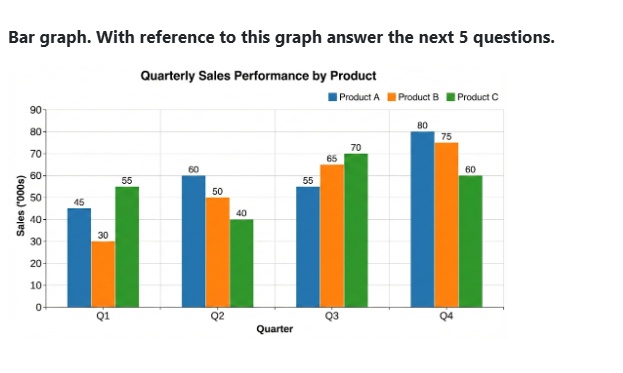
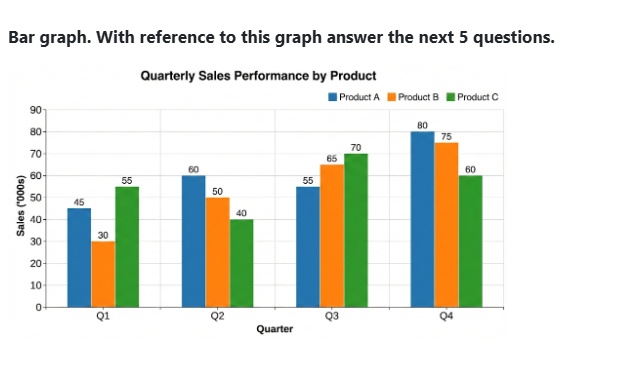
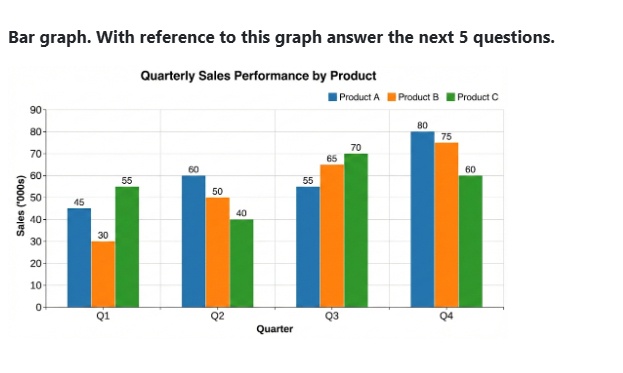
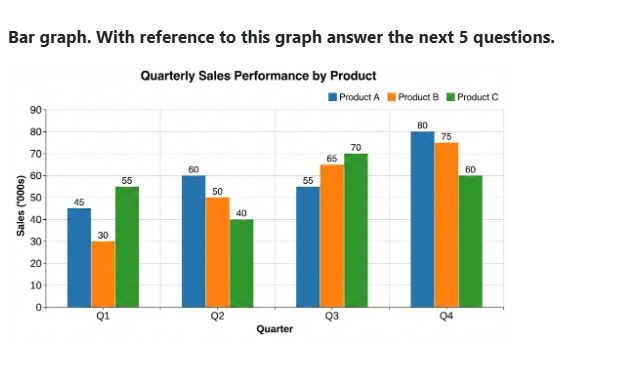
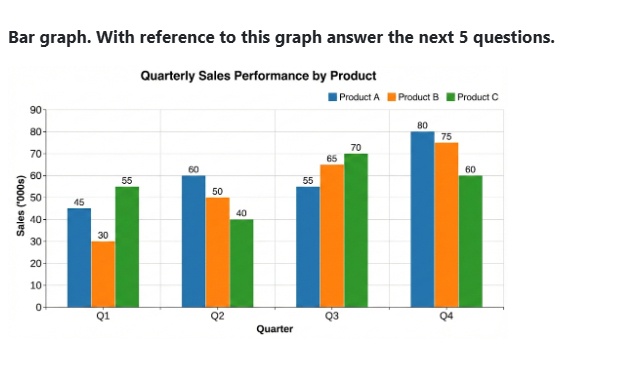
Bar graph. With reference to this graph answer the next 5 questions.
Quarterly Sales Performance by Product (Sales ('000s))
Data read from chart:
| Quarter | Product A | Product B | Product C |
|---|
| Q1 | 45 | 30 | 55 |
| Q2 | 60 | 50 | 40 |
| Q3 | 55 | 65 | 70 |
| Q4 | 80 | 75 | 60 |
What is the average sales of Product B across all four quarters?
Solution — first steps
Approach: Average = sum of the four quarterly values ÷ 4. Solution: Product B: Q1 = 30, Q2 = 50, Q3 = 65, Q4 = 75 (in '000s).
The full step-by-step working opens with a free login.
Refer to the passage above ↑
Which quarter witnessed the highest total sales for all three products combined?
Solution — first steps
Approach: Add the three bars of each quarter and compare. Solution: Q1 = 45 + 30 + 55 = 130.
The full step-by-step working opens with a free login.
Refer to the passage above ↑
What is the percentage increase in sales of Product A from Q1 to Q4?
Solution — first steps
Approach: Percentage increase = (new − old)/old × 100. Solution: Product A: Q1 = 45, Q4 = 80.
The full step-by-step working opens with a free login.
Refer to the passage above ↑
What is the ratio of the total sales of Product C to the total sales of Product A?
Solution — first steps
Approach: Find each product's annual total, then simplify the ratio. Solution: Product C total = 55 + 40 + 70 + 60 = 225.
The full step-by-step working opens with a free login.
Refer to the passage above ↑
In which quarter did Product B have the lowest share of the total sales?
Solution — first steps
Approach: Share = Product B ÷ quarter total; compare fractions. 1%.
The full step-by-step working opens with a free login.