CET DI Tables Questions with Solutions – Page 7
All 30 DI Tables questions from MBA CET 2025 and 2026 papers. Tap Show answer, or open the detailed solution (free login). Page 7 of 7.
Questions 123–124 share this
The following table shows the percentage distribution of workforce in India and the ratio of male to female workforce in India in various sectors during a particular year. Further, its known that the total work force in India during the given year was 6000000.
| Employment Sector | Percentage (%) Distribution | Ratio of Male to Female (M:F) |
|---|---|---|
| Service (SE) | 15% | 3:2 |
| Sales (SA) | 12% | 5:3 |
| Construction and Maintenance(CM) | 9% | 5:4 |
| Professional (PR) | 18% | 5:7 |
| Management (MA) | 21% | 3:4 |
| Production and Transport(PT) | 19% | 5:3 |
| Others (OT) | 6% | 3:5 |
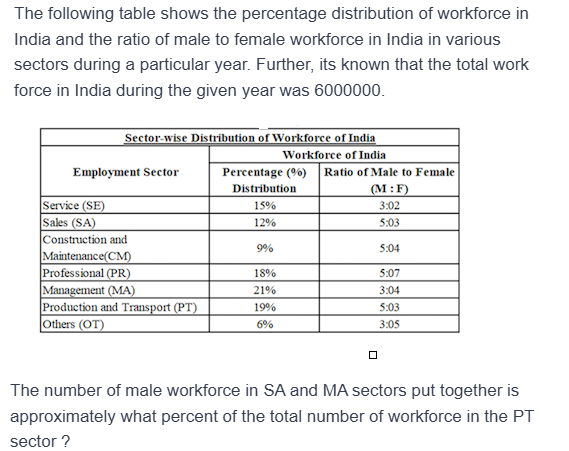
The number of male workforce in SA and MA sectors put together is, approximately what percent of the total number of workforce in the PT sector ?
Answer: B. 87%
Solution — first steps
Approach: Work in % of total workforce; the total cancels. 5/19 is just under 87%.
The full step-by-step working opens with a free login.
Refer to the passage above ↑
The difference in the number of female workforce in SA and MA sectors put together and the number of female workforce in PT sector is approximately close to how much ?
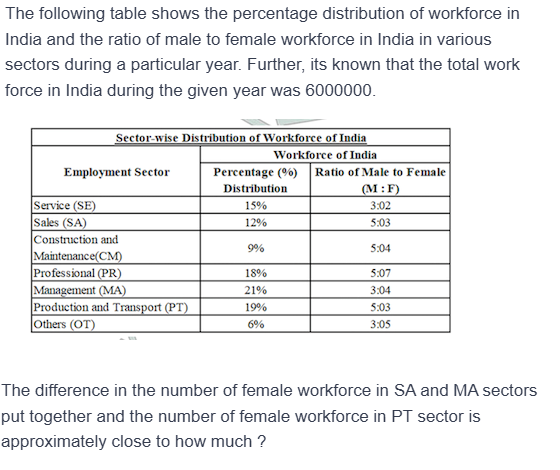
Answer: A. 560000
Solution — first steps
Approach: Female shares in % of total, then convert. 375% of 6,000,000 = 5,62,500 ≈ 5,60,000 Why the other options are wrong: B, C, D: 510000, 570000 and 550000 are all further from 562500.
The full step-by-step working opens with a free login.