CET Bar Graphs Questions with Solutions – Page 6
All 41 Bar Graphs questions from MBA CET 2023 and 2024 and 2026 papers. Tap Show answer, or open the detailed solution (free login). Page 6 of 9.
QUESTION
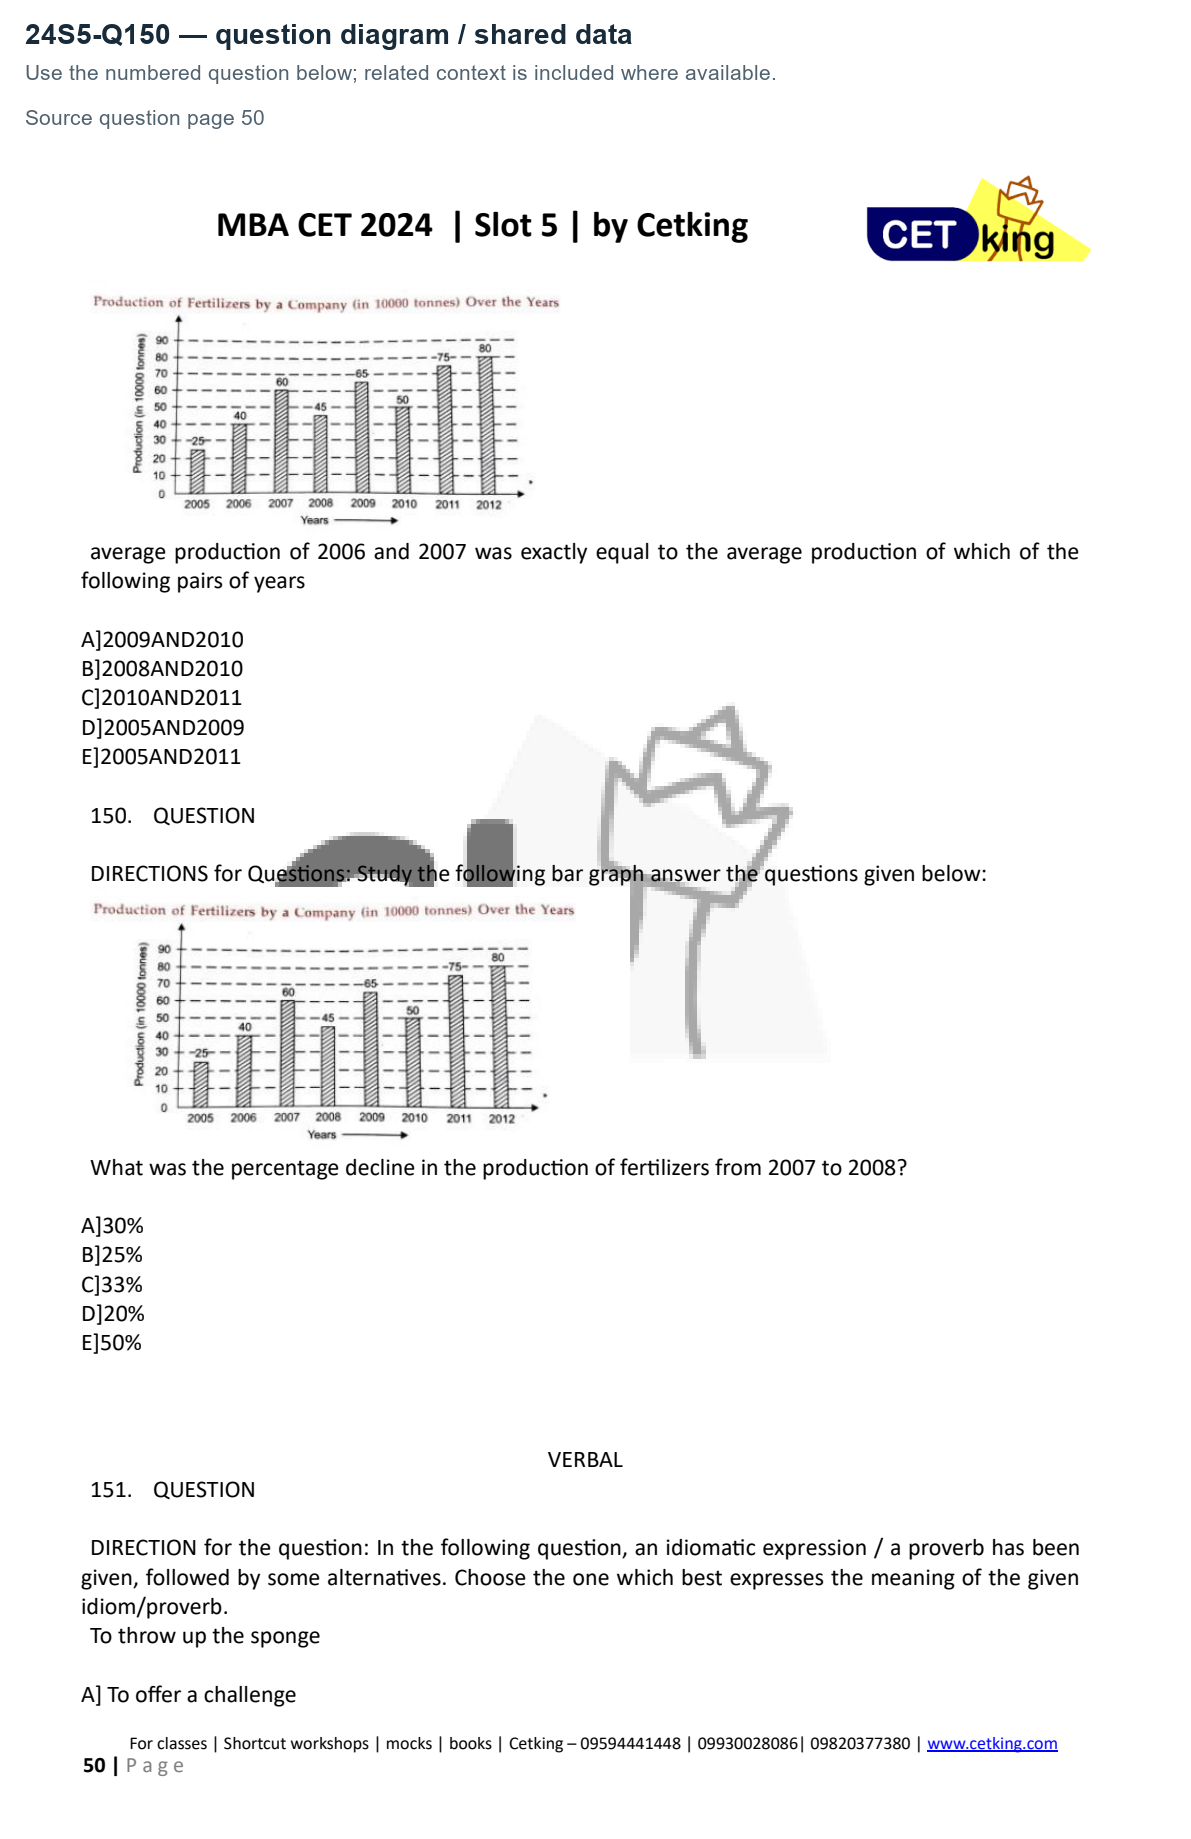
DIRECTIONS for Questions: Study the following bar graph answer the questions given below:
What was the percentage decline in the production of fertilizers from 2007 to 2008?
A]30%
B]25%
C]33%
D]20%
E]50%
VERBAL
DIRECTIONS for Questions: Study the following bar graph answer the questions given below:
What was the percentage decline in the production of fertilizers from 2007 to 2008?
A]30%
B]25%
C]33%
D]20%
E]50%
VERBAL
Answer: B. 25%
Solution — first steps
Production falls60→45. Decline=(60−45)/60×100=25%.
The full step-by-step working opens with a free login.
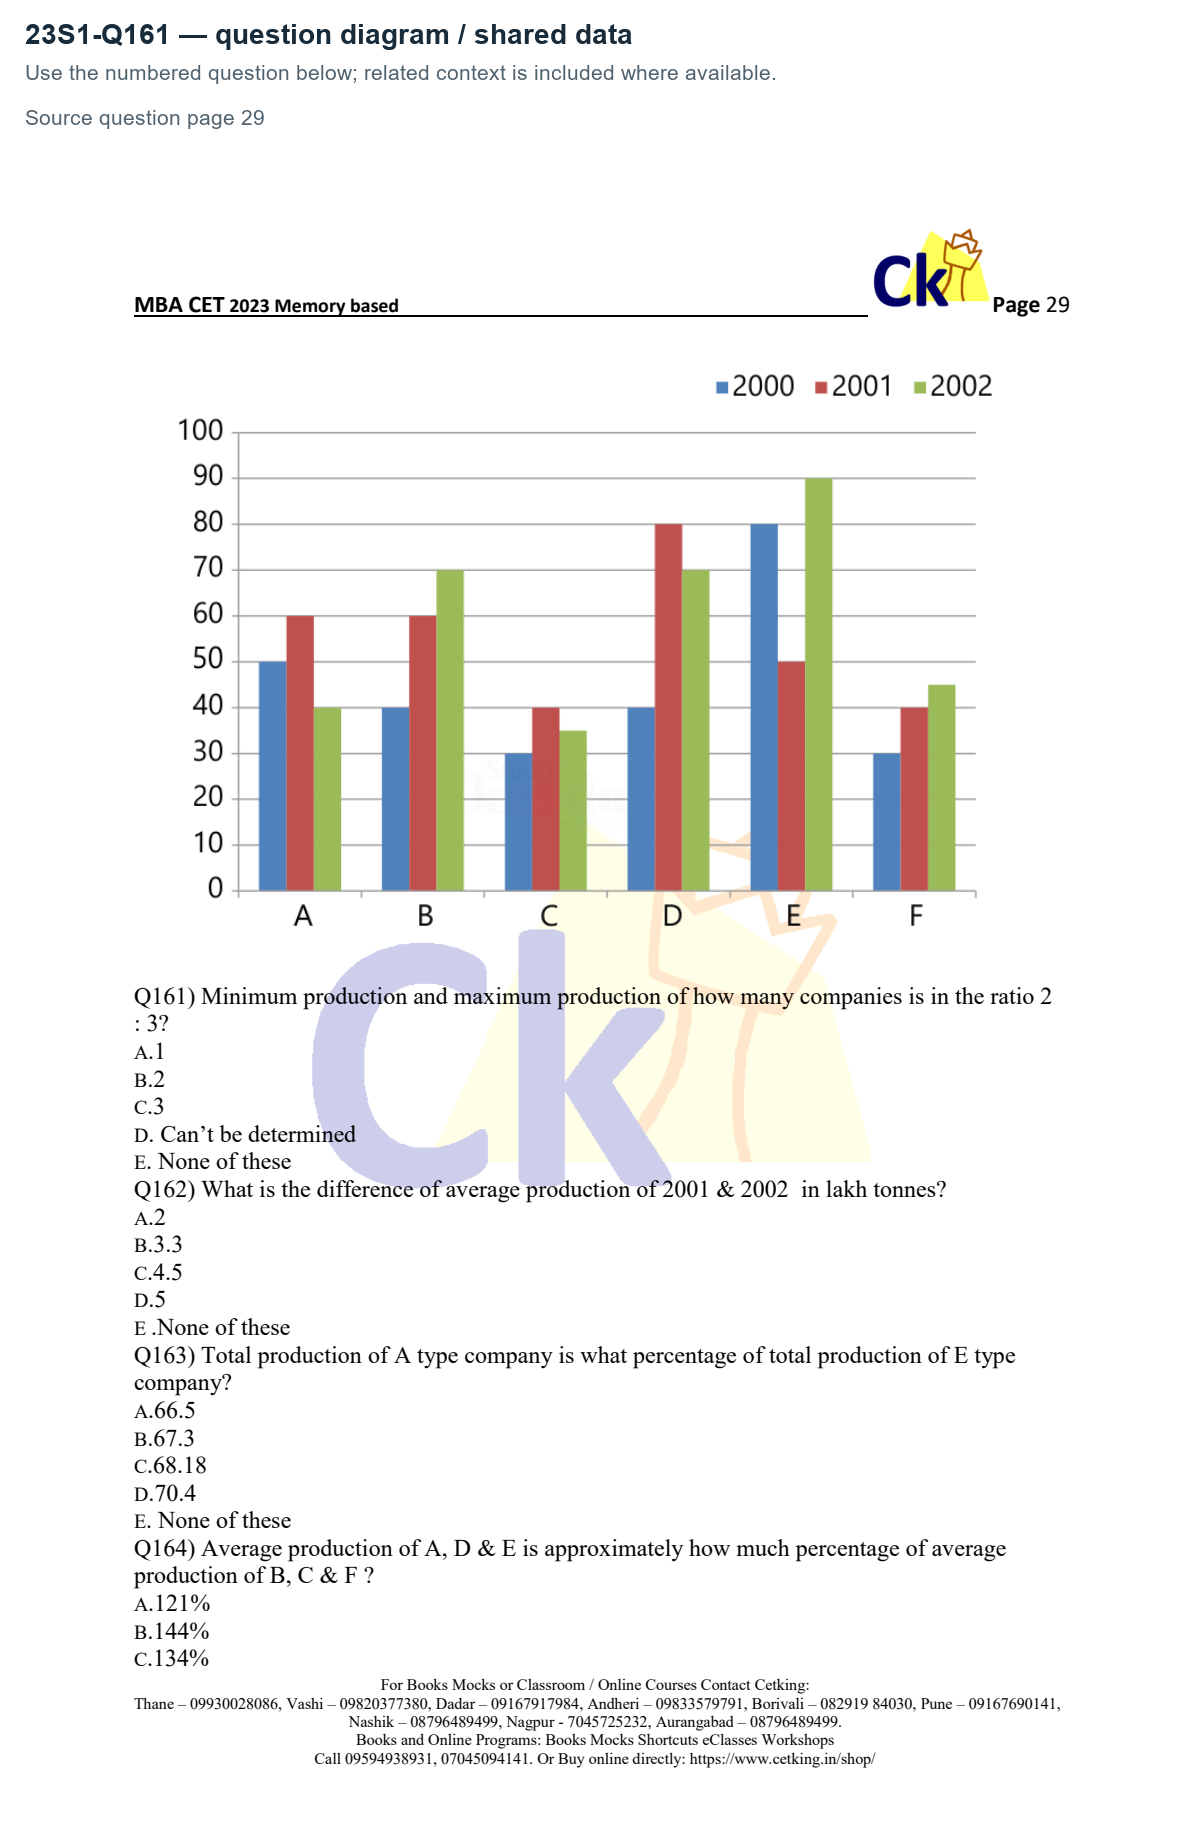
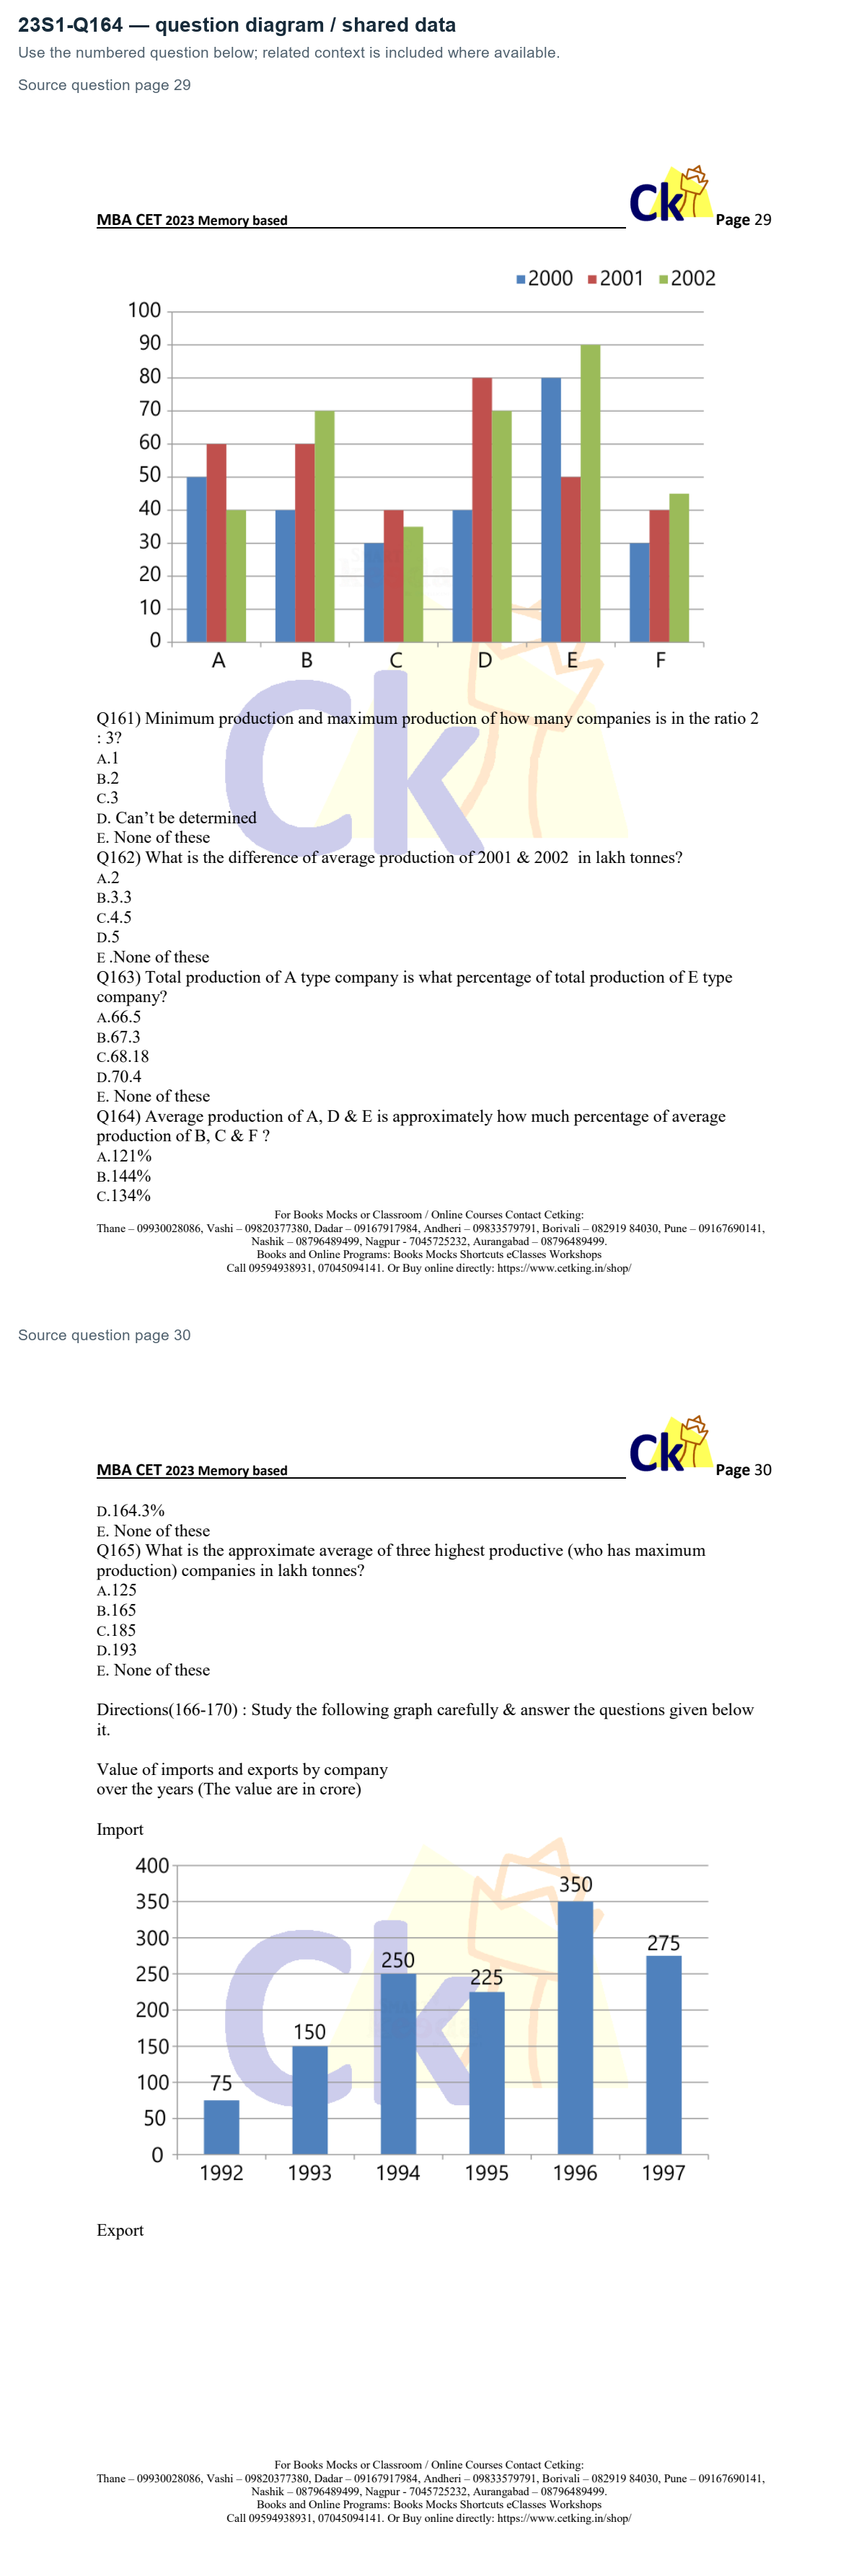
Direction (161-165) : Directions: Study the following graph carefully & answer the questions
given below it.
Production of Steel (in lakh tonnes) by different companies
for three consecutive years 2000, 2001, 2002
Minimum production and maximum production of how many companies is in the ratio 2
: 3?
A.1
B.2
C.3
D. Can’t be determined
E. None of these
given below it.
Production of Steel (in lakh tonnes) by different companies
for three consecutive years 2000, 2001, 2002
Minimum production and maximum production of how many companies is in the ratio 2
: 3?
A.1
B.2
C.3
D. Can’t be determined
E. None of these
Answer: B. 2
Solution — first steps
From the chart:A min/max40/60=2/3; F30/45=2/3. B40/70,C30/40,D40/80,E50/90 do not.
The full step-by-step working opens with a free login.
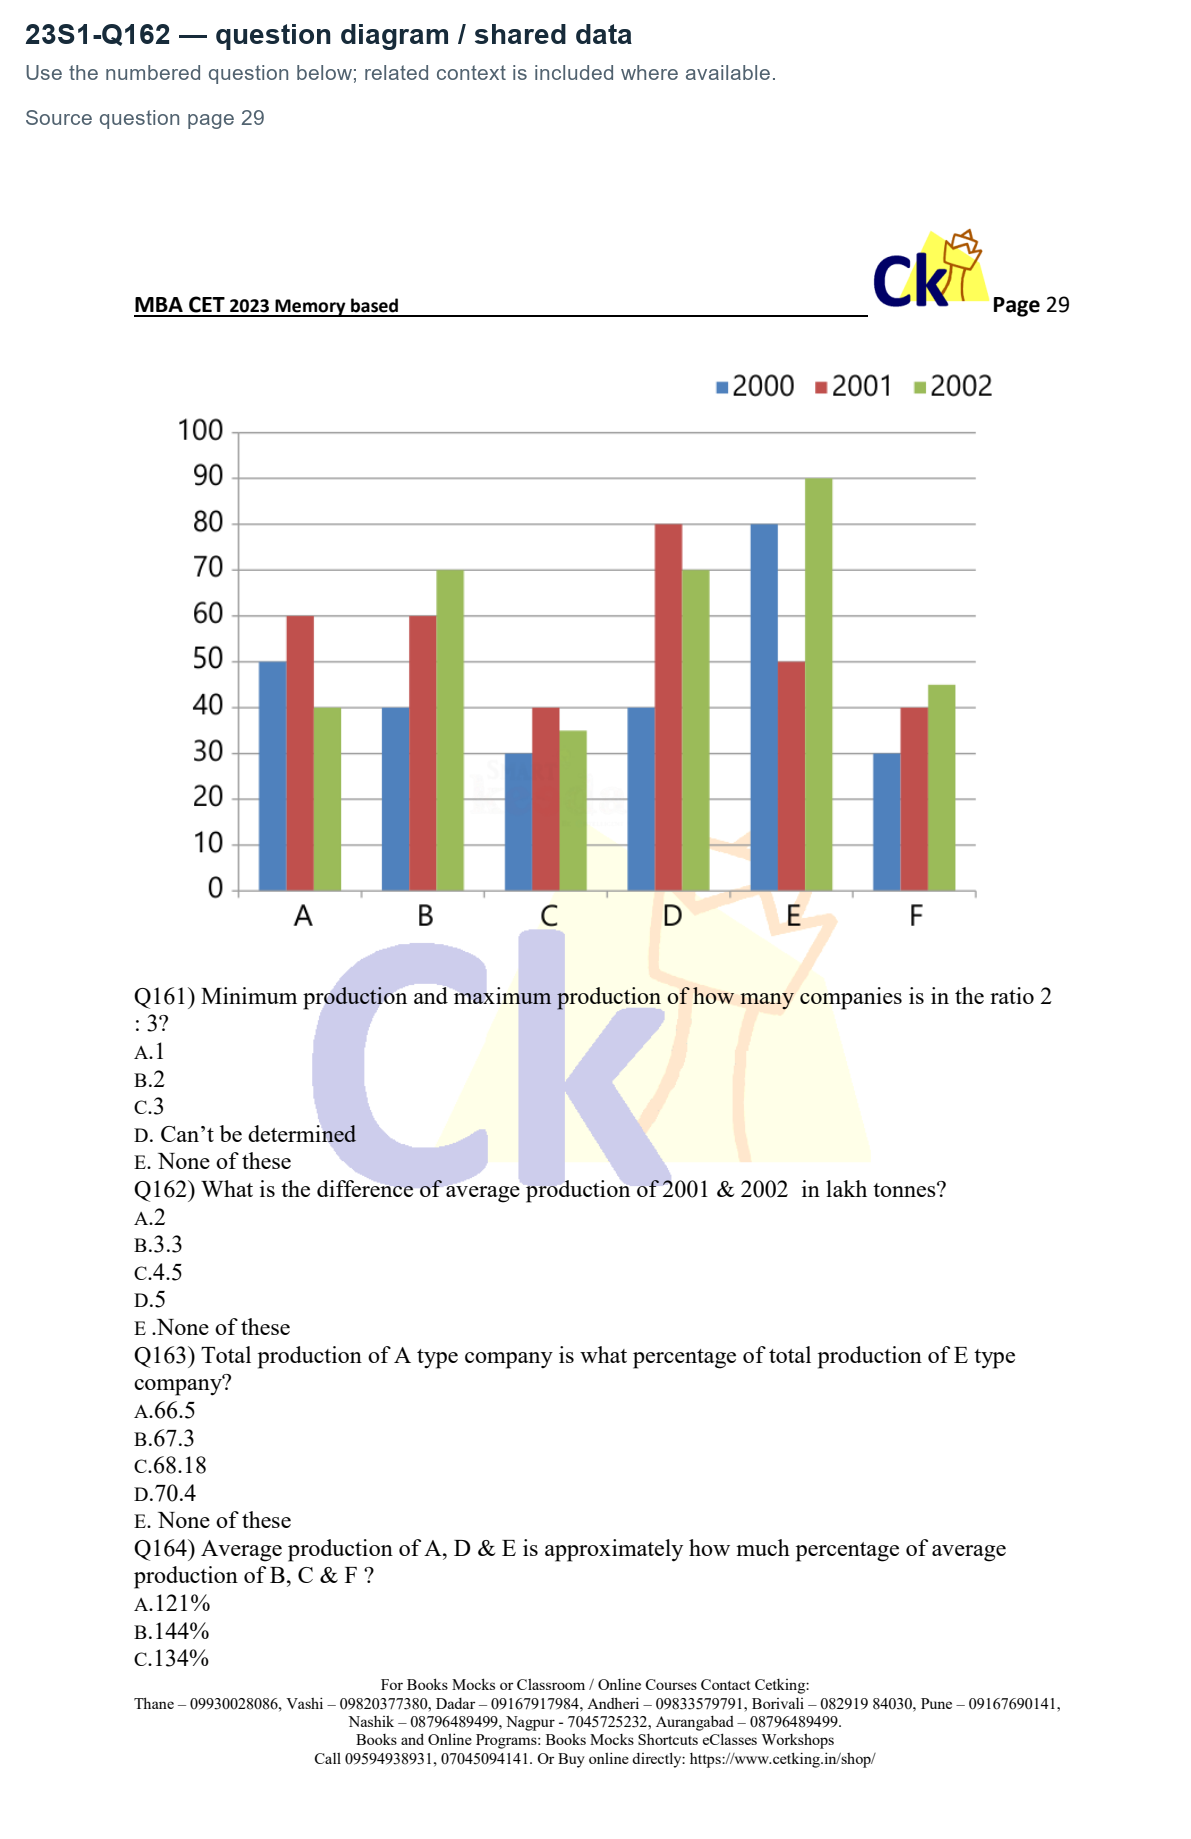
Direction (161-165) : Directions: Study the following graph carefully & answer the questions
given below it.
Production of Steel (in lakh tonnes) by different companies
for three consecutive years 2000, 2001, 2002
What is the difference of average production of 2001 & 2002 in lakh tonnes?
A.2
B.3.3
C.4.5
D.5
E .None of these
given below it.
Production of Steel (in lakh tonnes) by different companies
for three consecutive years 2000, 2001, 2002
What is the difference of average production of 2001 & 2002 in lakh tonnes?
A.2
B.3.3
C.4.5
D.5
E .None of these
Answer: B. 3.3
Solution — first steps
Year2001 total=60+60+40+80+50+40=330. Year2002 total=40+70+35+70+90+45=350.
The full step-by-step working opens with a free login.
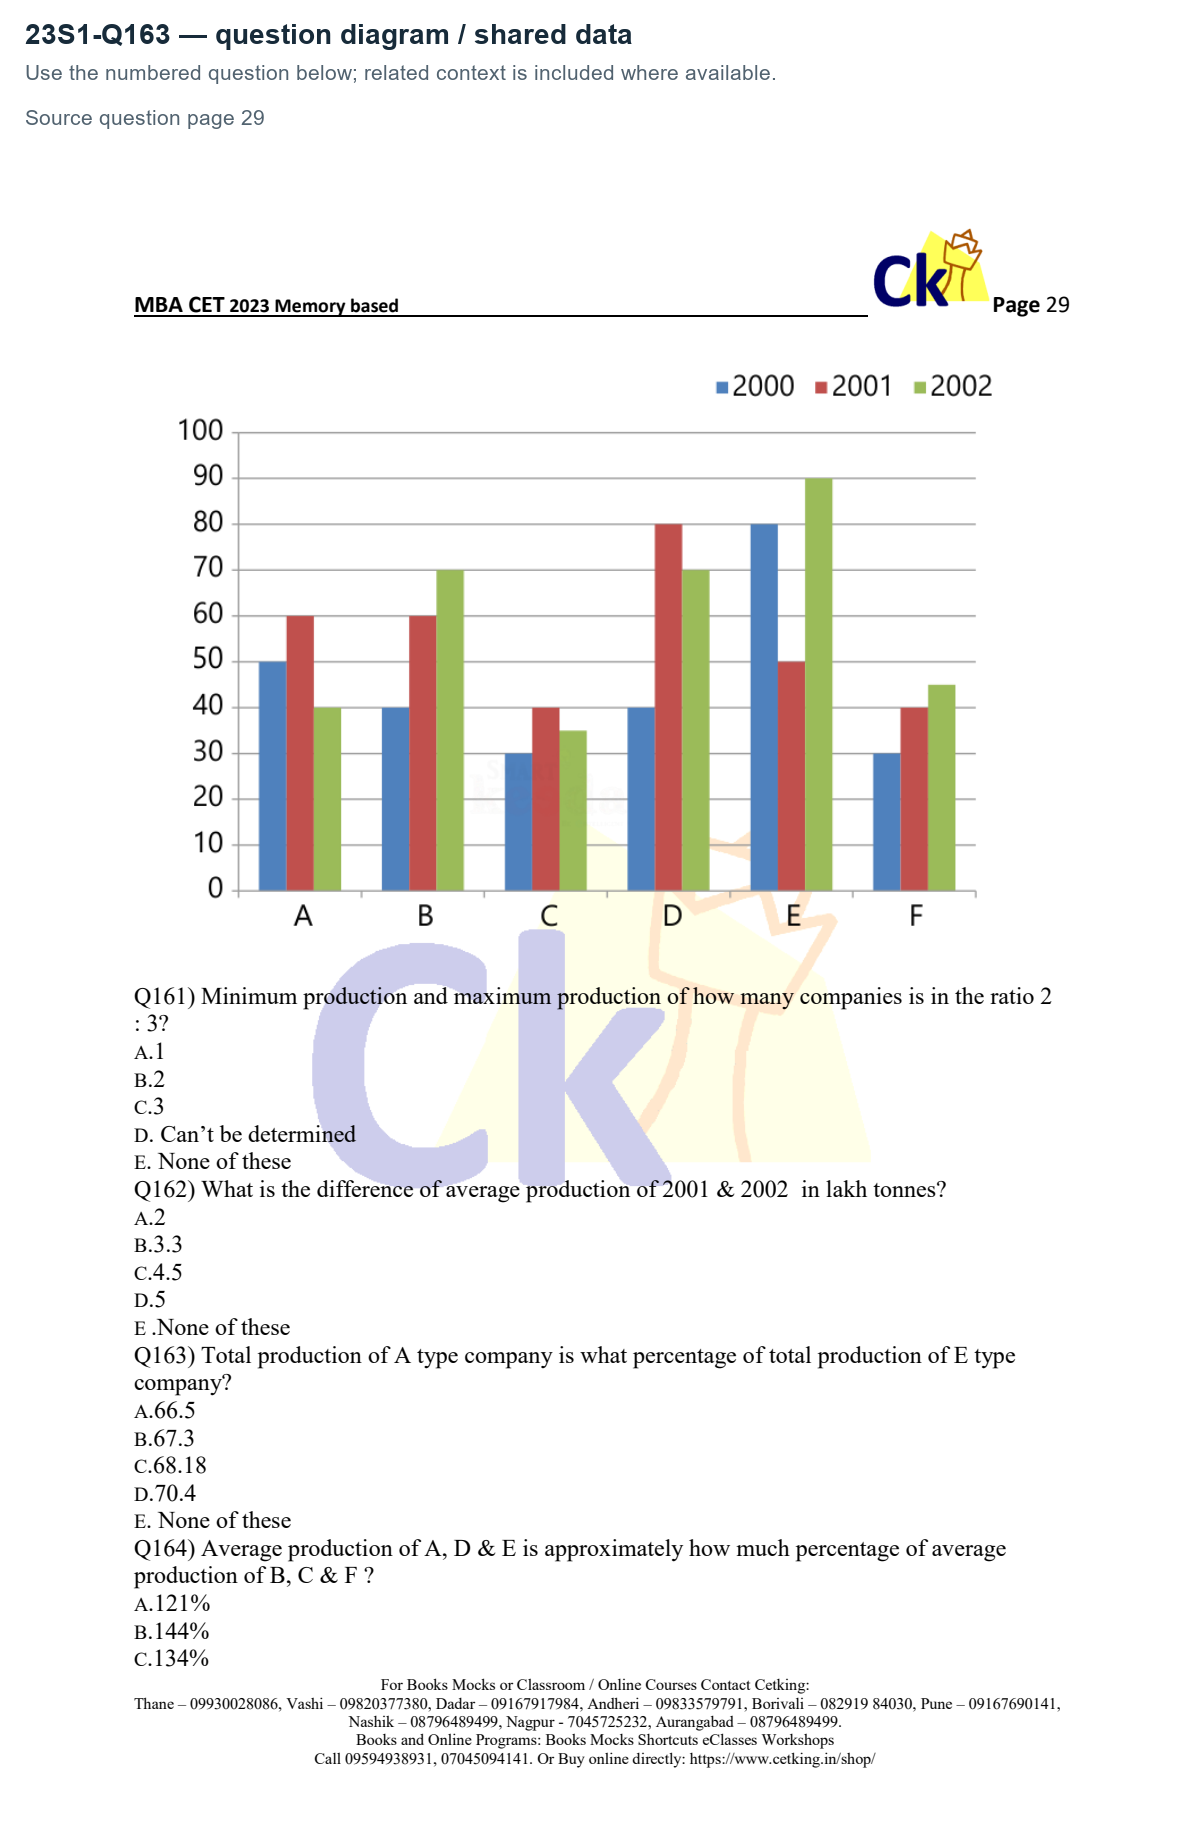
Direction (161-165) : Directions: Study the following graph carefully & answer the questions
given below it.
Production of Steel (in lakh tonnes) by different companies
for three consecutive years 2000, 2001, 2002
Total production of A type company is what percentage of total production of E type
company?
A.66.5
B.67.3
C.68.18
D.70.4
E. None of these
given below it.
Production of Steel (in lakh tonnes) by different companies
for three consecutive years 2000, 2001, 2002
Total production of A type company is what percentage of total production of E type
company?
A.66.5
B.67.3
C.68.18
D.70.4
E. None of these
Answer: C. 68.18
Solution — first steps
A total50+60+40=150. E total80+50+90=220.
The full step-by-step working opens with a free login.
Direction (161-165) : Directions: Study the following graph carefully & answer the questions
given below it.
Production of Steel (in lakh tonnes) by different companies
for three consecutive years 2000, 2001, 2002
Average production of A, D & E is approximately how much percentage of average
production of B, C & F ?
A.121%
B.144%
C.134%
D.164.3%
E. None of these
given below it.
Production of Steel (in lakh tonnes) by different companies
for three consecutive years 2000, 2001, 2002
Average production of A, D & E is approximately how much percentage of average
production of B, C & F ?
A.121%
B.144%
C.134%
D.164.3%
E. None of these
Answer: B. 144%
Solution — first steps
A+D+E totals150+190+220=560. B+C+F totals170+105+115=390.
The full step-by-step working opens with a free login.