CET 2024 Slot 5 Question Paper with Solutions PDF – Page 32
All 200 questions of CET 2024 Slot 5. Tap Show answer, or open the detailed solution (free login). Page 32 of 42.
QUESTION
DIRECTIONS for Questions: In the following bar graphs given below, one shows the amount (in lakh Rs.)
invested by a company in purchasing raw materials over the years and the other shows the value (in
lakh Rs.) of finished goods sold by the company over the years. Study the bar graphs and answer the
questions based on them
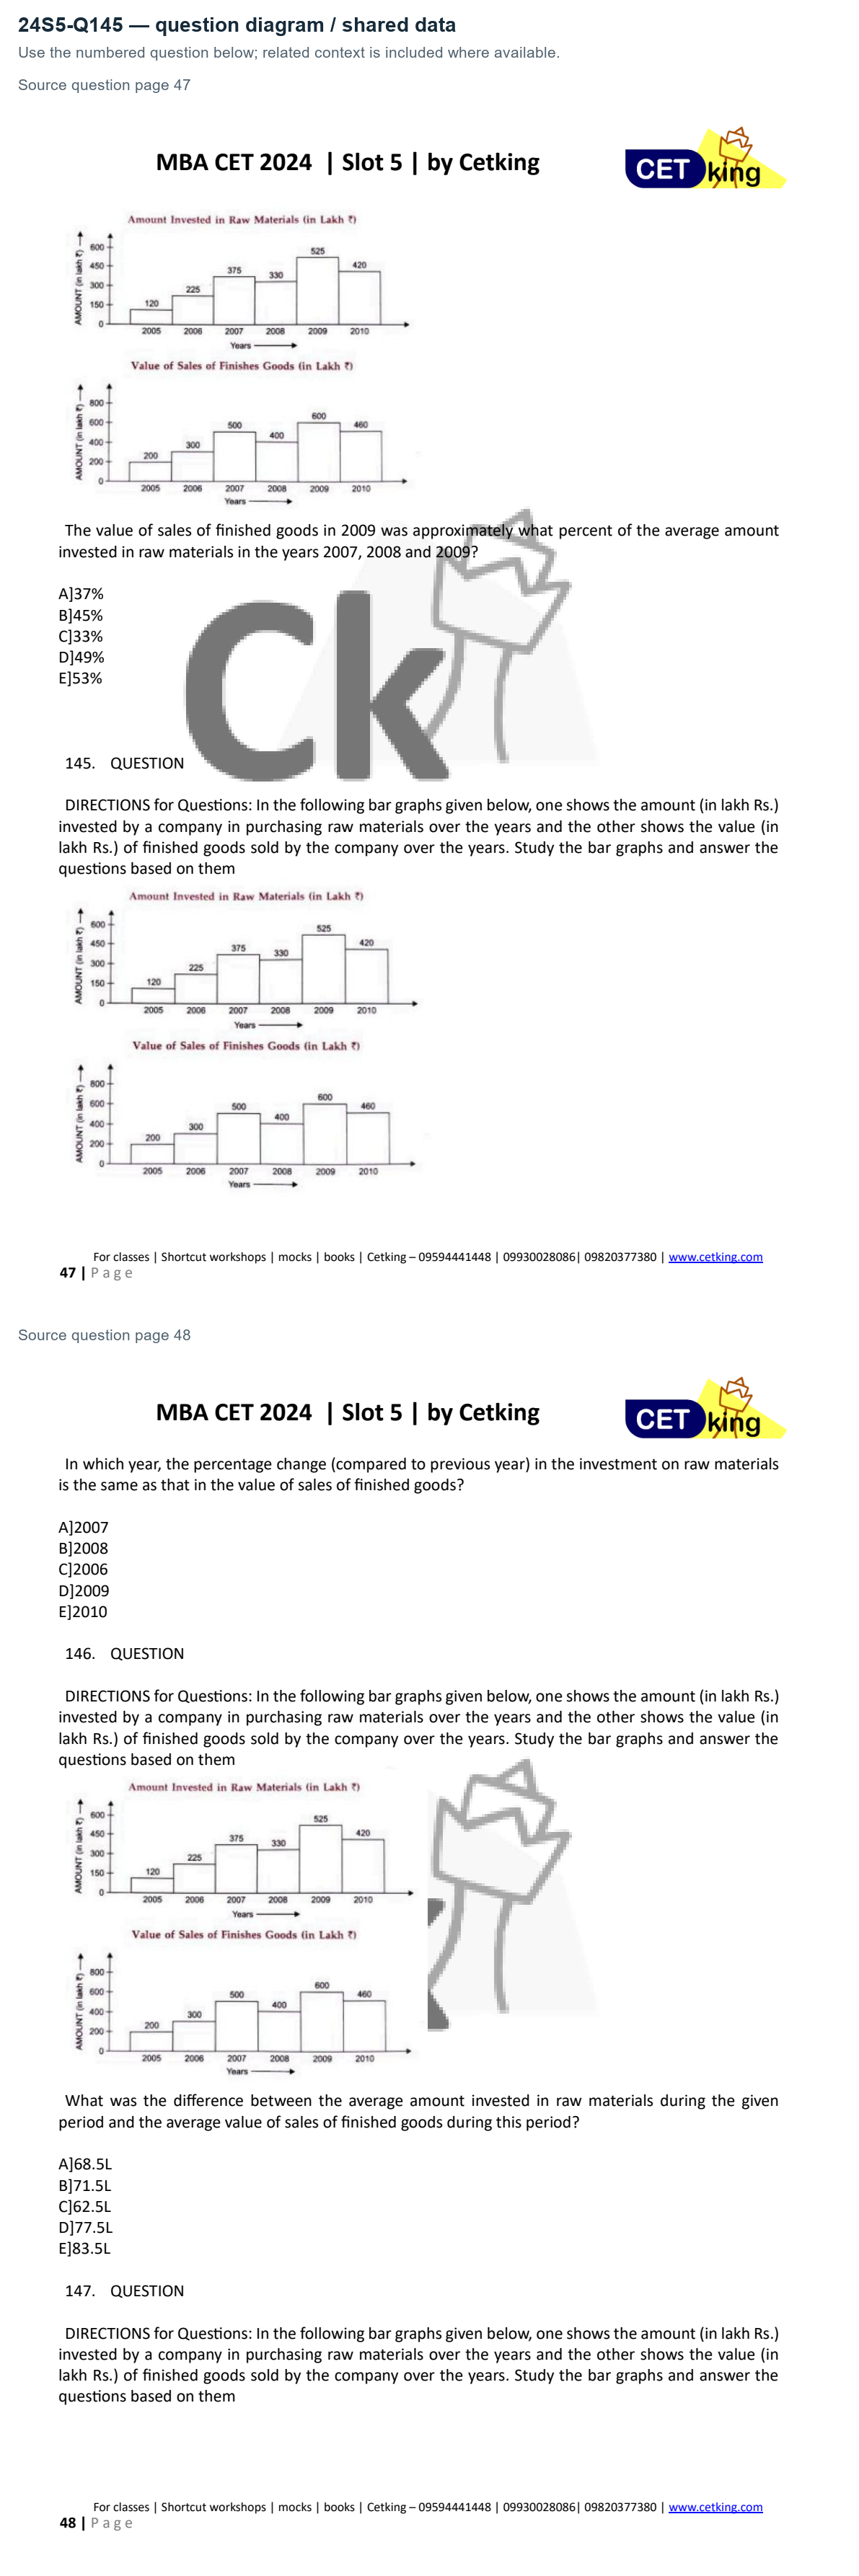
In which year, the percentage change (compared to previous year) in the investment on raw materials
is the same as that in the value of sales of finished goods?
A]2007
B]2008
C]2006
D]2009
E]2010
DIRECTIONS for Questions: In the following bar graphs given below, one shows the amount (in lakh Rs.)
invested by a company in purchasing raw materials over the years and the other shows the value (in
lakh Rs.) of finished goods sold by the company over the years. Study the bar graphs and answer the
questions based on them
In which year, the percentage change (compared to previous year) in the investment on raw materials
is the same as that in the value of sales of finished goods?
A]2007
B]2008
C]2006
D]2009
E]2010
Answer: A. 2007
Solution — first steps
67%. Other years have different percentage changes.
The full step-by-step working opens with a free login.
QUESTION
DIRECTIONS for Questions: In the following bar graphs given below, one shows the amount (in lakh Rs.)
invested by a company in purchasing raw materials over the years and the other shows the value (in
lakh Rs.) of finished goods sold by the company over the years. Study the bar graphs and answer the
questions based on them
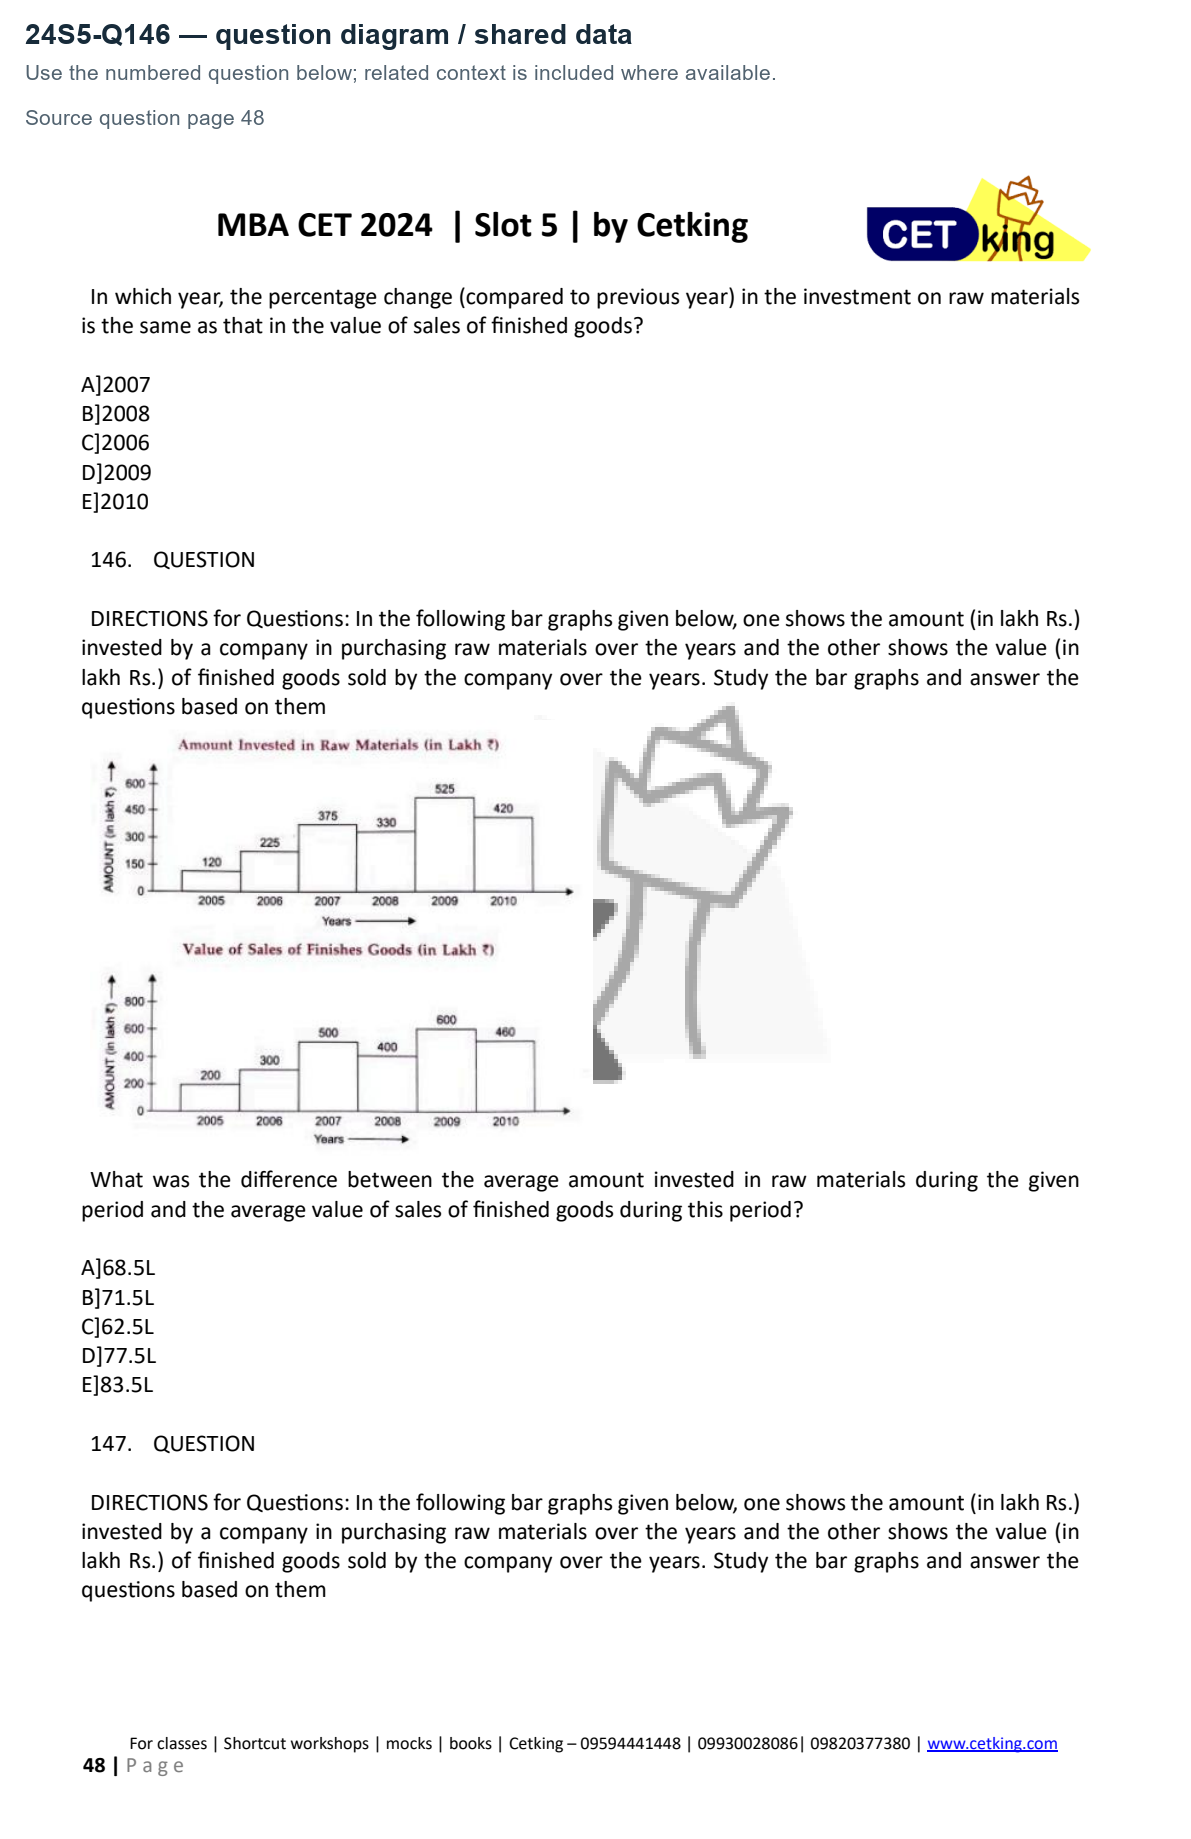
What was the difference between the average amount invested in raw materials during the given
period and the average value of sales of finished goods during this period?
A]68.5L
B]71.5L
C]62.5L
D]77.5L
E]83.5L
DIRECTIONS for Questions: In the following bar graphs given below, one shows the amount (in lakh Rs.)
invested by a company in purchasing raw materials over the years and the other shows the value (in
lakh Rs.) of finished goods sold by the company over the years. Study the bar graphs and answer the
questions based on them
What was the difference between the average amount invested in raw materials during the given
period and the average value of sales of finished goods during this period?
A]68.5L
B]71.5L
C]62.5L
D]77.5L
E]83.5L
Answer: D. 77.5L
Solution — first steps
Raw-material total120+225+375+330+525+420=1995. Sales total200+300+500+400+600+460=2460.
The full step-by-step working opens with a free login.
QUESTION
DIRECTIONS for Questions: In the following bar graphs given below, one shows the amount (in lakh Rs.)
invested by a company in purchasing raw materials over the years and the other shows the value (in
lakh Rs.) of finished goods sold by the company over the years. Study the bar graphs and answer the
questions based on them
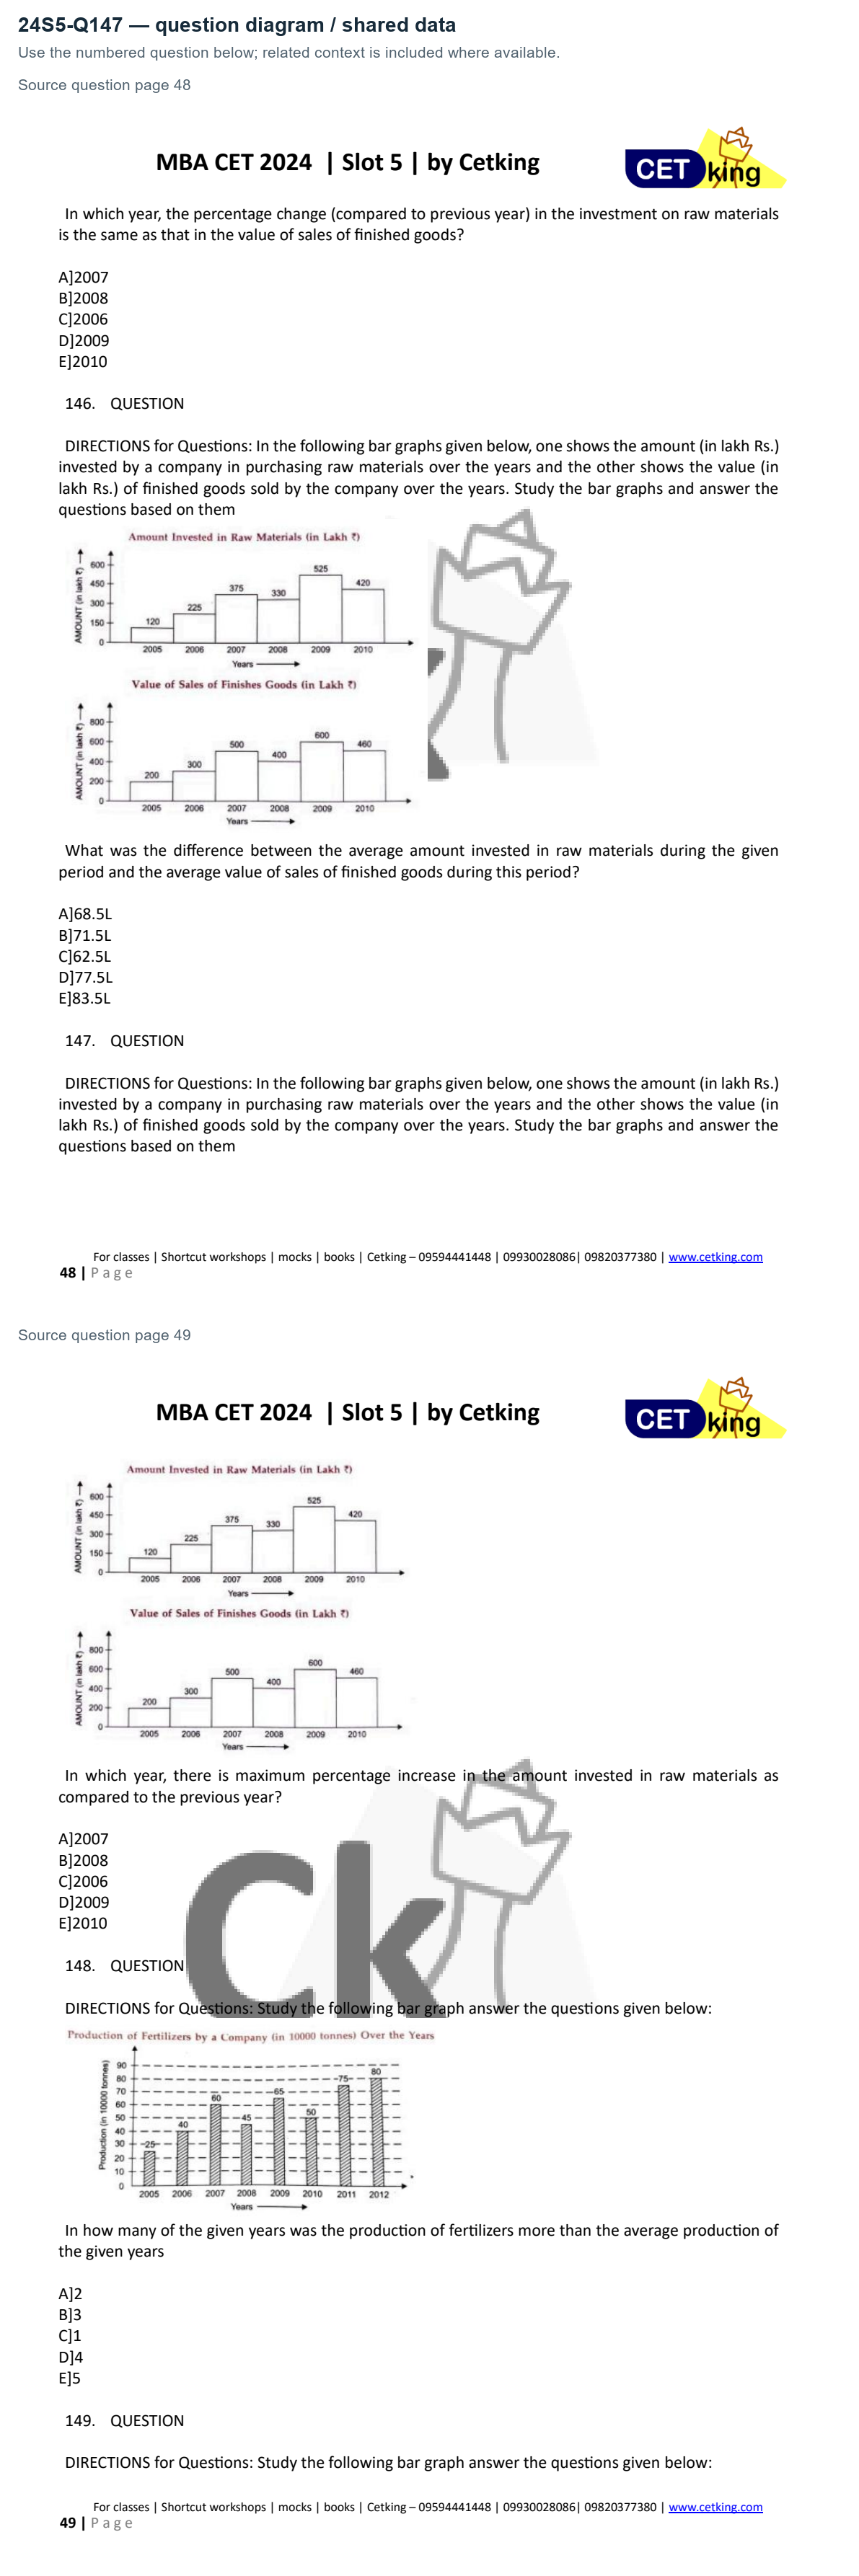
In which year, there is maximum percentage increase in the amount invested in raw materials as
compared to the previous year?
A]2007
B]2008
C]2006
D]2009
E]2010
DIRECTIONS for Questions: In the following bar graphs given below, one shows the amount (in lakh Rs.)
invested by a company in purchasing raw materials over the years and the other shows the value (in
lakh Rs.) of finished goods sold by the company over the years. Study the bar graphs and answer the
questions based on them
In which year, there is maximum percentage increase in the amount invested in raw materials as
compared to the previous year?
A]2007
B]2008
C]2006
D]2009
E]2010
Answer: C. 2006
Solution — first steps
09%,−20%. Maximum percentage increase is2006, option C.
The full step-by-step working opens with a free login.
QUESTION
DIRECTIONS for Questions: Study the following bar graph answer the questions given below:
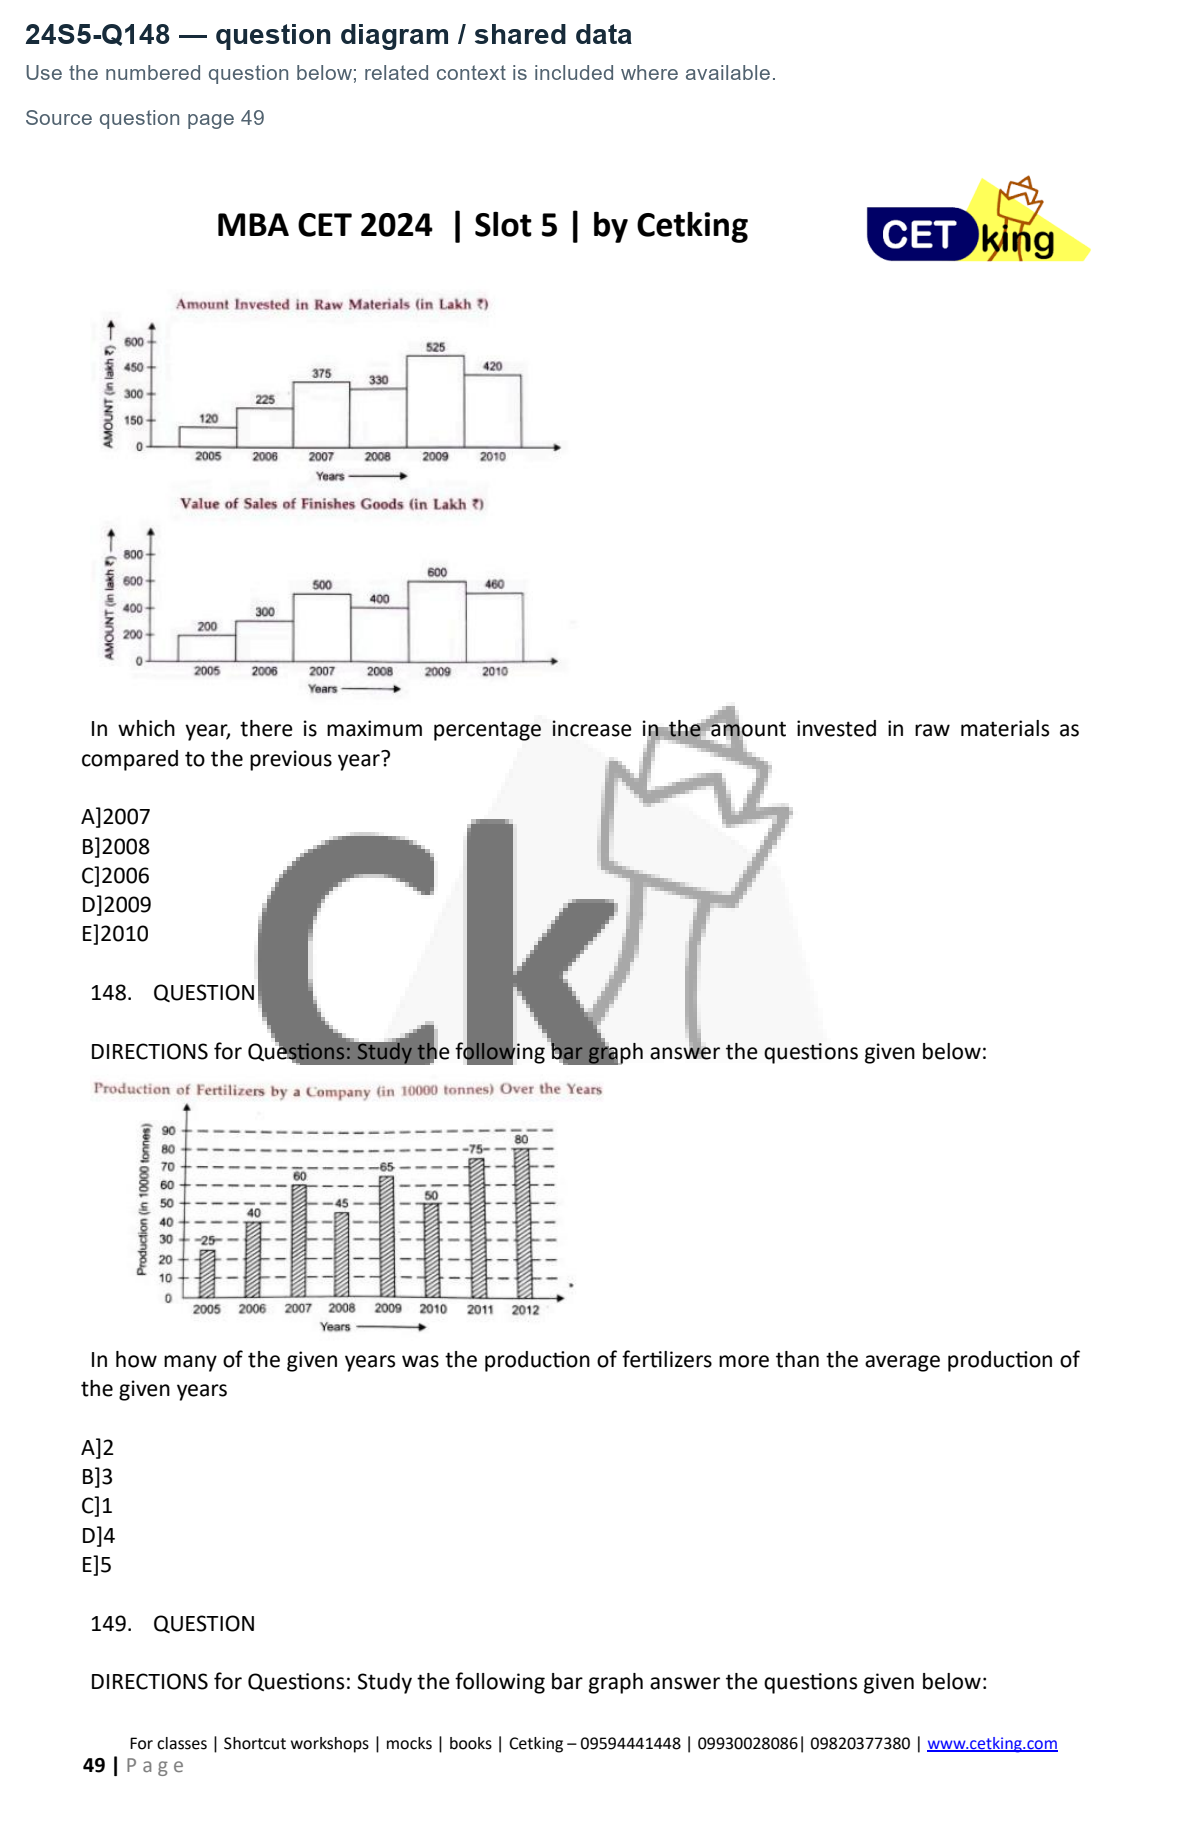
In how many of the given years was the production of fertilizers more than the average production of
the given years
A]2
B]3
C]1
D]4
E]5
DIRECTIONS for Questions: Study the following bar graph answer the questions given below:
In how many of the given years was the production of fertilizers more than the average production of
the given years
A]2
B]3
C]1
D]4
E]5
Answer: D. 4
Solution — first steps
Fertilizer values25,40,60,45,65,50,75,80 total440; mean55. Four values60,65,75,80 exceed it.
The full step-by-step working opens with a free login.
QUESTION
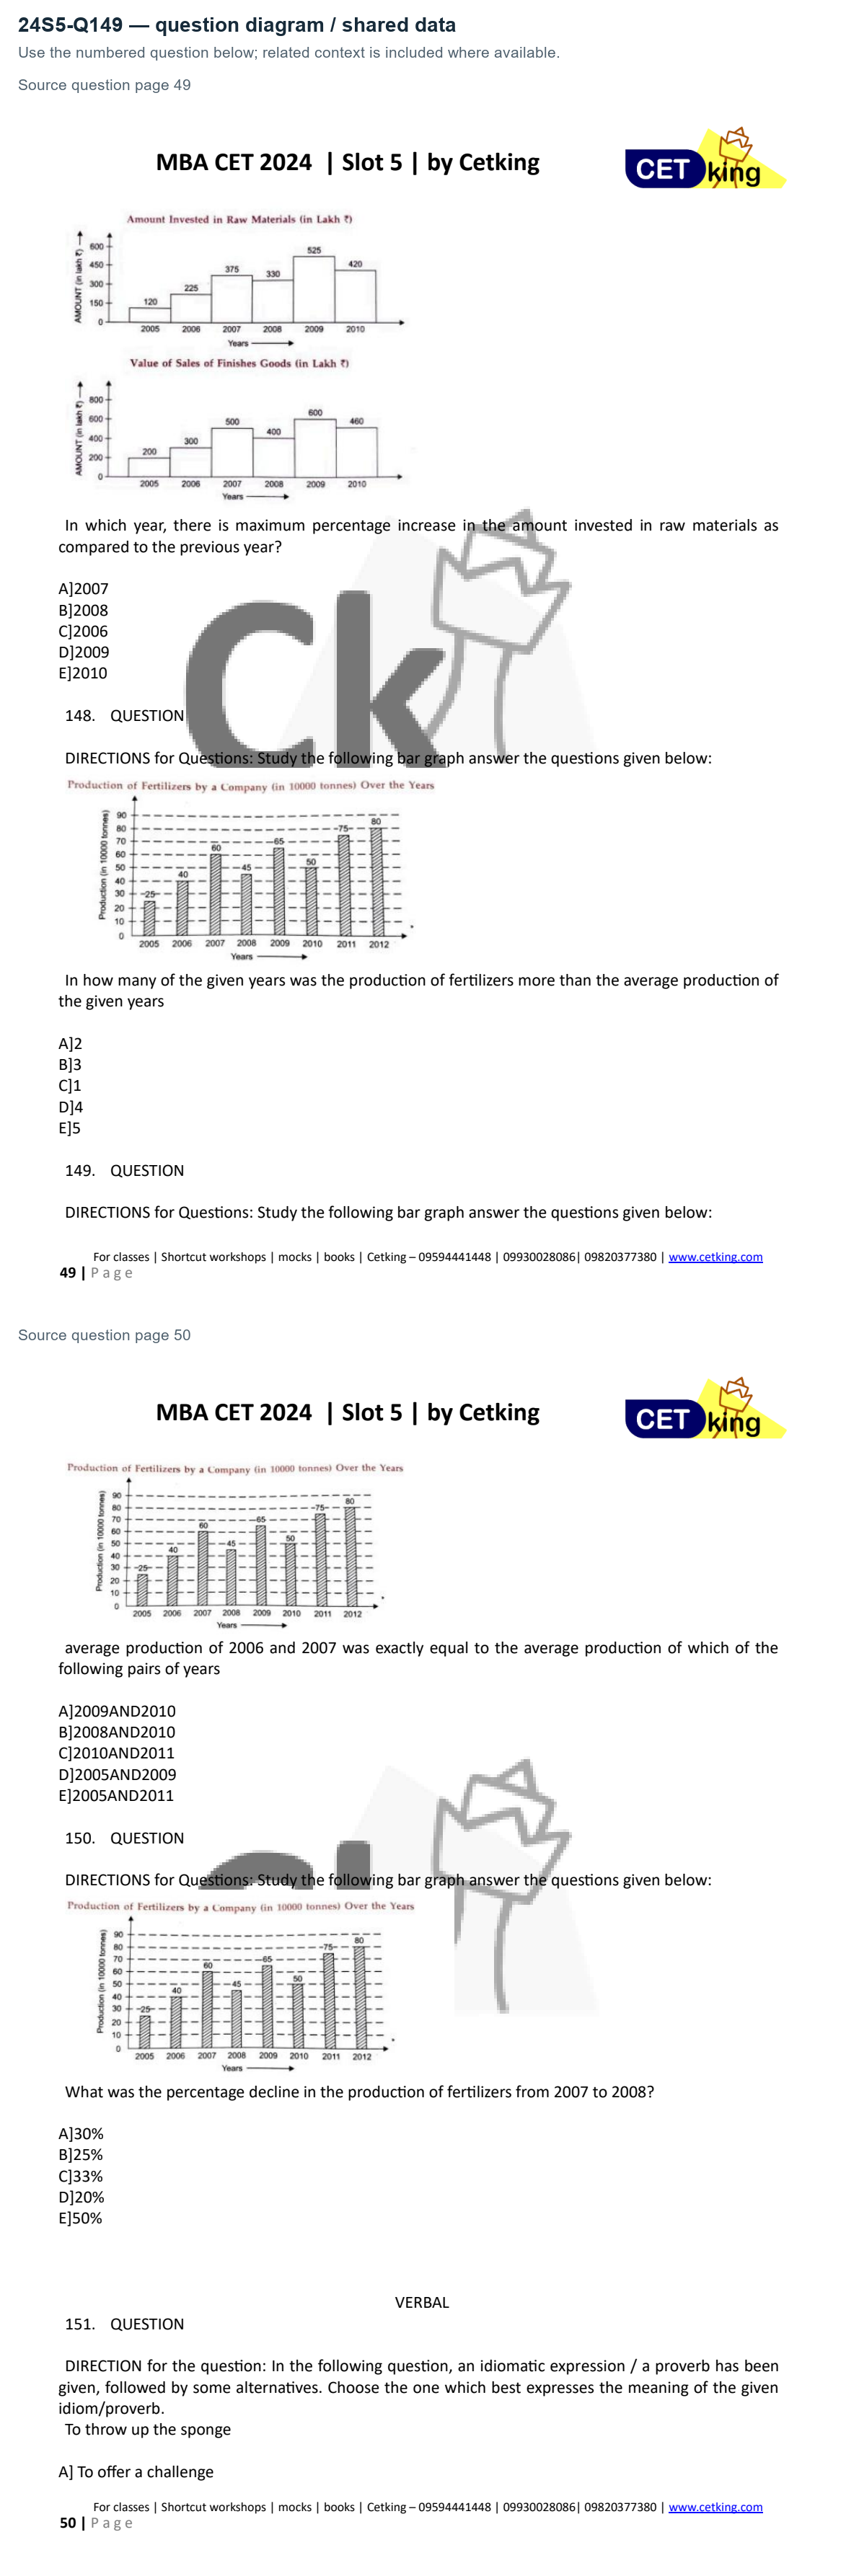
DIRECTIONS for Questions: Study the following bar graph answer the questions given below:
average production of 2006 and 2007 was exactly equal to the average production of which of the
following pairs of years
A]2009AND2010
B]2008AND2010
C]2010AND2011
D]2005AND2009
E]2005AND2011
DIRECTIONS for Questions: Study the following bar graph answer the questions given below:
average production of 2006 and 2007 was exactly equal to the average production of which of the
following pairs of years
A]2009AND2010
B]2008AND2010
C]2010AND2011
D]2005AND2009
E]2005AND2011
Answer: E. 2005AND2011
Solution — first steps
2006+2007=40+60=100. The offered pair2005+2011=25+75=100, giving the same average50.
The full step-by-step working opens with a free login.