CET 2025 Slot 3 · Quant – Page 11
All 50 Quant questions of CET 2025 Slot 3. Tap Show answer, or open the detailed solution (free login). Page 11 of 12.
Questions 146–148 share this
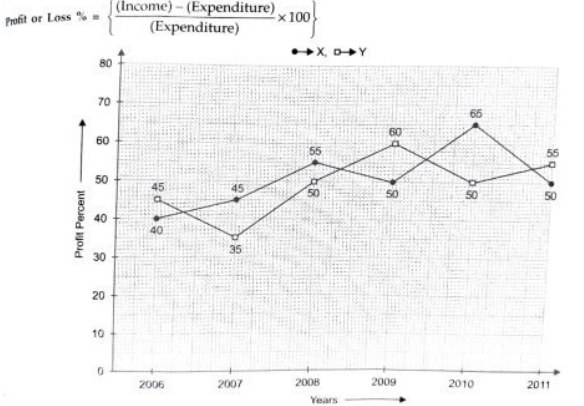
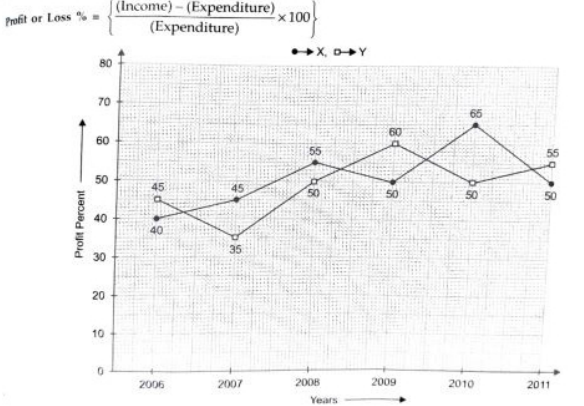
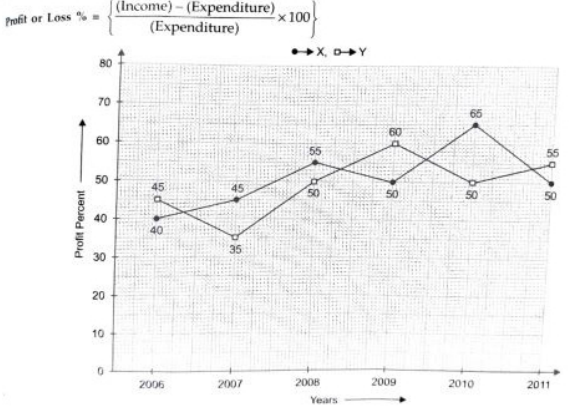
The following line graph gives the % profit earned by 2 companies X and Y during period 2006-11. Study the line graph and answer the questions that are based on it.
% profit earned by Companies X and Y Given Years
If the expenditure of company Y in 2007 was Rs. 220 cr, what was its income in that year?
Answer: C. 297
Solution — first steps
Approach: Income = E × (1 + P/100). Solution: From the graph, Y's profit % in 2007 = 35%.
The full step-by-step working opens with a free login.
Refer to the passage above ↑
If the Income of 2 companies were equal in 2009, what was the ratio of expenditure of company X to that of company Y in that year?
Answer: D. 16:15
Solution — first steps
Approach: E = I ÷ (1 + P/100); incomes equal. Solution: From the graph, 2009: X = 50%, Y = 60%.
The full step-by-step working opens with a free login.
Refer to the passage above ↑
The incomes of the companies X and Y in 2010 were in ratio 3:4 respectively. What was the respective ratio of their expenditure in 2010?
Answer: A. 15:22
Solution — first steps
Approach: Divide each income by (1 + profit%). Solution: From the graph, 2010: X = 65%, Y = 50%.
The full step-by-step working opens with a free login.