CET 2026 Slot 1 · MBA CET 2026 Attempt 1 Slot 1 · Quant – Page 10
All 50 Quant questions of CET 2026 Slot 1. Tap Show answer, or open the detailed solution (free login). Page 10 of 10.
Questions 146–150 share this
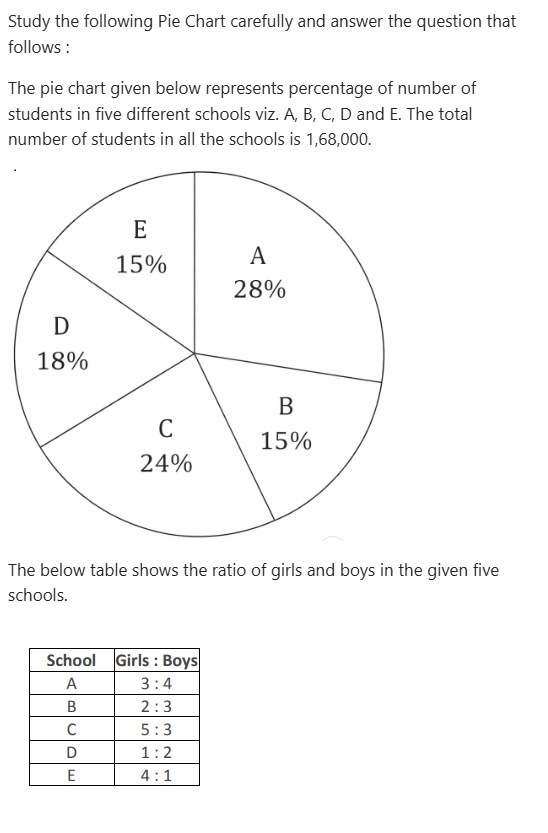
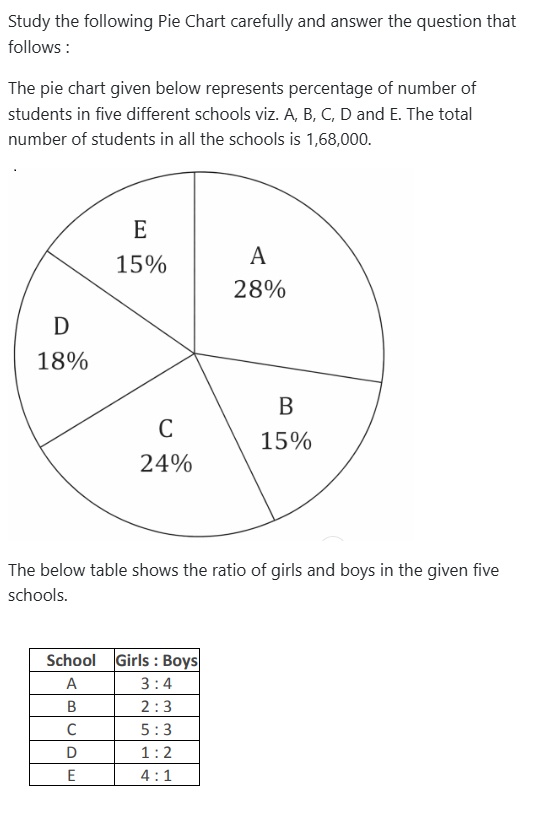
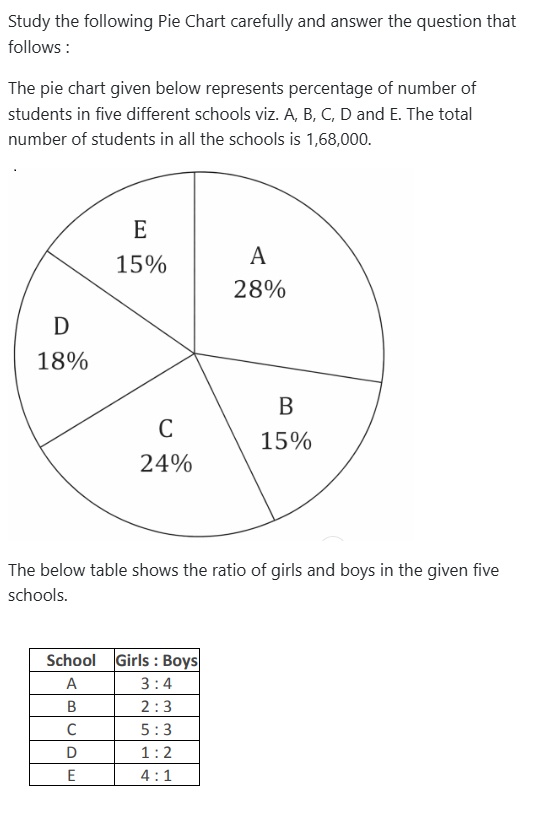
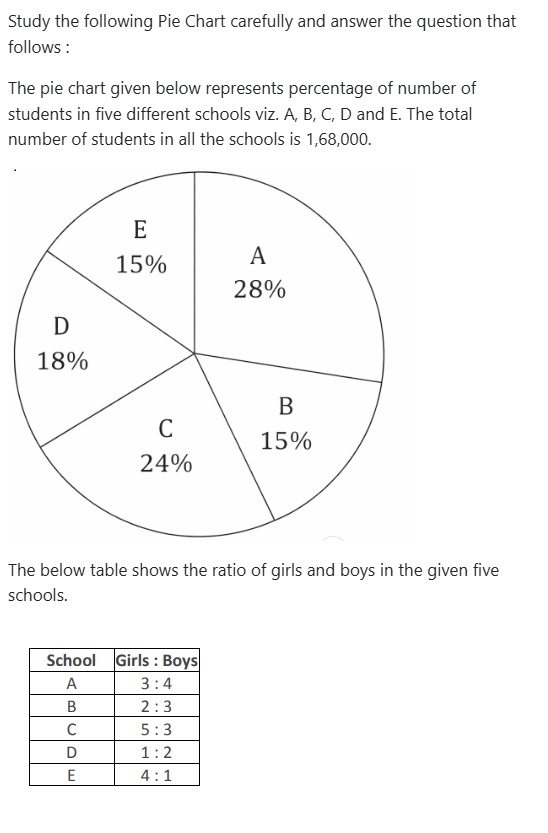
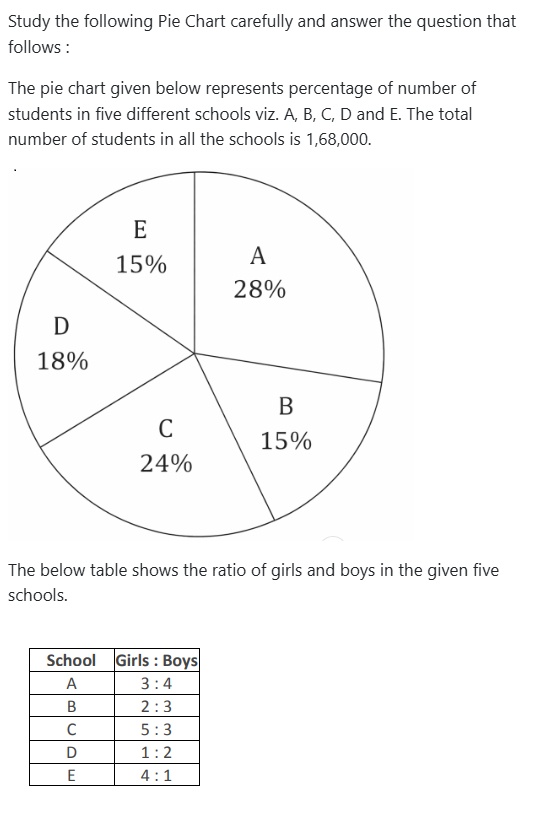
Study the following Pie Chart carefully and answer the question that follows :
The pie chart given below represents percentage of number of students in five different schools viz. A, B, C, D and E. The total number of students in all the schools is 1,68,000.
Data read from chart:
| School | Percentage of students |
|---|---|
| A | 28% |
| B | 15% |
| C | 24% |
| D | 18% |
| E | 15% |
The below table shows the ratio of girls and boys in the given five schools.
| School | Girls : Boys |
|---|---|
| A | 3 : 4 |
| B | 2 : 3 |
| C | 5 : 3 |
| D | 1 : 2 |
| E | 4 : 1 |
Find the ratio of number of girls from each school.
- 1:2:2:4:5
- 3:5:7:9:8
- 4:2:5:2:4
- 1:2:3:2:1
- 5:2:6:7:4
Show answerHide answer
Answer: C. 4:2:5:2:4
Refer to the passage above ↑
If 14.28% students of school A change their school and go to school D, what will be the percentage change in the number of students of school D.
- 11.11%
- 22.22%
- 33.33%
- 12.18%
- 14.15%
Show answerHide answer
Answer: B. 22.22%
Refer to the passage above ↑
What is the ratio of average number of students from School A and D to that of the average number of students from School B, C and E?
- 18 : 23
- 14 : 25
- 23 : 18
- 8 : 9
- 27 : 19
Show answerHide answer
Answer: C. 23 : 18
Refer to the passage above ↑
The number of students in School E is what percentage of the difference between the number of students in School C and School B?
- 156.76%
- 186.67%
- 60%
- 166.67%
- 74%
Show answerHide answer
Answer: D. 166.67%
Refer to the passage above ↑
Find the average number of boys in all the schools combined?
- 15784
- 16464
- 17840
- 16465
- 15400
Show answerHide answer
Answer: B. 16464