CET 2026 Slot 2 · MBA CET 2026 Attempt 1 Slot 2 · Quant – Page 10
All 50 Quant questions of CET 2026 Slot 2. Tap Show answer, or open the detailed solution (free login). Page 10 of 10.
Questions 146–150 share this
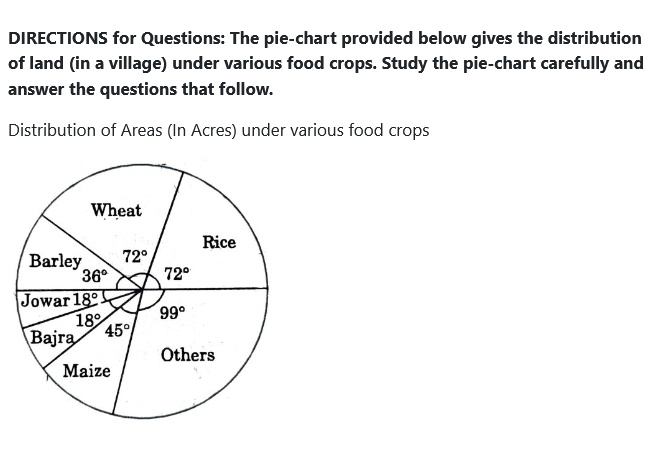
DIRECTIONS for Questions: The pie-chart provided below gives the distribution of land (in a village) under various food crops. Study the pie-chart carefully and answer the questions that follow.
Distribution of Areas (In Acres) under various food crops
Data read from chart (central angles):
| Crop | Angle |
|---|---|
| Wheat | 72° |
| Rice | 72° |
| Others | 99° |
| Maize | 45° |
| Bajra | 18° |
| Jowar | 18° |
| Barley | 36° |
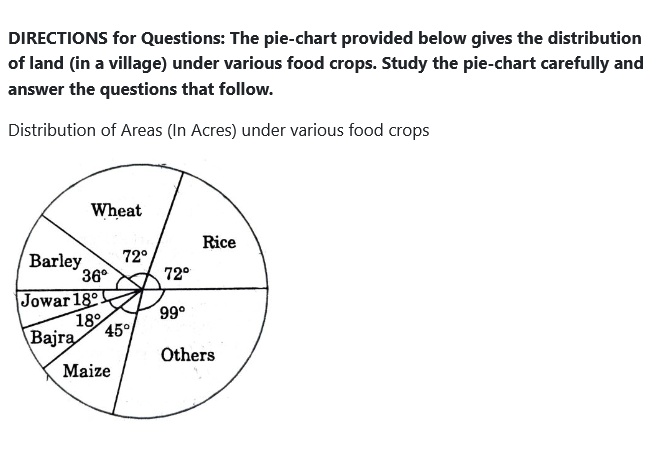
Which combination of three crops contributes to 50% of the total area under the food crops?
Answer: C. Rice, Wheat and Barley
Solution — first steps
The full step-by-step working opens with a free login.
Refer to the passage above ↑
If the total area under jowar was 1.5 million acres, then what was the area (in million acres) under rice?
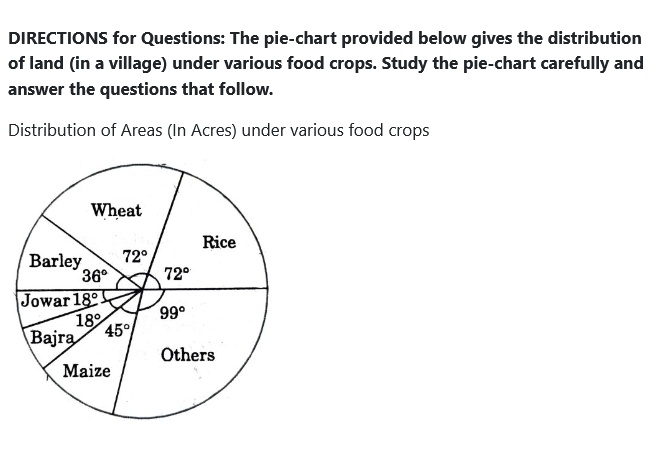
Answer: A. 6
Solution — first steps
The full step-by-step working opens with a free login.
Refer to the passage above ↑
If the production of wheat is 6 times that of barley, then what is the ratio between the yield per acre of wheat and barley?
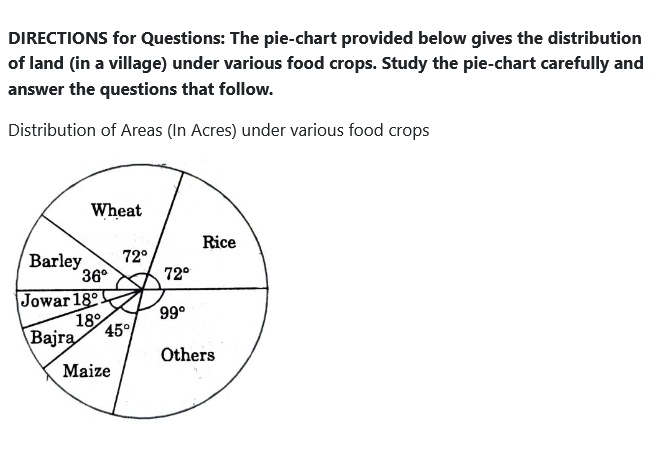
Answer: B. 3:1
Solution — first steps
The full step-by-step working opens with a free login.
Refer to the passage above ↑
If the yield per acre of rice was 50% more than that of barley, then the production of barley is what percentage of that of rice?
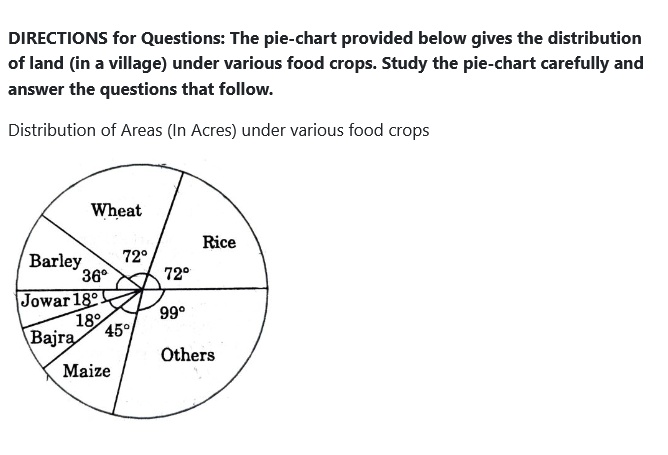
Answer: B. 33.33%
Solution — first steps
The full step-by-step working opens with a free login.
Refer to the passage above ↑
If the total area goes up by 5%, and the area under wheat production goes up by 12%, then what will be the angle for wheat in the new pie-chart?
Answer: B. 76.8°
Solution — first steps
The full step-by-step working opens with a free login.