Let’s Crack CET 2027

Your CET check-up · tap a ring to see yours

Line Graph – MBA CET questions with solutions

3 questions · CET 2025 · Easy 1 · Medium 2 · Hard 0. Newest paper first. Full papers

Q146EasyCET 2025 · Slot 3 · Q146
Passage / data for this question

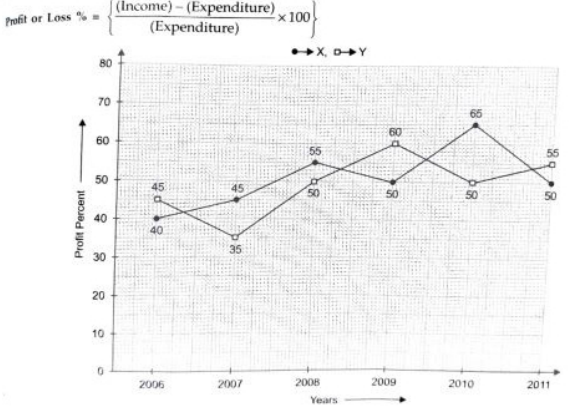
The following line graph gives the % profit earned by 2 companies X and Y during period 2006-11. Study the line graph and answer the questions that are based on it.

% profit earned by Companies X and Y Given Years

If the expenditure of company Y in 2007 was Rs. 220 cr, what was its income in that year?
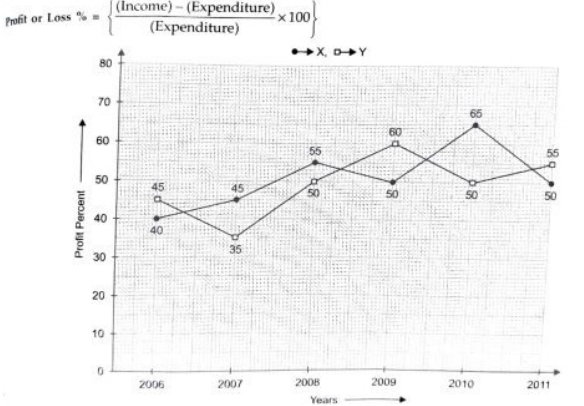
Figure for MBA CET 2025 Slot 3 question 146
  1. 312
  2. 283
  3. 297
  4. 275
  5. 261
Show answerHide answer

Answer: C

Approach: Income = E × (1 + P/100).

Solution: From the graph, Y's profit % in 2007 = 35%.
Income = 220 × 1.35 = 297 crore.

Answer: C
Q147MediumCET 2025 · Slot 3 · Q147
Passage / data for this question

The following line graph gives the % profit earned by 2 companies X and Y during period 2006-11. Study the line graph and answer the questions that are based on it.

% profit earned by Companies X and Y Given Years

If the Income of 2 companies were equal in 2009, what was the ratio of expenditure of company X to that of company Y in that year?
Figure for MBA CET 2025 Slot 3 question 147
  1. 6:5
  2. 5:6
  3. 11:6
  4. 16:15
  5. 15:16
Show answerHide answer

Answer: D

Approach: E = I ÷ (1 + P/100); incomes equal.

Solution: From the graph, 2009: X = 50%, Y = 60%.
EX = I/1.5, EY = I/1.6.
EX : EY = 1/1.5 : 1/1.6 = 1.6 : 1.5 = 16 : 15.

Why the other options are wrong: 15:16 (E) results from reading X as 60% and Y as 50%; 6:5 / 5:6 ignore the '1 +' in the income formula.

Cetking shortcut: X has the lower profit %, so X must spend more → ratio > 1 → only 6:5, 11:6, 16:15 survive; 160:150 = 16:15.

Answer: D

Q148MediumCET 2025 · Slot 3 · Q148
Passage / data for this question

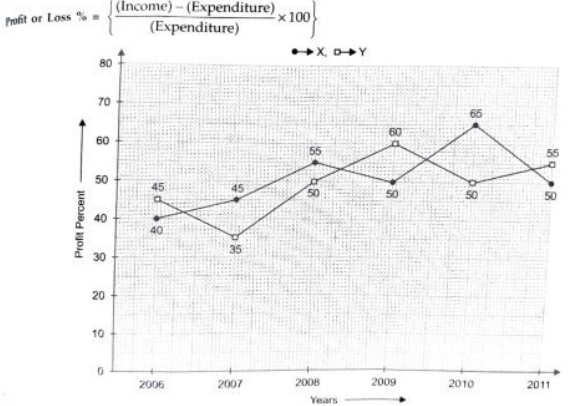
The following line graph gives the % profit earned by 2 companies X and Y during period 2006-11. Study the line graph and answer the questions that are based on it.

% profit earned by Companies X and Y Given Years

The incomes of the companies X and Y in 2010 were in ratio 3:4 respectively. What was the respective ratio of their expenditure in 2010?
Figure for MBA CET 2025 Slot 3 question 148
  1. 15:22
  2. 14:19
  3. 7:22
  4. 27:35
  5. 33:40
Show answerHide answer

Answer: A

Approach: Divide each income by (1 + profit%).

Solution: From the graph, 2010: X = 65%, Y = 50%.
EX : EY = 3/1.65 : 4/1.5 = (3 × 1.5) : (4 × 1.65) = 4.5 : 6.6 = 45 : 66 = 15 : 22.

Answer: A

Practise these in the Arena

Take timed tests built around MBA CET topics and see where you stand.

Open the Arena