CET 2026 Slot 6 · MBA CET 2026 Attempt 2 Slot 1 · Quant – Page 10
All 50 Quant questions of CET 2026 Slot 6. Tap Show answer, or open the detailed solution (free login). Page 10 of 10.
Questions 146–150 share this
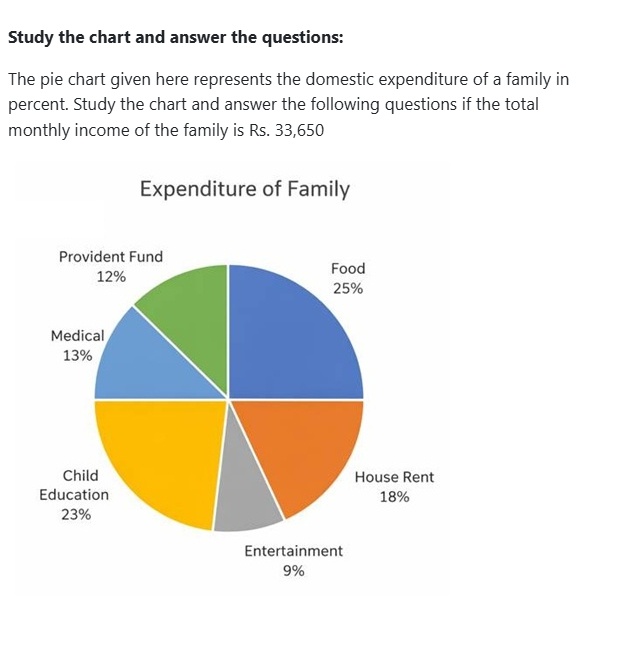
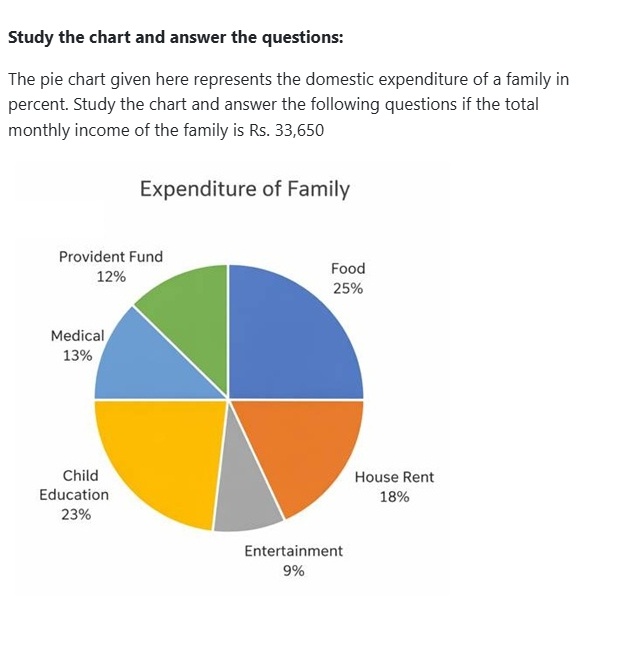
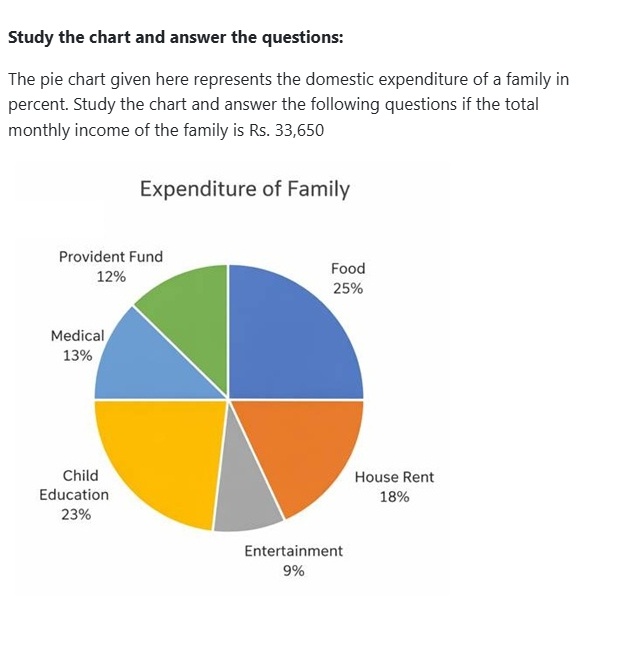
Study the chart and answer the questions:
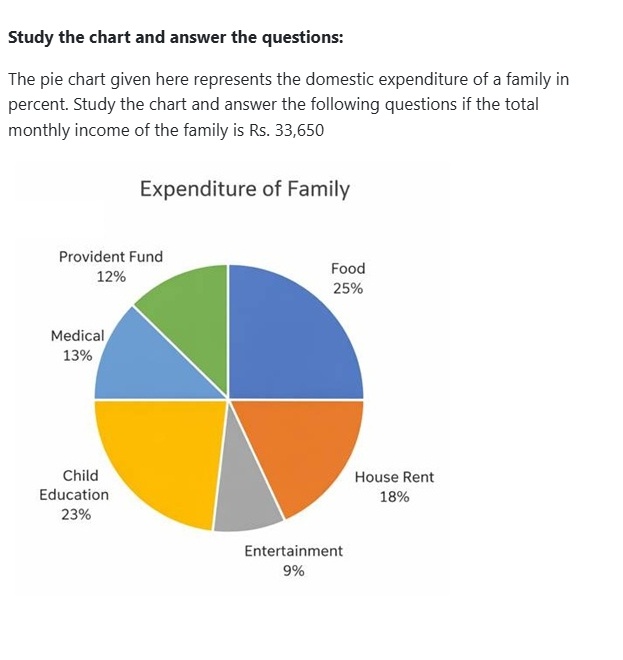
The pie chart given here represents the domestic expenditure of a family in percent. Study the chart and answer the following questions if the total monthly income of the family is Rs. 33,650
Data read from chart (Expenditure of Family):
| Item | Percent |
|---|---|
| Food | 25% |
| House Rent | 18% |
| Entertainment | 9% |
| Child Education | 23% |
| Medical | 13% |
| Provident Fund | 12% |
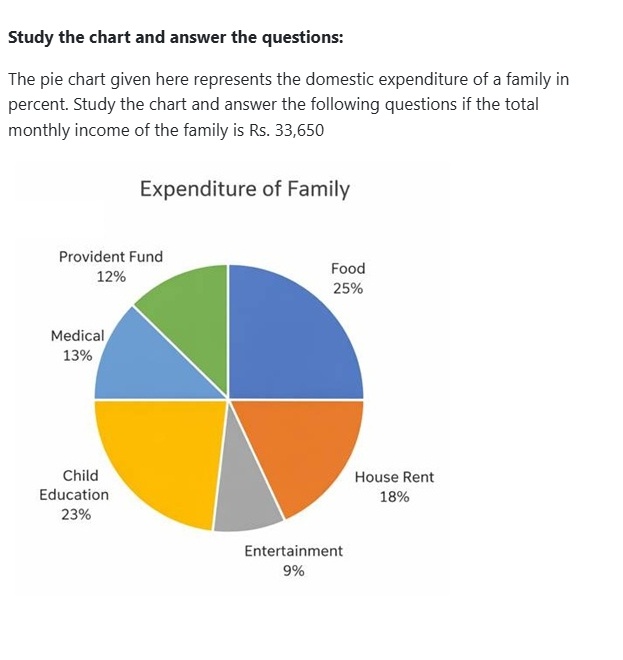
House rent per month is
Answer: C. Rs. 6057
Solution — first steps
The full step-by-step working opens with a free login.
Refer to the passage above ↑
Annual Saving in the form of provident funds
Answer: A. Rs. 48456
Solution — first steps
The full step-by-step working opens with a free login.
Refer to the passage above ↑
After provident fund deduction and payment of house rent,total monthly income of family remains:
Answer: C. Rs. 23555
Solution — first steps
The full step-by-step working opens with a free login.
Refer to the passage above ↑
Total amount per month,the family spends on food and entertainment combined together is
Answer: B. Rs. 11441
Solution — first steps
The full step-by-step working opens with a free login.
Refer to the passage above ↑
What is the difference between medical and entertainment expenses?
Answer: A. 1346
Solution — first steps
The full step-by-step working opens with a free login.