CET DI Tables Questions with Solutions – Page 10
All 53 DI Tables questions from MBA CET 2023 and 2024 and 2025 and 2026 papers. Tap Show answer, or open the detailed solution (free login). Page 10 of 12.
Number of students who appeared in the examination:
| Year | State A | State B |
|---|---:|---:|
| 2004 | 260 | 340 |
| 2005 | 320 | 480 |
| 2006 | 420 | 320 |
| 2007 | 660 | 780 |
| 2008 | 540 | 440 |
| 2009 | 440 | 760 |
| Year | State A | State B |
|---|---:|---:|
| 2004 | 260 | 340 |
| 2005 | 320 | 480 |
| 2006 | 420 | 320 |
| 2007 | 660 | 780 |
| 2008 | 540 | 440 |
| 2009 | 440 | 760 |
Find the ratio of the total students from State B in 2004, 2006 and 2008 to the total from State A in 2005, 2007 and 2009.
Answer: B. 55:71
Solution — first steps
State B total = 340 + 320 + 440 = 1,100. State A total = 320 + 660 + 440 = 1,420.
The full step-by-step working opens with a free login.
Number of students who appeared in the examination:
| Year | State A | State B |
|---|---:|---:|
| 2004 | 260 | 340 |
| 2005 | 320 | 480 |
| 2006 | 420 | 320 |
| 2007 | 660 | 780 |
| 2008 | 540 | 440 |
| 2009 | 440 | 760 |
| Year | State A | State B |
|---|---:|---:|
| 2004 | 260 | 340 |
| 2005 | 320 | 480 |
| 2006 | 420 | 320 |
| 2007 | 660 | 780 |
| 2008 | 540 | 440 |
| 2009 | 440 | 760 |
In 2010, the number of students from State A increases by 10% and that from State B increases by 15%, compared with their respective 2009 numbers. Find the ratio of State A to State B students in 2010.
Answer: E. 242:437
Solution — first steps
10 = 484. 15 = 874.
The full step-by-step working opens with a free login.
Number of students who appeared in the examination:
| Year | State A | State B |
|---|---:|---:|
| 2004 | 260 | 340 |
| 2005 | 320 | 480 |
| 2006 | 420 | 320 |
| 2007 | 660 | 780 |
| 2008 | 540 | 440 |
| 2009 | 440 | 760 |
| Year | State A | State B |
|---|---:|---:|
| 2004 | 260 | 340 |
| 2005 | 320 | 480 |
| 2006 | 420 | 320 |
| 2007 | 660 | 780 |
| 2008 | 540 | 440 |
| 2009 | 440 | 760 |
What is the absolute difference between the average annual numbers of students from State A and State B over 2004–2009?
Answer: C. 80
Solution — first steps
State A total = 2,640 and State B total = 340 + 480 + 320 + 780 + 440 + 760 = 3,120. Both cover six years.
The full step-by-step working opens with a free login.
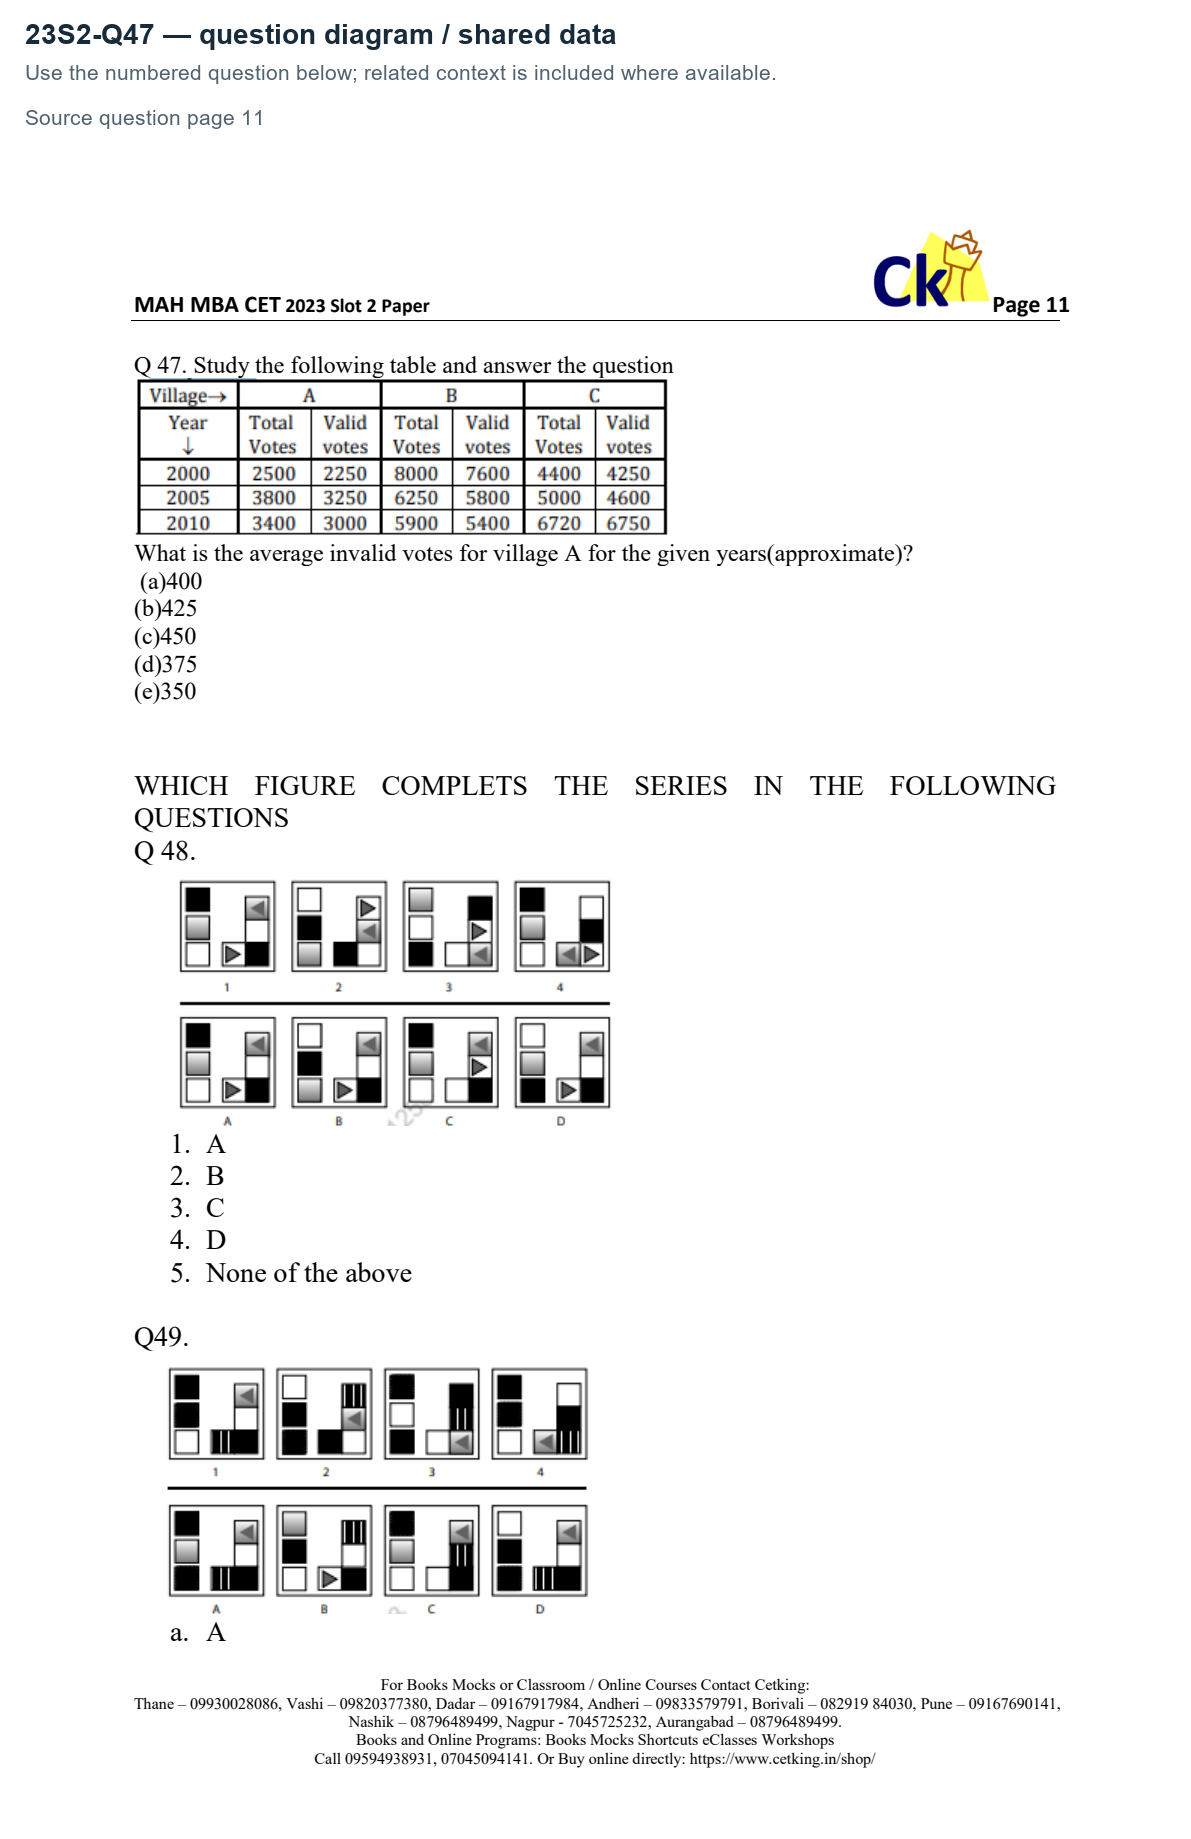
Study the following table and answer the question
What is the average invalid votes for village A for the given years(approximate)?
(a)400 Ck
(b)425
(c)450
(d)375
(e)350
WHICH FIGURE COMPLETS THE SERIES IN THE FOLLOWING
QUESTIONS
What is the average invalid votes for village A for the given years(approximate)?
(a)400 Ck
(b)425
(c)450
(d)375
(e)350
WHICH FIGURE COMPLETS THE SERIES IN THE FOLLOWING
QUESTIONS
Answer: A. 400 Ck
Solution — first steps
Invalid A votes:2500−2250=250;3800−3250=550;3400−3000=400. Average=(250+550+400)/3=400,A.
The full step-by-step working opens with a free login.
The table shows total enrolment and the boys-to-girls ratio in five schools.
| School | Total students | Boys : Girls |
|---|---:|---|
| A | 1,250 | 13 : 12 |
| B | 1,500 | 13 : 17 |
| C | 1,400 | 11 : 9 |
| D | 1,350 | 8 : 7 |
| E | 1,100 | 5 : 6 |
| School | Total students | Boys : Girls |
|---|---:|---|
| A | 1,250 | 13 : 12 |
| B | 1,500 | 13 : 17 |
| C | 1,400 | 11 : 9 |
| D | 1,350 | 8 : 7 |
| E | 1,100 | 5 : 6 |
Find the ratio of the average number of boys in schools A, C and E to the average number of girls in schools B and D.
Answer: B. 32 : 37
Solution — first steps
Boys: A = 1,250 × 13/25 = 650; C = 1,400 × 11/20 = 770; E = 1,100 × 5/11 = 500. Average = 1,920/3 = 640.
The full step-by-step working opens with a free login.