CET DI Tables Questions with Solutions – Page 9
All 53 DI Tables questions from MBA CET 2023 and 2024 and 2025 and 2026 papers. Tap Show answer, or open the detailed solution (free login). Page 9 of 12.
Five companies have the following 2015 revenues(in₹crore) and 2015–2016 growth rates: A(600,50%), B(960,25%), C(800,20%), D(1200,10%), E(900,30%). Which adds the greatest absolute revenue in 2016?
Answer: A. A
Solution — first steps
1. The revenue increases are 300,240,160,120,270 crore for A, B, C, D, E respectively.
The full step-by-step working opens with a free login.
Five companies have the following 2015 revenues(in₹crore) and 2015–2016 growth rates: A(600,50%), B(960,25%), C(800,20%), D(1200,10%), E(900,30%). What is the unweighted arithmetic mean of the five percentage growth rates?
Answer: D. 27%
Solution — first steps
1. Add the five rates:50+25+20+10+30=135.
The full step-by-step working opens with a free login.
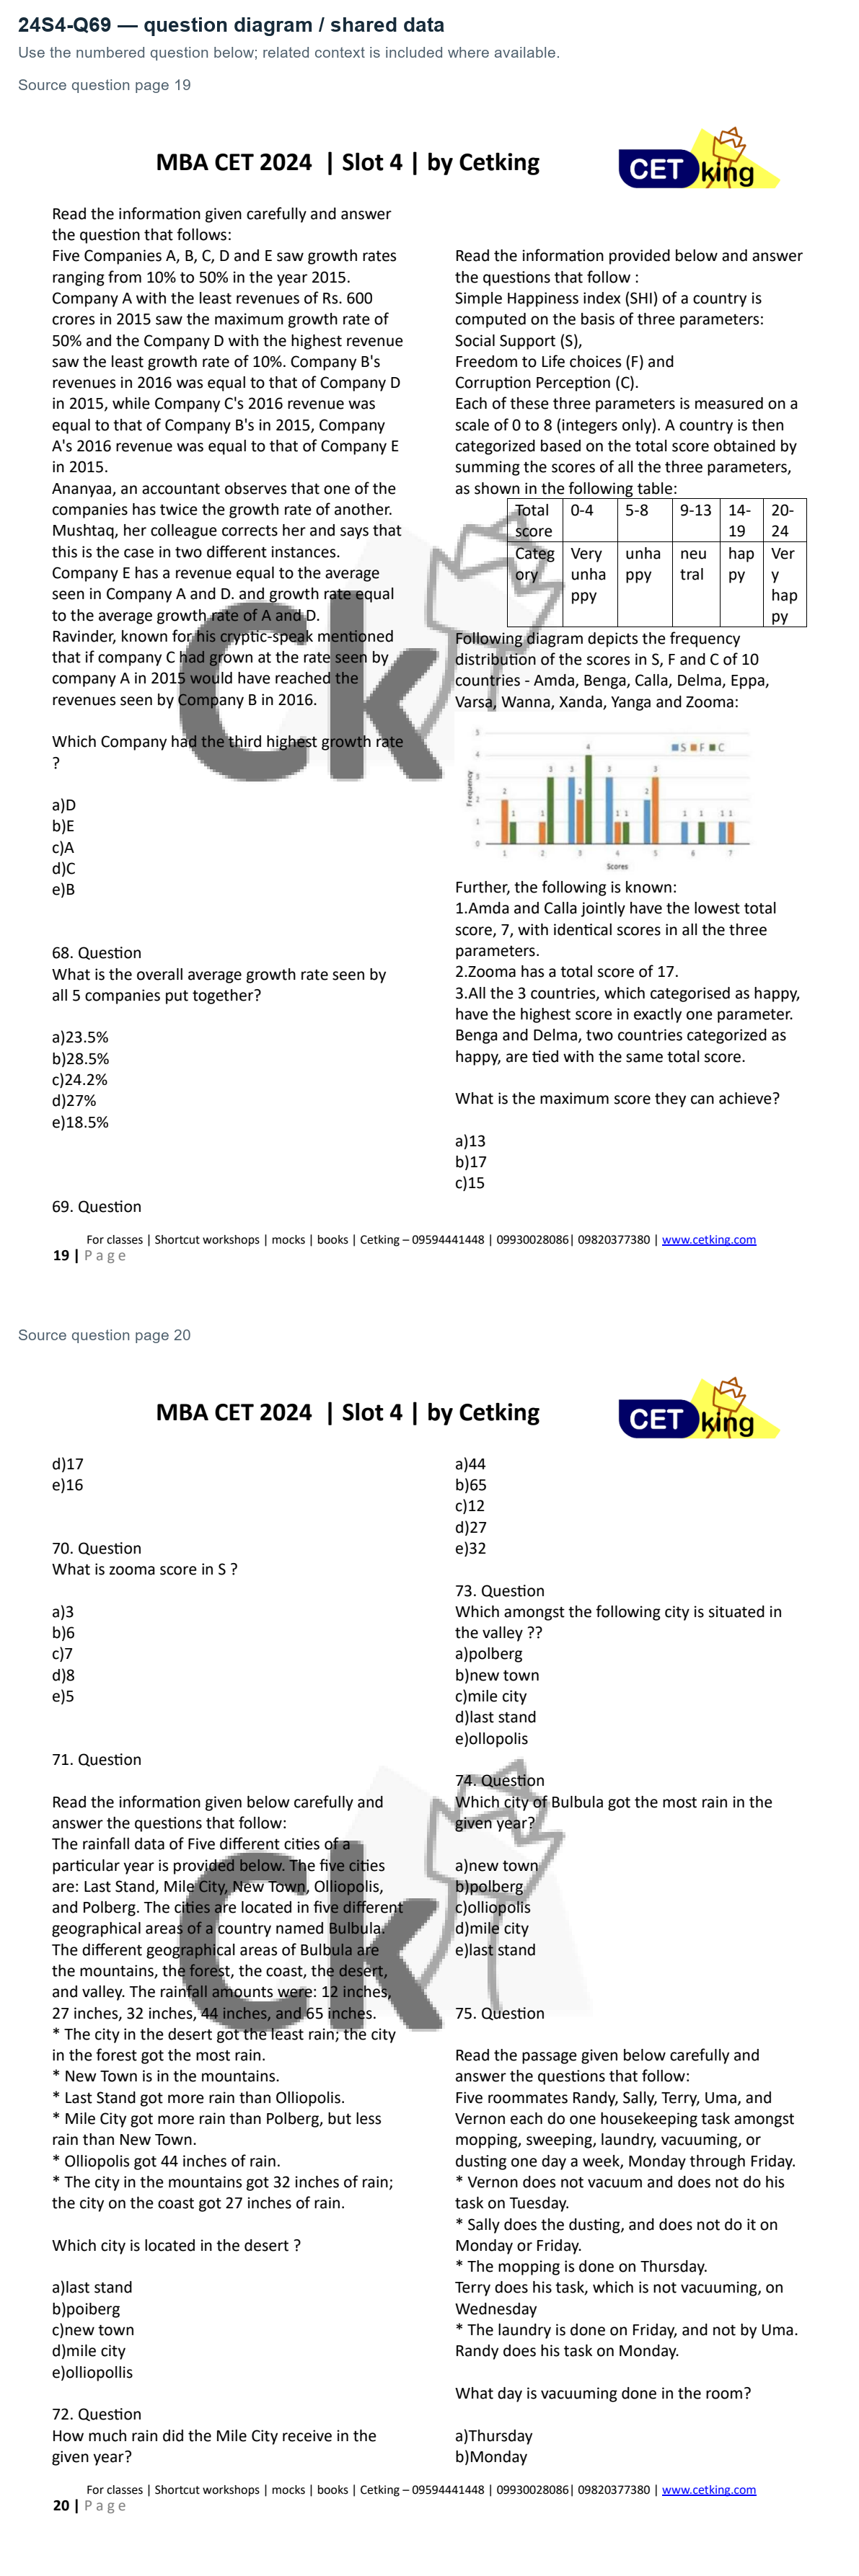
The Simple Happiness Index (SHI) is S + F + C, where S = Social Support, F = Freedom of Life Choices and C = Corruption Perception. Each score is an integer from 0 to 8.
| Total score | Category |
|---|---|
| 0–4 | Very unhappy |
| 5–8 | Unhappy |
| 9–13 | Neutral |
| 14–19 | Happy |
| 20–24 | Very happy |
The frequency table gives the number of countries with each parameter score. Scores 0 and 8 have frequency zero in all three parameters.
| Score | S frequency | F frequency | C frequency |
|---|---:|---:|---:|
| 1 | 0 | 2 | 1 |
| 2 | 0 | 1 | 3 |
| 3 | 3 | 2 | 4 |
| 4 | 3 | 1 | 1 |
| 5 | 2 | 3 | 0 |
| 6 | 1 | 0 | 1 |
| 7 | 1 | 1 | 0 |
The ten countries are Amda, Benga, Calla, Delma, Eppa, Varsa, Wanna, Xanda, Yanga and Zooma. Amda and Calla jointly have the lowest total, 7, with identical scores in all three parameters. Zooma totals 17. Exactly three countries are happy; each has the highest observed score in exactly one parameter.
| Total score | Category |
|---|---|
| 0–4 | Very unhappy |
| 5–8 | Unhappy |
| 9–13 | Neutral |
| 14–19 | Happy |
| 20–24 | Very happy |
The frequency table gives the number of countries with each parameter score. Scores 0 and 8 have frequency zero in all three parameters.
| Score | S frequency | F frequency | C frequency |
|---|---:|---:|---:|
| 1 | 0 | 2 | 1 |
| 2 | 0 | 1 | 3 |
| 3 | 3 | 2 | 4 |
| 4 | 3 | 1 | 1 |
| 5 | 2 | 3 | 0 |
| 6 | 1 | 0 | 1 |
| 7 | 1 | 1 | 0 |
The ten countries are Amda, Benga, Calla, Delma, Eppa, Varsa, Wanna, Xanda, Yanga and Zooma. Amda and Calla jointly have the lowest total, 7, with identical scores in all three parameters. Zooma totals 17. Exactly three countries are happy; each has the highest observed score in exactly one parameter.
Benga and Delma are happy countries with equal total scores. What is the maximum possible value of their common total?
Answer: C. 15
Solution — first steps
The unique highest observed scores are S = 7, F = 7 and C = 6. Each belongs to one of the three happy countries.
The full step-by-step working opens with a free login.
Number of students who appeared in the examination:
| Year | State A | State B |
|---|---:|---:|
| 2004 | 260 | 340 |
| 2005 | 320 | 480 |
| 2006 | 420 | 320 |
| 2007 | 660 | 780 |
| 2008 | 540 | 440 |
| 2009 | 440 | 760 |
| Year | State A | State B |
|---|---:|---:|
| 2004 | 260 | 340 |
| 2005 | 320 | 480 |
| 2006 | 420 | 320 |
| 2007 | 660 | 780 |
| 2008 | 540 | 440 |
| 2009 | 440 | 760 |
The number of students from State B in 2009 is approximately what percentage of the total number from State A over 2004–2009? Choose the closest value among the options.
Answer: D. 28
Solution — first steps
Total for State A = 260 + 320 + 420 + 660 + 540 + 440 = 2,640. 7878…%.
The full step-by-step working opens with a free login.
Number of students who appeared in the examination:
| Year | State A | State B |
|---|---:|---:|
| 2004 | 260 | 340 |
| 2005 | 320 | 480 |
| 2006 | 420 | 320 |
| 2007 | 660 | 780 |
| 2008 | 540 | 440 |
| 2009 | 440 | 760 |
| Year | State A | State B |
|---|---:|---:|
| 2004 | 260 | 340 |
| 2005 | 320 | 480 |
| 2006 | 420 | 320 |
| 2007 | 660 | 780 |
| 2008 | 540 | 440 |
| 2009 | 440 | 760 |
Find the absolute difference between the total students from State A in 2004 and 2005 and the total from State B in 2008 and 2009.
Answer: C. 620
Solution — first steps
State A total = 260 + 320 = 580. State B total = 440 + 760 = 1,200.
The full step-by-step working opens with a free login.