Let’s Crack CET 2027

Your CET check-up · tap a ring to see yours

Bar Graph – MBA CET questions with solutions

15 questions · CET 2026 · Easy 14 · Medium 1 · Hard 0. Newest paper first. Full papers

Q141EasyCET 2026 · Slot 4 · Q141
Passage / data for this question

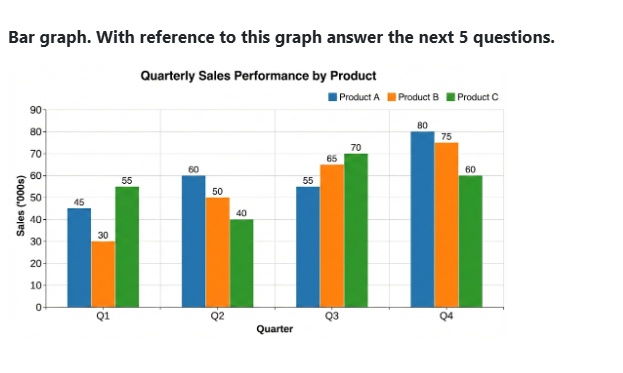
Bar graph. With reference to this graph answer the next 5 questions.

Quarterly Sales Performance by Product (Sales ('000s))

Data read from chart:

QuarterProduct AProduct BProduct C
Q1453055
Q2605040
Q3556570
Q4807560
What is the average sales of Product B across all four quarters?
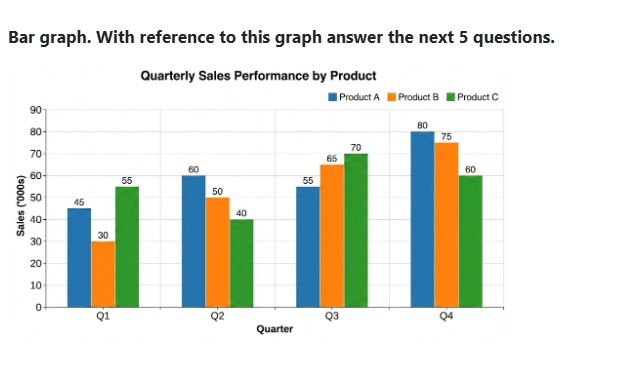
Figure for MBA CET 2026 Slot 4 question 141
  1. 50
  2. 55
  3. 60
  4. 65
  5. 52.5
Show answerHide answer

Answer: B official key

Approach: Average = sum of the four quarterly values ÷ 4.

Solution:
Product B: Q1 = 30, Q2 = 50, Q3 = 65, Q4 = 75 (in '000s).
Sum = 30 + 50 + 65 + 75 = 220.
Average = 220/4 = 55.

Why the other options are wrong:
A (50) – Q2 value only.
C (60), D (65) – read another product or a single quarter.
E (52.5) – arithmetic slip.

Cetking shortcut: Pair the ends: (30 + 75) + (50 + 65) = 105 + 115 = 220.

Answer: B
Q142EasyCET 2026 · Slot 4 · Q142
Passage / data for this question

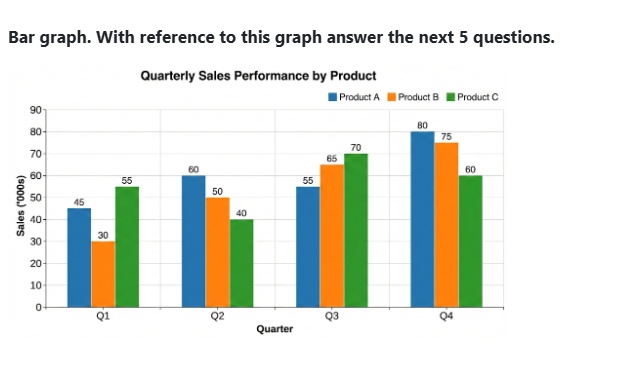
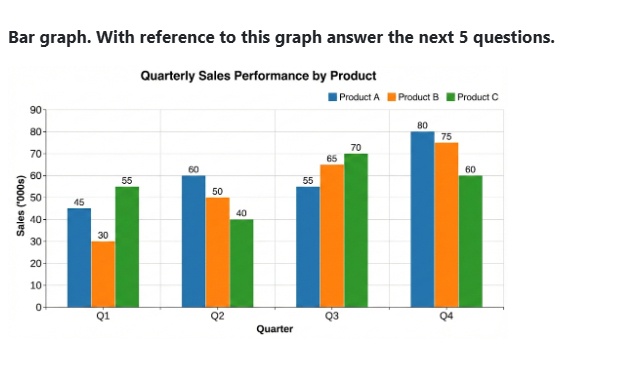
Bar graph. With reference to this graph answer the next 5 questions.

Quarterly Sales Performance by Product (Sales ('000s))

Data read from chart:

QuarterProduct AProduct BProduct C
Q1453055
Q2605040
Q3556570
Q4807560
Which quarter witnessed the highest total sales for all three products combined?
Figure for MBA CET 2026 Slot 4 question 142
  1. Q1
  2. Q2
  3. Q3
  4. Q4
  5. Q3 and Q4 have equal sales
Show answerHide answer

Answer: D official key

Approach: Add the three bars of each quarter and compare.

Solution:
Q1 = 45 + 30 + 55 = 130.
Q2 = 60 + 50 + 40 = 150.
Q3 = 55 + 65 + 70 = 190.
Q4 = 80 + 75 + 60 = 215 → highest.

Why the other options are wrong:
A, B – clearly lower totals.
C (Q3) – 190 < 215.
E – Q3 and Q4 are not equal (190 vs 215).

Cetking shortcut: Q4 has the two tallest bars (80, 75) and its third bar (60) is only 10 below Q3's 70 — Q4 wins by inspection.

Answer: D

Q143EasyCET 2026 · Slot 4 · Q143
Passage / data for this question

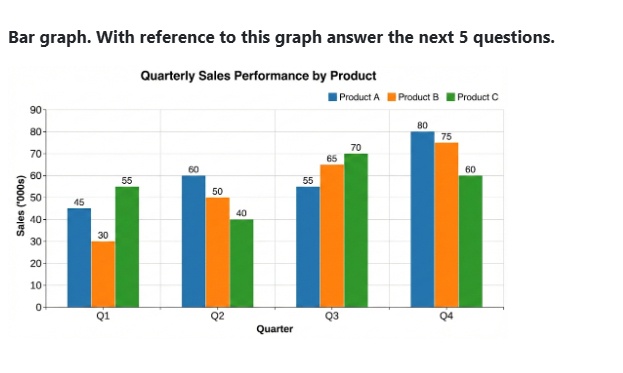
Bar graph. With reference to this graph answer the next 5 questions.

Quarterly Sales Performance by Product (Sales ('000s))

Data read from chart:

QuarterProduct AProduct BProduct C
Q1453055
Q2605040
Q3556570
Q4807560
What is the percentage increase in sales of Product A from Q1 to Q4?
Figure for MBA CET 2026 Slot 4 question 143
  1. 75%
  2. 80%
  3. 77.78%
  4. 43.75%
  5. 56.25%
Show answerHide answer

Answer: C official key

Approach: Percentage increase = (new − old)/old × 100.

Solution:
Product A: Q1 = 45, Q4 = 80.
Increase = 80 − 45 = 35.
% increase = 35/45 × 100 = 7/9 × 100 = 77.78%.

Why the other options are wrong:
D (43.75%) – divides by the new value 80 (35/80).
A (75%), B (80%) – rounding or wrong base.
E (56.25%) – wrong values.

Cetking shortcut: 35/45 = 7/9 = 77.78% (memorise ninths: 1/9 = 11.11%).

Answer: C

Q144EasyCET 2026 · Slot 4 · Q144
Passage / data for this question

Bar graph. With reference to this graph answer the next 5 questions.

Quarterly Sales Performance by Product (Sales ('000s))

Data read from chart:

QuarterProduct AProduct BProduct C
Q1453055
Q2605040
Q3556570
Q4807560
What is the ratio of the total sales of Product C to the total sales of Product A?
Figure for MBA CET 2026 Slot 4 question 144
  1. 4:11
  2. 15:16
  3. 16:15
  4. 7:11
  5. 8:15
Show answerHide answer

Answer: B official key

Approach: Find each product's annual total, then simplify the ratio.

Solution:
Product C total = 55 + 40 + 70 + 60 = 225.
Product A total = 45 + 60 + 55 + 80 = 240.
C : A = 225 : 240 = 15 : 16 (divide by 15).

Why the other options are wrong:
C (16:15) – ratio reversed (A : C).
A, D, E – not supported by the totals.

Cetking shortcut: Both totals are multiples of 15: 225 = 15 × 15, 240 = 15 × 16.

Answer: B

Q145EasyCET 2026 · Slot 4 · Q145
Passage / data for this question

Bar graph. With reference to this graph answer the next 5 questions.

Quarterly Sales Performance by Product (Sales ('000s))

Data read from chart:

QuarterProduct AProduct BProduct C
Q1453055
Q2605040
Q3556570
Q4807560
In which quarter did Product B have the lowest share of the total sales?
Figure for MBA CET 2026 Slot 4 question 145
  1. Q1
  2. Q2
  3. Q3
  4. Q4
  5. Q1 and Q2
Show answerHide answer

Answer: A official key

Approach: Share = Product B ÷ quarter total; compare fractions.

Solution:
Q1: 30/130 = 23.1%.
Q2: 50/150 = 33.3%.
Q3: 65/190 = 34.2%.
Q4: 75/215 = 34.9%.
Lowest share = Q1.

Why the other options are wrong:
B, C, D – each above 33%.
E – Q1 and Q2 shares differ (23.1% vs 33.3%).

Cetking shortcut: In Q1, B (30) is less than a quarter of 130; in every other quarter B is about one-third of the total.

Answer: A

Q146EasyCET 2026 · Slot 3 · Q146
Passage / data for this question

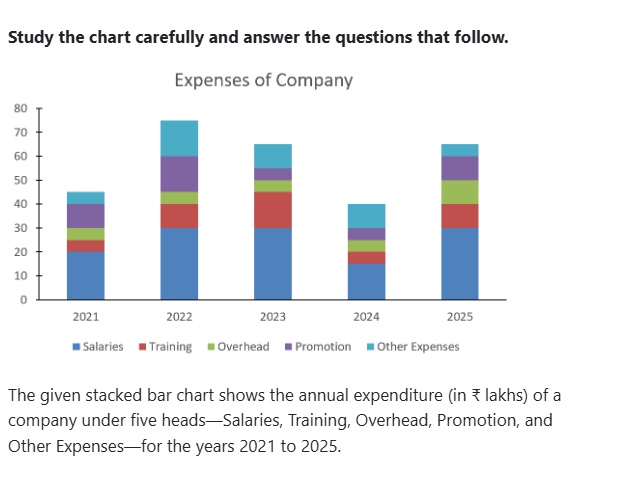
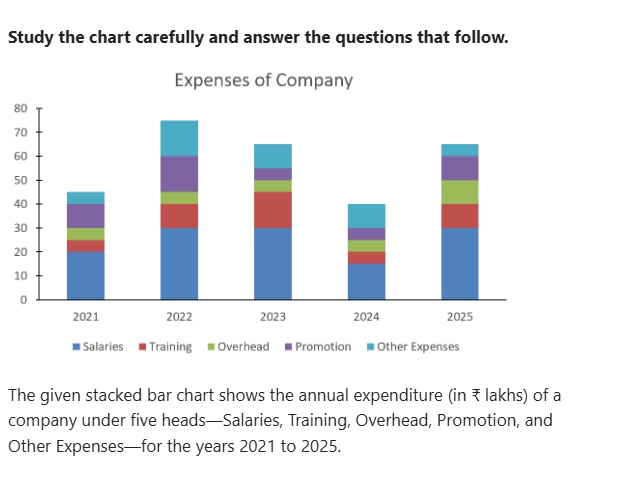
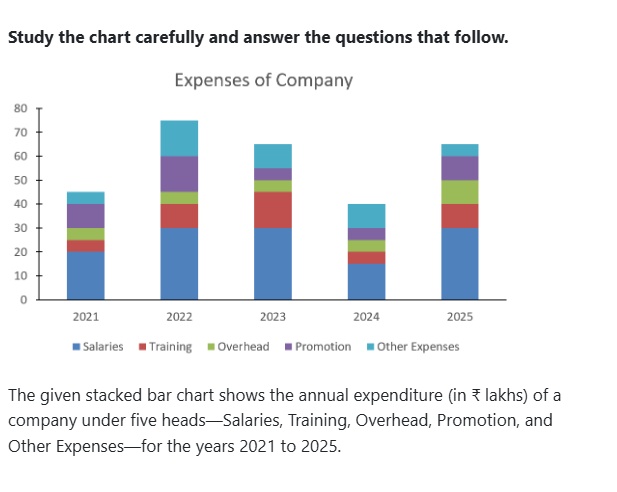
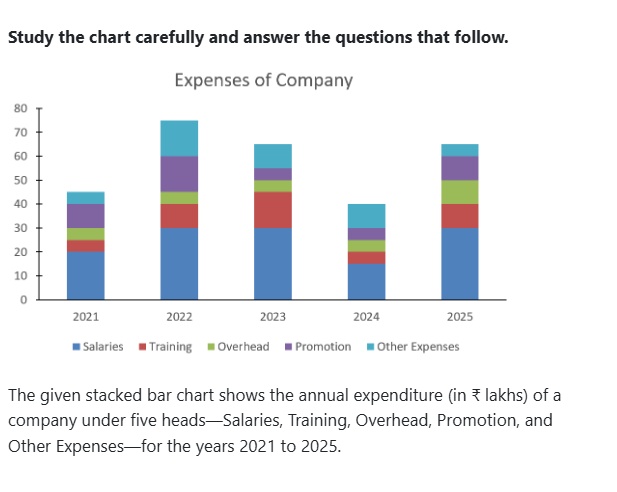
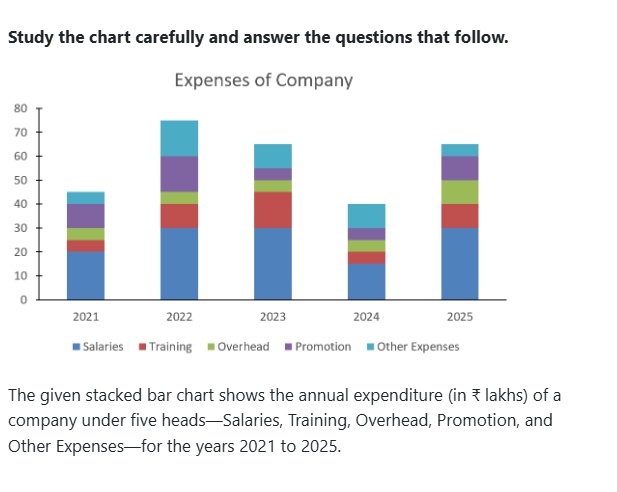
Study the chart carefully and answer the questions that follow.

Chart title: Expenses of Company (stacked bar chart; legend: Salaries, Training, Overhead, Promotion, Other Expenses; years 2021 to 2025).

The given stacked bar chart shows the annual expenditure (in ₹ lakhs) of a company under five heads—Salaries, Training, Overhead, Promotion, and Other Expenses—for the years 2021 to 2025.

Data read from chart (₹ lakhs, segment values estimated from stack boundaries):

YearSalariesTrainingOverheadPromotionOther ExpensesTotal
2021205510545
202230105151575
20233015551065
2024155551040
202530101010565
The average annual expenditure on Training from 2021 to 2025 is approximately what percentage of the average annual Salaries expenditure for the same period?
Figure for MBA CET 2026 Slot 3 question 146
  1. 36 %
  2. 32 %
  3. 46%
  4. 50%
  5. 54%
Show answerHide answer

Answer: A official key

Approach: Ratio of averages over the same period = ratio of totals.

Solution:
Training: 5 + 10 + 15 + 5 + 10 = 45 → average 9.
Salaries: 20 + 30 + 30 + 15 + 30 = 125 → average 25.
9/25 × 100 = 36%.

Cetking shortcut: Skip averages: 45/125 = 36%.

Answer: A

Q147EasyCET 2026 · Slot 3 · Q147
Passage / data for this question

Study the chart carefully and answer the questions that follow.

Chart title: Expenses of Company (stacked bar chart; legend: Salaries, Training, Overhead, Promotion, Other Expenses; years 2021 to 2025).

The given stacked bar chart shows the annual expenditure (in ₹ lakhs) of a company under five heads—Salaries, Training, Overhead, Promotion, and Other Expenses—for the years 2021 to 2025.

Data read from chart (₹ lakhs, segment values estimated from stack boundaries):

YearSalariesTrainingOverheadPromotionOther ExpensesTotal
2021205510545
202230105151575
20233015551065
2024155551040
202530101010565
The difference between Salaries and Training expenses was maximum in which year?
Figure for MBA CET 2026 Slot 3 question 147
  1. 2022 and 2025
  2. 2021 and 2024
  3. 2022 and 2024
  4. 2021 and 2023
  5. 2023 and 2025
Show answerHide answer

Answer: A official key

Approach: Read the Salaries and Training segments for each year and subtract.

Solution:
2021: 20 − 5 = 15; 2022: 30 − 10 = 20; 2023: 30 − 15 = 15; 2024: 15 − 5 = 10; 2025: 30 − 10 = 20.
Maximum difference 20 occurs in 2022 and 2025.

Why the other options are wrong:

  • B: 2021 (15), 2024 (10).
  • C: 2024 is the minimum.
  • D: 15 each.
  • E: 2023 gives only 15.

Answer: A

Q148EasyCET 2026 · Slot 3 · Q148
Passage / data for this question

Study the chart carefully and answer the questions that follow.

Chart title: Expenses of Company (stacked bar chart; legend: Salaries, Training, Overhead, Promotion, Other Expenses; years 2021 to 2025).

The given stacked bar chart shows the annual expenditure (in ₹ lakhs) of a company under five heads—Salaries, Training, Overhead, Promotion, and Other Expenses—for the years 2021 to 2025.

Data read from chart (₹ lakhs, segment values estimated from stack boundaries):

YearSalariesTrainingOverheadPromotionOther ExpensesTotal
2021205510545
202230105151575
20233015551065
2024155551040
202530101010565
Based on the given data, in which year was the total expenditure highest?
Figure for MBA CET 2026 Slot 3 question 148
  1. 2021
  2. 2022
  3. 2023
  4. 2024
  5. 2025
Show answerHide answer

Answer: B official key

Approach: Total expenditure = height of the full stacked bar.

Solution:
Totals: 2021 = 45, 2022 = 75, 2023 = 65, 2024 = 40, 2025 = 65.
Highest = 2022 (75).

Cetking shortcut: Just compare bar tops — no segment reading needed.

Answer: B

Q149EasyCET 2026 · Slot 3 · Q149
Passage / data for this question

Study the chart carefully and answer the questions that follow.

Chart title: Expenses of Company (stacked bar chart; legend: Salaries, Training, Overhead, Promotion, Other Expenses; years 2021 to 2025).

The given stacked bar chart shows the annual expenditure (in ₹ lakhs) of a company under five heads—Salaries, Training, Overhead, Promotion, and Other Expenses—for the years 2021 to 2025.

Data read from chart (₹ lakhs, segment values estimated from stack boundaries):

YearSalariesTrainingOverheadPromotionOther ExpensesTotal
2021205510545
202230105151575
20233015551065
2024155551040
202530101010565
The total expenditure on Training is equal to the total expenditure of which of the following years?
Figure for MBA CET 2026 Slot 3 question 149
  1. 2023
  2. 2024
  3. 2022
  4. 2021
  5. 2025
Show answerHide answer

Answer: D official key

Approach: Sum the Training segments and match with a year's bar total.

Solution:
Training total = 5 + 10 + 15 + 5 + 10 = 45.
Year totals: 2021 = 45, 2022 = 75, 2023 = 65, 2024 = 40, 2025 = 65.
45 matches 2021.

Answer: D

Q150MediumCET 2026 · Slot 3 · Q150
Passage / data for this question

Study the chart carefully and answer the questions that follow.

Chart title: Expenses of Company (stacked bar chart; legend: Salaries, Training, Overhead, Promotion, Other Expenses; years 2021 to 2025).

The given stacked bar chart shows the annual expenditure (in ₹ lakhs) of a company under five heads—Salaries, Training, Overhead, Promotion, and Other Expenses—for the years 2021 to 2025.

Data read from chart (₹ lakhs, segment values estimated from stack boundaries):

YearSalariesTrainingOverheadPromotionOther ExpensesTotal
2021205510545
202230105151575
20233015551065
2024155551040
202530101010565
Considering only the years in which Training expenditure exceeds Promotion expenditure by at least ₹10 lakhs, what is the total expenditure on Overhead in those years?
Figure for MBA CET 2026 Slot 3 question 150
  1. ₹20 lakhs
  2. ₹30 lakhs
  3. ₹ 5 lakhs
  4. ₹10 lakhs
  5. ₹ 25 lakhs
Show answerHide answer

Official CET key: C · Cetking's answer: B — see why below

Approach: Filter the years by the condition, then add Overhead for those years.

Solution:
Training − Promotion: 2021: 5 − 10 = −5; 2022: 10 − 15 = −5; 2023: 15 − 5 = 10; 2024: 5 − 5 = 0; 2025: 10 − 10 = 0.
Only 2023 satisfies 'at least ₹10 lakh'.
Overhead in 2023 = 50 − 45 = ₹5 lakh.

Why the other options are wrong:

  • A, B, E: add Overhead of years that fail the condition (e.g. all five years = 30).
  • D: misreads the 2023 Overhead segment as 10 (or adds 2025's 10).

Cetking shortcut: Only one bar (2023) has a tall Training and a thin Promotion segment — read just that bar.

Answer: C

Q141EasyCET 2026 · Slot 2 · Q141
Passage / data for this question

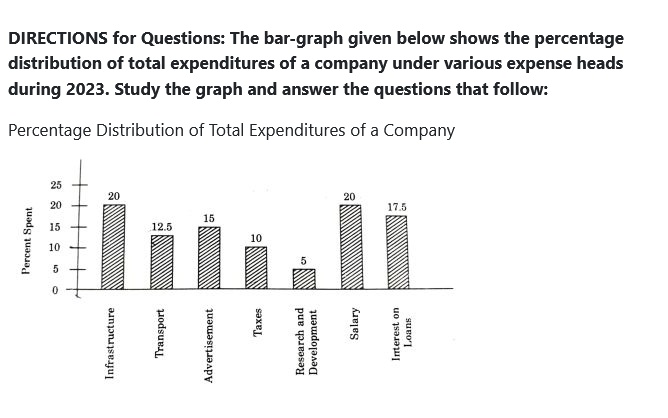
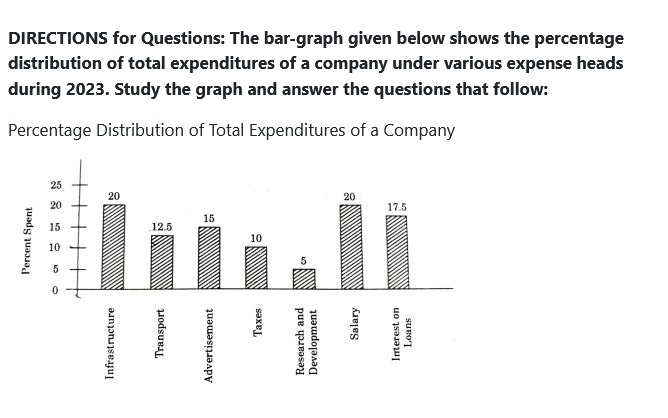
DIRECTIONS for Questions: The bar-graph given below shows the percentage distribution of total expenditures of a company under various expense heads during 2023. Study the graph and answer the questions that follow:

Percentage Distribution of Total Expenditures of a Company

Data read from chart:

Expense headPercent Spent
Infrastructure20
Transport12.5
Advertisement15
Taxes10
Research and Development5
Salary20
Interest on Loans17.5

The expenditure on the interest on loans is by what percentage more than the expenditure on transport?

Figure for MBA CET 2026 Slot 2 question 141
  1. 5%
  2. 10%
  3. 20%
  4. 30%
  5. 40%
Show answerHide answer

Answer: E official key

Approach: Percentage-more formula on the bar values.

Solution: Interest on loans = 17.5%, Transport = 12.5% of total.
Difference = 5.
% more = 5/12.5 × 100 = 40%.

Why the other options are wrong:
A (5%): the percentage-point gap, not % more.
B, C, D: wrong base or misread bars.

Answer: E

Q142EasyCET 2026 · Slot 2 · Q142
Passage / data for this question

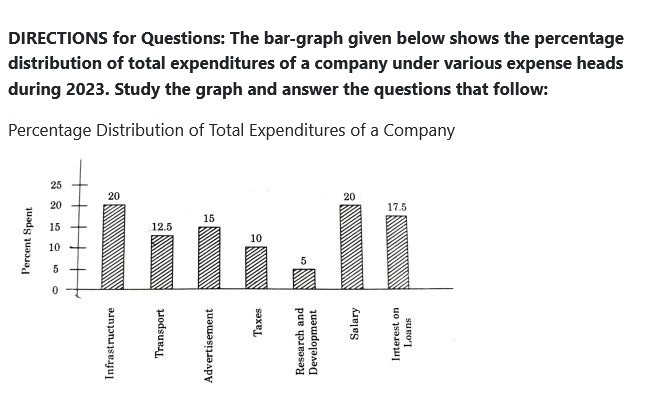
DIRECTIONS for Questions: The bar-graph given below shows the percentage distribution of total expenditures of a company under various expense heads during 2023. Study the graph and answer the questions that follow:

Percentage Distribution of Total Expenditures of a Company

Data read from chart:

Expense headPercent Spent
Infrastructure20
Transport12.5
Advertisement15
Taxes10
Research and Development5
Salary20
Interest on Loans17.5

What is the ratio of the total expenditure on infrastructure and transport to the total expenditure on taxes and interest on loans?

Figure for MBA CET 2026 Slot 2 question 142
  1. 5:4
  2. 8:7
  3. 9:7
  4. 13:11
  5. 5:9
Show answerHide answer

Answer: D official key

Approach: Add the shares, then simplify.

Solution: Infrastructure + Transport = 20 + 12.5 = 32.5.
Taxes + Interest on loans = 10 + 17.5 = 27.5.
Ratio = 32.5 : 27.5 = 65 : 55 = 13 : 11.

Why the other options are wrong:
A, B, C, E: come from misread bars (e.g. 20+15 : 10+17.5 gives 14 : 11, not offered).

Answer: D

Q143EasyCET 2026 · Slot 2 · Q143
Passage / data for this question

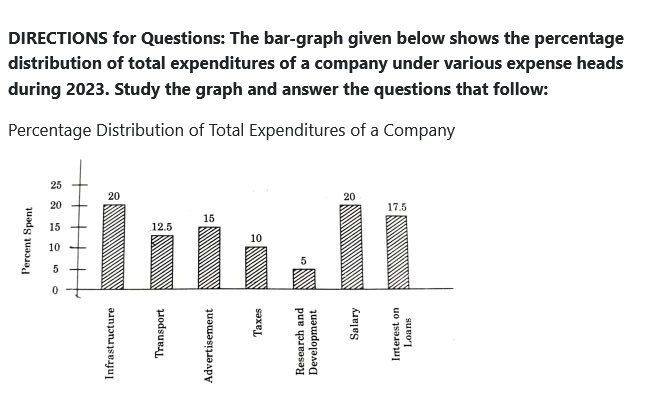
DIRECTIONS for Questions: The bar-graph given below shows the percentage distribution of total expenditures of a company under various expense heads during 2023. Study the graph and answer the questions that follow:

Percentage Distribution of Total Expenditures of a Company

Data read from chart:

Expense headPercent Spent
Infrastructure20
Transport12.5
Advertisement15
Taxes10
Research and Development5
Salary20
Interest on Loans17.5

If the expenditure on advertisements is Rs. 2.10 crores, then the difference between the expenditures on transport and taxes is:

Figure for MBA CET 2026 Slot 2 question 143
  1. Rs. 1.25 crores
  2. Rs. 95 lakhs
  3. Rs. 65 lakhs
  4. Rs. 35 lakhs
  5. Rs. 25 lakhs
Show answerHide answer

Answer: D official key

Approach: Use Advertisement as the scale.

Solution: Advertisement 15% = Rs. 2.10 crore ⇒ 1% = Rs. 0.14 crore.
Transport − Taxes = 12.5 − 10 = 2.5%.
Difference = 2.5 × 0.14 = Rs. 0.35 crore = Rs. 35 lakh.

Why the other options are wrong:
A, B, C, E: misread bars (e.g. transport as 10%) or crore–lakh unit slips.

Cetking shortcut: 2.5% is 1/6 of 15% → 2.10 crore ÷ 6 = 0.35 crore.

Answer: D

Q144EasyCET 2026 · Slot 2 · Q144
Passage / data for this question

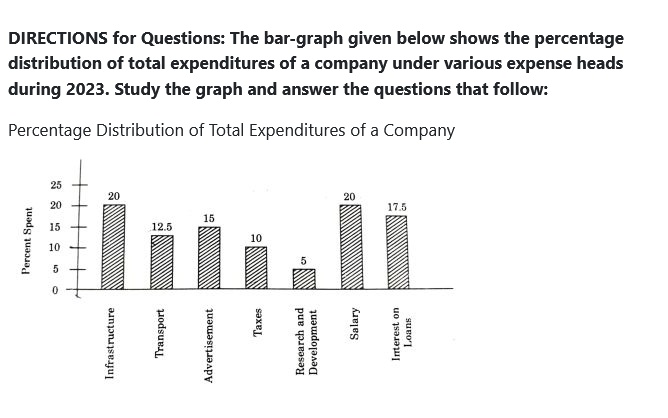
DIRECTIONS for Questions: The bar-graph given below shows the percentage distribution of total expenditures of a company under various expense heads during 2023. Study the graph and answer the questions that follow:

Percentage Distribution of Total Expenditures of a Company

Data read from chart:

Expense headPercent Spent
Infrastructure20
Transport12.5
Advertisement15
Taxes10
Research and Development5
Salary20
Interest on Loans17.5

The total amount of expenditure of the company is how many times the expenditure on research and development?

Figure for MBA CET 2026 Slot 2 question 144
  1. 27
  2. 20
  3. 18
  4. 8
  5. 5
Show answerHide answer

Answer: B official key

Approach: Share of total.

Solution: R&D = 5% of total.
Total ÷ R&D = 100 ÷ 5 = 20 times.

Why the other options are wrong:
E (5): the R&D % itself.
A, C, D: misread bars.

Answer: B

Q145EasyCET 2026 · Slot 2 · Q145
Passage / data for this question

DIRECTIONS for Questions: The bar-graph given below shows the percentage distribution of total expenditures of a company under various expense heads during 2023. Study the graph and answer the questions that follow:

Percentage Distribution of Total Expenditures of a Company

Data read from chart:

Expense headPercent Spent
Infrastructure20
Transport12.5
Advertisement15
Taxes10
Research and Development5
Salary20
Interest on Loans17.5

If the interest on loans amounted to Rs. 2.45 crores, then the total amount of expenditure on advertisements, taxes and research and development is:

Figure for MBA CET 2026 Slot 2 question 145
  1. Rs. 7 crores
  2. Rs. 5.4 crores
  3. Rs. 4.2 crores
  4. Rs. 3 crores
  5. Rs. 2.4 crores
Show answerHide answer

Answer: C official key

Approach: Use Interest on loans as the scale.

Solution: Interest on loans 17.5% = Rs. 2.45 crore ⇒ total = 2.45 ÷ 0.175 = Rs. 14 crore.
Advertisement + Taxes + R&D = 15 + 10 + 5 = 30%.
Required = 30% of 14 = Rs. 4.2 crore.

Why the other options are wrong:
A (7 crore): 50% of total.
B, D, E: wrong combined share.

Cetking shortcut: 30/17.5 × 2.45 = 2.45 × 12/7 = 0.35 × 12 = 4.2.

Answer: C

Practise these in the Arena

Take timed tests built around MBA CET topics and see where you stand.

Open the Arena