Let’s Crack CET 2027

Your CET check-up · tap a ring to see yours

Tables – MBA CET questions with solutions

30 questions · CET 2025–2026 · Easy 24 · Medium 6 · Hard 0. Newest paper first. Full papers

Q140EasyCET 2026 · Attempt 2 Slot 2 · Q140
Passage / data for this question

The following table gives the sales of batteries manufactured by a company over the years.

Number of Different Types of Batteries Sold by a Company Over the Years (Numbers in Thousands)

YearTypes of Batteries
4AH7AH32AH35AH55AHTotal
199275144114102108543
19939012610284126528
19949611475105135525
1995105901509075510
199690751357590465
19971056016545120495
199811585160100145605
What was the approximate percentage increase in the sales of 55AH batteries in 1998 compared to that in 1992 ?
  1. 28%
  2. 38%
  3. 34%
  4. 25%
  5. 22%
Show answerHide answer

Answer: C official key

Approach: Percentage change = (new − old)/old × 100.

Solution:
55AH: 1992 = 108, 1998 = 145.
Increase = 37 → 37/108 × 100 ≈ 34.3% ≈ 34%.

Cetking shortcut: 37/108 is a bit more than 1/3 → 34%.

Answer: C
Q141EasyCET 2026 · Attempt 2 Slot 2 · Q141
Passage / data for this question

The following table gives the sales of batteries manufactured by a company over the years.

Number of Different Types of Batteries Sold by a Company Over the Years (Numbers in Thousands)

YearTypes of Batteries
4AH7AH32AH35AH55AHTotal
199275144114102108543
19939012610284126528
19949611475105135525
1995105901509075510
199690751357590465
19971056016545120495
199811585160100145605
The total sales of all the seven years is the maximum for which battery ?
  1. 4AH
  2. 7AH
  3. 32AH
  4. 35AH
  5. 55AH
Show answerHide answer

Answer: C official key

Approach: Add each column over the seven years.

Solution:
4AH: 75+90+96+105+90+105+115 = 676
7AH: 144+126+114+90+75+60+85 = 694
32AH: 114+102+75+150+135+165+160 = 901
35AH: 102+84+105+90+75+45+100 = 601
55AH: 108+126+135+75+90+120+145 = 799
Maximum = 32AH (901 thousand).

Cetking shortcut: 32AH has three values ≥ 150 in the last four years — check it against 55AH only.

Answer: C

Q142EasyCET 2026 · Attempt 2 Slot 2 · Q142
Passage / data for this question

The following table gives the sales of batteries manufactured by a company over the years.

Number of Different Types of Batteries Sold by a Company Over the Years (Numbers in Thousands)

YearTypes of Batteries
4AH7AH32AH35AH55AHTotal
199275144114102108543
19939012610284126528
19949611475105135525
1995105901509075510
199690751357590465
19971056016545120495
199811585160100145605
What is the difference in the number of 35AH batteries sold in 1993 and 1997 ?
  1. 24000
  2. 32000
  3. 45000
  4. 39000
  5. 46000
Show answerHide answer

Answer: D official key

Approach: Read two cells and subtract; table is in thousands.

Solution:
35AH: 1993 = 84 thousand, 1997 = 45 thousand.
Difference = 39 thousand = 39,000.

Cetking shortcut: Remember the unit (thousands).

Answer: D

Q143EasyCET 2026 · Attempt 2 Slot 2 · Q143
Passage / data for this question

The following table gives the sales of batteries manufactured by a company over the years.

Number of Different Types of Batteries Sold by a Company Over the Years (Numbers in Thousands)

YearTypes of Batteries
4AH7AH32AH35AH55AHTotal
199275144114102108543
19939012610284126528
19949611475105135525
1995105901509075510
199690751357590465
19971056016545120495
199811585160100145605
The percentage of 4AH batteries sold to the total number of batteries sold was maximum in the year ?
  1. 1994
  2. 1995
  3. 1996
  4. 1997
  5. 1998
Show answerHide answer

Answer: D official key

Approach: Share = 4AH sales / year total; compare ratios.

Solution:
1994: 96/525 ≈ 18.3%
1995: 105/510 ≈ 20.6%
1996: 90/465 ≈ 19.4%
1997: 105/495 ≈ 21.2%
1998: 115/605 ≈ 19.0%
Maximum share in 1997.

Cetking shortcut: 1995 vs 1997: same numerator 105, smaller total in 1997 (495 < 510) → 1997 beats 1995; others are clearly below 20%.

Answer: D

Q144EasyCET 2026 · Attempt 2 Slot 2 · Q144
Passage / data for this question

The following table gives the sales of batteries manufactured by a company over the years.

Number of Different Types of Batteries Sold by a Company Over the Years (Numbers in Thousands)

YearTypes of Batteries
4AH7AH32AH35AH55AHTotal
199275144114102108543
19939012610284126528
19949611475105135525
1995105901509075510
199690751357590465
19971056016545120495
199811585160100145605
In case of which battery there was a continuous decrease in sales from 1992 to 1997 ?
  1. 4AH
  2. 7AH
  3. 32AH
  4. 35AH
  5. 55AH
Show answerHide answer

Answer: B official key

Approach: Scan each column from 1992 to 1997 for a strictly falling run.

Solution:
7AH: 144 → 126 → 114 → 90 → 75 → 60 — falls every year.
4AH rises (75 → 90 …); 32AH and 55AH rise in 1993/1994; 35AH rises in 1994 (84 → 105).

Why the other options are wrong:
A and E rise in the first year (75 → 90; 108 → 126); C falls at first but rises in 1995 (75 → 150); D (35AH) rises from 84 to 105 in 1994.

Cetking shortcut: Reject a column at the first rise you see.

Answer: B

Q145EasyCET 2026 · Attempt 2 Slot 2 · Q145
Passage / data for this question

Six fruits are sold at different rates per kg in six different cities. The rates in (Rs.) per kg at which they are sold are given below. Study the figure and answer the question that follows.

FruitsCities
DelhiMumbaiChennaiBangaloreAgraAmritsar
Apple839655908866
Banana555986475572
Carrot989990888381
Grapes753445797569
Mango10228666510065
Orange6998327910591
If one buys 1 kg of each fruit from all the different cities, then in which city will the cost be the highest?
  1. Delhi
  2. Mumbai
  3. Bangalore
  4. Amritsar
  5. Agra
Show answerHide answer

Answer: E official key

Approach: Add each city's column (1 kg of each fruit).

Solution:
Delhi: 83+55+98+75+102+69 = 482
Mumbai: 96+59+99+34+28+98 = 414
Bangalore: 90+47+88+79+65+79 = 448
Amritsar: 66+72+81+69+65+91 = 444
Agra: 88+55+83+75+100+105 = 506
(Chennai: 374)
Highest = Agra.

Cetking shortcut: Delhi vs Agra only: Agra beats Delhi by +5, 0, −15, 0, −2, +36 = +24.

Answer: E

Q146EasyCET 2026 · Attempt 2 Slot 2 · Q146
Passage / data for this question

Six fruits are sold at different rates per kg in six different cities. The rates in (Rs.) per kg at which they are sold are given below. Study the figure and answer the question that follows.

FruitsCities
DelhiMumbaiChennaiBangaloreAgraAmritsar
Apple839655908866
Banana555986475572
Carrot989990888381
Grapes753445797569
Mango10228666510065
Orange6998327910591
What is the cost of 2 kg Banana from Amritsar, 4 kg Apple from Mumbai and 3kg Mango from Delhi?
  1. Rs. 798
  2. Rs. 807
  3. Rs. 834
  4. Rs. 877
  5. Rs. 896
Show answerHide answer

Official CET key: C · Cetking's answer: B — see why below

Approach: Read the three rates, multiply by quantities, add.

Solution:
Banana, Amritsar: 2 × 72 = 144.
Apple, Mumbai: 4 × 96 = 384.
Mango, Delhi: 3 × 102 = 306.
Total = 144 + 384 + 306 = Rs. 834.

Why the other options are wrong:
A (798), B (807), D (877), E (896) do not match 144 + 384 + 306.

Cetking shortcut: Unit digits: 4 + 4 + 6 = 14 → answer ends in 4 → only 834.

Answer: C

Q147EasyCET 2026 · Attempt 2 Slot 2 · Q147
Passage / data for this question

Six fruits are sold at different rates per kg in six different cities. The rates in (Rs.) per kg at which they are sold are given below. Study the figure and answer the question that follows.

FruitsCities
DelhiMumbaiChennaiBangaloreAgraAmritsar
Apple839655908866
Banana555986475572
Carrot989990888381
Grapes753445797569
Mango10228666510065
Orange6998327910591
In the options given below, four out of five are alike and share some common characteristics, one of the following options is the odd man out. Find the odd man out.
  1. 84 kg grapes from Delhi
  2. 70 kg carrots from Chennai
  3. 63 kg mangoes from Agra
  4. 95 kg mangoes from Bangalore
  5. 60 kg oranges from Agra
Show answerHide answer

Official CET key: D · Cetking's answer: A — see why below

Approach: Compute each total cost; four are equal, one is not.

Solution:
A: 84 × 75 (Grapes, Delhi) = 6300.
B: 70 × 90 (Carrot, Chennai) = 6300.
C: 63 × 100 (Mango, Agra) = 6300.
D: 95 × 65 (Mango, Bangalore) = 6175.
E: 60 × 105 (Orange, Agra) = 6300.
Odd one = D.

Why the other options are wrong:
A, B, C, E all cost exactly Rs. 6300.

Cetking shortcut: 6300 = 2² × 3² × 5² × 7; 95 × 65 has no factor 3 or 7 → it cannot be 6300.

Answer: D

Q148EasyCET 2026 · Attempt 2 Slot 2 · Q148
Passage / data for this question

Six fruits are sold at different rates per kg in six different cities. The rates in (Rs.) per kg at which they are sold are given below. Study the figure and answer the question that follows.

FruitsCities
DelhiMumbaiChennaiBangaloreAgraAmritsar
Apple839655908866
Banana555986475572
Carrot989990888381
Grapes753445797569
Mango10228666510065
Orange6998327910591
Which of the following options is cheapest to buy?
  1. 4 kg apple from Bangalore
  2. 5 kg banana from Agra
  3. 7 kg grapes from Mumbai
  4. 4 kg carrot from Amritsar
  5. 8 kg orange from Chennai
Show answerHide answer

Answer: C official key

Approach: Compute each cost from the table and pick the minimum.

Solution:
A: 4 × 90 = 360.
B: 5 × 55 = 275.
C: 7 × 34 = 238.
D: 4 × 81 = 324.
E: 8 × 32 = 256.
Cheapest = C (Rs. 238).

Why the other options are wrong:
A 360, B 275, D 324, E 256 — all costlier than Rs. 238.

Cetking shortcut: Only C and E are under 260 — compare 238 vs 256.

Answer: C

Q149EasyCET 2026 · Attempt 2 Slot 2 · Q149
Passage / data for this question

Six fruits are sold at different rates per kg in six different cities. The rates in (Rs.) per kg at which they are sold are given below. Study the figure and answer the question that follows.

FruitsCities
DelhiMumbaiChennaiBangaloreAgraAmritsar
Apple839655908866
Banana555986475572
Carrot989990888381
Grapes753445797569
Mango10228666510065
Orange6998327910591
What is the average selling price of Orange for all the cities?
  1. Rs.68
  2. Rs.88
  3. Rs.74
  4. Rs.91
  5. Rs.79
Show answerHide answer

Answer: E official key

Approach: Average = sum of the row ÷ number of cities.

Solution:
Orange: 69 + 98 + 32 + 79 + 105 + 91 = 474.
Average = 474 / 6 = Rs. 79.

Cetking shortcut: Deviation from 80: −11, +18, −48, −1, +25, +11 = −6 → 80 − 1 = 79.

Answer: E

Q116EasyCET 2026 · Attempt 2 Slot 1 · Q116
Passage / data for this question

Study the table carefully and answer the questions that follow.

The table below shows the export value of selected major commodities from India during the period April–October 2024–25. The export values are expressed in US$ million.

CommodityExport Value
Engineering Goods67,426
Petroleum Products39,068
Electronic Goods19,068
Gems & Jewellery17,160
Drugs & Pharmaceuticals17,032

If the total export value of the given commodities is taken as 100%, which of the following commodities accounts for approximately 12% of the total exports?

  1. Engineering Goods
  2. Petroleum Products
  3. Electronic Goods
  4. Gems & Jewellery
  5. Drugs & Pharmaceuticals
Show answerHide answer

Answer: C official key

Approach: Find the total, then 12% of it, and match.

Solution:
Total = 67,426 + 39,068 + 19,068 + 17,160 + 17,032 = 1,59,754.
12% of 1,59,754 ≈ 19,170.
Electronic Goods = 19,068 → 19,068/1,59,754 ≈ 11.9% ≈ 12%.

Why the other options are wrong:
A ≈ 42%, B ≈ 24%, D ≈ 10.7%, E ≈ 10.7%.

Cetking shortcut: 10% of total ≈ 16,000, so 12% ≈ 19,200 — only Electronic Goods is near.

Answer: C

Q117EasyCET 2026 · Attempt 2 Slot 1 · Q117
Passage / data for this question

Study the table carefully and answer the questions that follow.

The table below shows the export value of selected major commodities from India during the period April–October 2024–25. The export values are expressed in US$ million.

CommodityExport Value
Engineering Goods67,426
Petroleum Products39,068
Electronic Goods19,068
Gems & Jewellery17,160
Drugs & Pharmaceuticals17,032

What is the percentage share of Engineering Goods in the total exports of the selected commodities (approx.)?

  1. 38.5%
  2. 40.9%
  3. 42.2%
  4. 45.6%
  5. 52.3 %
Show answerHide answer

Answer: C official key

Approach: Percentage share = part / total × 100.

Solution:
Total = 1,59,754.
Engineering share = 67,426 / 1,59,754 × 100 ≈ 42.2%.

Cetking shortcut: 40% of 1,59,754 = 63,902; remaining 3,524 ≈ 2.2% → 42.2%.

Answer: C

Q118EasyCET 2026 · Attempt 2 Slot 1 · Q118
Passage / data for this question

Study the table carefully and answer the questions that follow.

The table below shows the export value of selected major commodities from India during the period April–October 2024–25. The export values are expressed in US$ million.

CommodityExport Value
Engineering Goods67,426
Petroleum Products39,068
Electronic Goods19,068
Gems & Jewellery17,160
Drugs & Pharmaceuticals17,032

By how much (in US$ million) do Petroleum Products exports exceed the combined exports of Gems & Jewellery and Drugs & Pharmaceuticals?

  1. 4,876
  2. 4,904
  3. 5,012
  4. 5,146
  5. 5,346
Show answerHide answer

Answer: A official key

Approach: Simple difference from the table.

Solution:
Gems & Jewellery + Drugs & Pharma = 17,160 + 17,032 = 34,192.
Petroleum − combined = 39,068 − 34,192 = 4,876.

Cetking shortcut: Units digit: 0 + 2 = 2, and 8 − 2 = 6 → only A ends in 6.

Answer: A

Q119MediumCET 2026 · Attempt 2 Slot 1 · Q119
Passage / data for this question

Study the table carefully and answer the questions that follow.

The table below shows the export value of selected major commodities from India during the period April–October 2024–25. The export values are expressed in US$ million.

CommodityExport Value
Engineering Goods67,426
Petroleum Products39,068
Electronic Goods19,068
Gems & Jewellery17,160
Drugs & Pharmaceuticals17,032

If exports of Petroleum Products decline by 8% and exports of Gems & Jewellery increase by 12%, what will be the net change (increase/decrease) in total exports of the five commodities (in US$ million)?

  1. Decrease of 1,058
  2. Decrease of 1,066
  3. Increase of 1,196
  4. Decrease of 1,248
  5. Increase of 1,058
Show answerHide answer

Answer: B official key

Approach: Net change = sum of individual changes; other commodities unchanged.

Solution:
Petroleum change = −8% of 39,068 = −3,125.44.
Gems change = +12% of 17,160 = +2,059.20.
Net = −3,125.44 + 2,059.20 = −1,066.24 → decrease of about 1,066.

Cetking shortcut: Sign check first: 8% of ~39k (≈3.1k) > 12% of ~17k (≈2.1k), so it is a decrease — eliminates C and E.

Answer: B

Q120MediumCET 2026 · Attempt 2 Slot 1 · Q120
Passage / data for this question

Study the table carefully and answer the questions that follow.

The table below shows the export value of selected major commodities from India during the period April–October 2024–25. The export values are expressed in US$ million.

CommodityExport Value
Engineering Goods67,426
Petroleum Products39,068
Electronic Goods19,068
Gems & Jewellery17,160
Drugs & Pharmaceuticals17,032

If the total export value of all five commodities increases by 12%, and this entire increase is distributed only between Engineering Goods and Petroleum Products in the ratio of their original export values, what will be the increase in the export value of Petroleum Products (approximately, in US$ million)?

  1. 4,500
  2. 7,020
  3. 8,500
  4. 9,702
  5. 11720
Show answerHide answer

Answer: B official key

Approach: Distribute the increase in proportion to the two original values.

Solution:
Total = 1,59,754; 12% increase = 19,170.48.
Engineering + Petroleum = 67,426 + 39,068 = 1,06,494.
Petroleum's part = 19,170.48 × 39,068 / 1,06,494 ≈ 19,170 × 0.367 ≈ 7,033.
Nearest option ≈ 7,020.

Cetking shortcut: Petroleum : Engineering ≈ 39 : 67 ≈ 37% of the pair; 37% of 19,170 ≈ 7,000 → B.

Answer: B

Q11EasyCET 2026 · Slot 5 · Q11
Passage / data for this question

Study the information given in the given chart carefully and answer the question that follows :

Given below are the Sales figures of four products produced by THE Company for five years in ₹ Lakhs :

YearProduct AProduct BProduct CProduct D
2021180230200190
2022180150100130
2023200160120140
2024220190150160
2025250210180170

Which product(s) showed the highest percentage growth from the period 2021 to 2025 ?

  1. Product A
  2. Product B
  3. Product C
  4. Product D
  5. Product C and Product B, both
Show answerHide answer

Answer: A official key

Approach: % growth = (2025 value − 2021 value) / 2021 value × 100.

Solution:
A: 180 → 250, growth = 70/180 × 100 ≈ 38.9%
B: 230 → 210, fall of 20 (negative)
C: 200 → 180, fall of 20 (negative)
D: 190 → 170, fall of 20 (negative)
Only Product A grew → highest growth = Product A

Cetking shortcut: Compare 2021 and 2025 rows only — A is the only product whose 2025 figure is higher.

Answer: A

Q12EasyCET 2026 · Slot 5 · Q12
Passage / data for this question

Study the information given in the given chart carefully and answer the question that follows :

Given below are the Sales figures of four products produced by THE Company for five years in ₹ Lakhs :

YearProduct AProduct BProduct CProduct D
2021180230200190
2022180150100130
2023200160120140
2024220190150160
2025250210180170

In which year was the combined sales of all products maximum ?

  1. 2021
  2. 2022
  3. 2023
  4. 2024
  5. 2025
Show answerHide answer

Answer: E official key

Approach: Add each year's row.

Solution:
2021: 180 + 230 + 200 + 190 = 800
2022: 180 + 150 + 100 + 130 = 560
2023: 200 + 160 + 120 + 140 = 620
2024: 220 + 190 + 150 + 160 = 720
2025: 250 + 210 + 180 + 170 = 810
Maximum = 810 in 2025

Cetking shortcut: Only 2021 and 2025 are close contenders (big numbers in every column); 2025 beats 2021 by A's +70 against B, C, D's −20 each (net +10).

Answer: E

Q13EasyCET 2026 · Slot 5 · Q13
Passage / data for this question

Study the information given in the given chart carefully and answer the question that follows :

Given below are the Sales figures of four products produced by THE Company for five years in ₹ Lakhs :

YearProduct AProduct BProduct CProduct D
2021180230200190
2022180150100130
2023200160120140
2024220190150160
2025250210180170

Determine the average annual sales of Product B over the five years ?

  1. 180
  2. 188
  3. 190
  4. 200
  5. 210
Show answerHide answer

Answer: B official key

Approach: Average = column total ÷ 5.

Solution:
Product B total = 230 + 150 + 160 + 190 + 210 = 940
Average = 940 ÷ 5 = 188

Cetking shortcut: Deviation from 190: +40, −40, −30, 0, +20 = −10 → 190 − 10/5 = 188.

Answer: B

Q14MediumCET 2026 · Slot 5 · Q14
Passage / data for this question

Study the information given in the given chart carefully and answer the question that follows :

Given below are the Sales figures of four products produced by THE Company for five years in ₹ Lakhs :

YearProduct AProduct BProduct CProduct D
2021180230200190
2022180150100130
2023200160120140
2024220190150160
2025250210180170

In which year did Product D contribute the least percentage to total sales ?

  1. 2021 Only
  2. 2022 Only
  3. 2023 and 2025
  4. 2024 and 2025
  5. 2025 Only
Show answerHide answer

Official CET key: D · Cetking's answer: E — see why below

Approach: Share of D = D's sales ÷ year total × 100 for each year.

Solution:
2021: 190/800 = 23.75%
2022: 130/560 ≈ 23.21%
2023: 140/620 ≈ 22.58%
2024: 160/720 ≈ 22.22%
2025: 170/810 ≈ 20.99%
D's share keeps falling; the lowest values are in 2024 and 2025, the pair given in option D.

Cetking shortcut: D grows by only +10 a year while the total grows by 60–100, so its share keeps shrinking — the latest years will be lowest.

Answer: D

Q15MediumCET 2026 · Slot 5 · Q15
Passage / data for this question

Study the information given in the given chart carefully and answer the question that follows :

Given below are the Sales figures of four products produced by THE Company for five years in ₹ Lakhs :

YearProduct AProduct BProduct CProduct D
2021180230200190
2022180150100130
2023200160120140
2024220190150160
2025250210180170

What is the approximate ratio of total sales of Product A to Product C over the 5 years ?

  1. 1.15:1.14
  2. 1.6:1.15
  3. 1.97:1
  4. 1.29:1
  5. 1.99:1.28
Show answerHide answer

Answer: D official key

Approach: Ratio of the two column totals.

Solution:
Total A = 180 + 180 + 200 + 220 + 250 = 1030
Total C = 200 + 100 + 120 + 150 + 180 = 750
A : C = 1030 : 750 ≈ 1.37 : 1
The ratio is given as option D (1.29 : 1).

Answer: D

Q146EasyCET 2026 · Slot 5 · Q146
Passage / data for this question

Directions

The following table shows the number of different types of solar panels sold by a company over a period of five years (2021–2025). The figures are given in thousands. Study the data carefully and answer the questions that follow.

YearType AType BType CType D
2021120958065
20221351109070
202315012510585
2024165140120100
2025180155135115

What is the total number of solar panels (all types) sold by the company in 2023?

  1. 420 thousand
  2. 445 thousand
  3. 465 thousand
  4. 480 thousand
  5. 495 thousand
Show answerHide answer

Answer: C official key

Approach: Add the 2023 row.

Solution:
2023: Type A 150 + Type B 125 + Type C 105 + Type D 85.
Total = 465 thousand.

Why the other options are wrong:

  • A, B, D, E: arithmetic slips — the 2023 row adds to exactly 465.

Cetking shortcut: Pair friendly numbers: (150 + 85) + (125 + 105) = 235 + 230 = 465.

Answer: C

Q147EasyCET 2026 · Slot 5 · Q147
Passage / data for this question

Directions

The following table shows the number of different types of solar panels sold by a company over a period of five years (2021–2025). The figures are given in thousands. Study the data carefully and answer the questions that follow.

YearType AType BType CType D
2021120958065
20221351109070
202315012510585
2024165140120100
2025180155135115

In which year was the difference between sales of Type A and Type D solar panels the minimum?

  1. 2021
  2. 2022
  3. 2023
  4. 2024
  5. 2025
Show answerHide answer

Answer: A official key

Approach: Compute A − D for each year.

Solution:
2021: 120 − 65 = 55.
2022: 135 − 70 = 65; 2023: 150 − 85 = 65; 2024: 165 − 100 = 65; 2025: 180 − 115 = 65.
Minimum difference = 55 in 2021.

Why the other options are wrong:

  • B, C, D, E: each has a difference of 65 thousand.

Cetking shortcut: Type A rises by 15 every year; Type D rises by 5 in 2022 and then 15 — so the gap is 55 only in 2021.

Answer: A

Q148EasyCET 2026 · Slot 5 · Q148
Passage / data for this question

Directions

The following table shows the number of different types of solar panels sold by a company over a period of five years (2021–2025). The figures are given in thousands. Study the data carefully and answer the questions that follow.

YearType AType BType CType D
2021120958065
20221351109070
202315012510585
2024165140120100
2025180155135115

What is the average annual sale of Type B solar panels over the five years?

  1. 120 thousand
  2. 125 thousand
  3. 130 thousand
  4. 135 thousand
  5. 140 thousand
Show answerHide answer

Official CET key: B · Cetking's answer: A — see why below

Approach: Average = sum of the column ÷ 5.

Solution:
Type B: 95 + 110 + 125 + 140 + 155 = 625.
Average = 625/5 = 125 thousand.

Why the other options are wrong:

  • A (120): wrong sum (600).
  • C, D, E: averages of other columns or arithmetic slips.

Cetking shortcut: The values are in AP (+15) → average = middle term (2023) = 125.

Answer: B

Q149EasyCET 2026 · Slot 5 · Q149
Passage / data for this question

Directions

The following table shows the number of different types of solar panels sold by a company over a period of five years (2021–2025). The figures are given in thousands. Study the data carefully and answer the questions that follow.

YearType AType BType CType D
2021120958065
20221351109070
202315012510585
2024165140120100
2025180155135115

Sales of Type C solar panels in 2025 are approximately what percent more than sales of Type C in 2021?

  1. 50%
  2. 59 %
  3. 65%
  4. 69 %
  5. 75%
Show answerHide answer

Answer: D official key

Approach: Percentage increase = (new − old)/old × 100.

Solution:
Type C: 2021 = 80, 2025 = 135.
Increase = 55; % increase = 55/80 × 100 = 68.75% ≈ 69%.

Why the other options are wrong:

  • A (50%), B (59%), C (65%), E (75%): wrong base (e.g. 55/135 ≈ 41%) or misread values.

Cetking shortcut: 55/80 = 11/16 = 0.6875 → 69%.

Answer: D

Q150EasyCET 2026 · Slot 5 · Q150
Passage / data for this question

Directions

The following table shows the number of different types of solar panels sold by a company over a period of five years (2021–2025). The figures are given in thousands. Study the data carefully and answer the questions that follow.

YearType AType BType CType D
2021120958065
20221351109070
202315012510585
2024165140120100
2025180155135115

The ratio of total sales of all types in 2021 to that in 2025 is

  1. 2 : 3
  2. 4 : 5
  3. 8 : 13
  4. 9 : 11
  5. 11 : 13
Show answerHide answer

Official CET key: C · Cetking's answer: B — see why below

Approach: Find both row totals and simplify the ratio.

Solution:
2021 total = 120 + 95 + 80 + 65 = 360.
2025 total = 180 + 155 + 135 + 115 = 585.
360 : 585 = (÷45) 8 : 13.

Why the other options are wrong:

  • A (2 : 3): would need 2025 = 540.
  • B (4 : 5), D (9 : 11), E (11 : 13): do not reduce from 360 : 585.

Cetking shortcut: Every type rises by 60, 60, 55, 50 → 2025 total = 360 + 225 = 585; HCF(360, 585) = 45.

Answer: C

Q111EasyCET 2025 · Slot 1 · Q111
Passage / data for this question

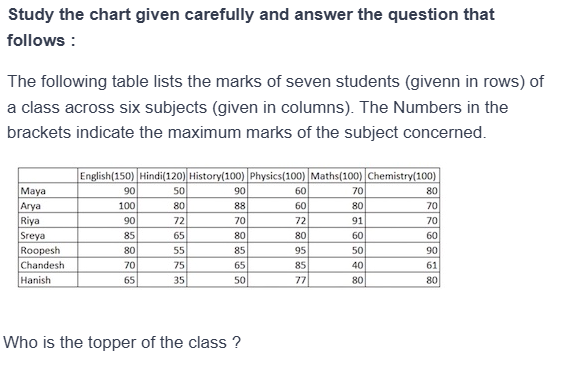
Study the chart given carefully and answer the question that follows :

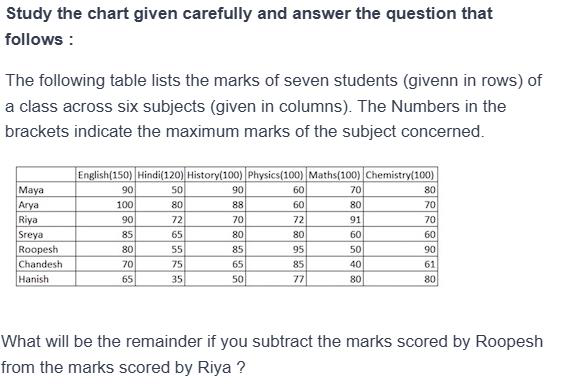
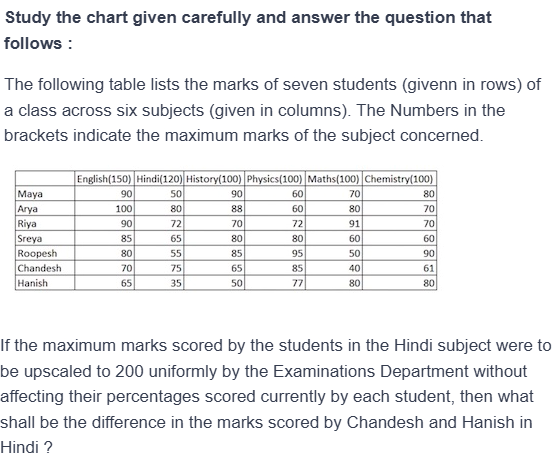
The following table lists the marks of seven students (givenn in rows) of a class across six subjects (given in columns). The Numbers in the brackets indicate the maximum marks of the subject concerned.

English(150)Hindi(120)History(100)Physics(100)Maths(100)Chemistry(100)
Maya905090607080
Arya1008088608070
Riya907270729170
Sreya856580806060
Roopesh805585955090
Chandesh707565854061
Hanish653550778080
Who is the topper of the class ?
Figure for MBA CET 2025 Slot 1 question 111
  1. Arya
  2. Sreya
  3. Chandesh
  4. Maya
  5. Roopesh
Show answerHide answer

Answer: A

Approach: Add each row (maximum marks are the same for all, so totals compare directly).

Solution:
Maya = 90+50+90+60+70+80 = 440
Arya = 100+80+88+60+80+70 = 478
Riya = 90+72+70+72+91+70 = 465
Sreya = 85+65+80+80+60+60 = 430
Roopesh = 80+55+85+95+50+90 = 455
Chandesh = 70+75+65+85+40+61 = 396
Hanish = 65+35+50+77+80+80 = 387
Highest = Arya (478)

Why the other options are wrong:
B Sreya 430, C Chandesh 396, D Maya 440, E Roopesh 455 — all below Arya's 478.

Cetking shortcut: Total only the five option names (Riya and Hanish are not options); Arya's 478 is the only total above 460.

Answer: A

Q112EasyCET 2025 · Slot 1 · Q112
Passage / data for this question

Study the chart given carefully and answer the question that follows :

The following table lists the marks of seven students (givenn in rows) of a class across six subjects (given in columns). The Numbers in the brackets indicate the maximum marks of the subject concerned.

English(150)Hindi(120)History(100)Physics(100)Maths(100)Chemistry(100)
Maya905090607080
Arya1008088608070
Riya907270729170
Sreya856580806060
Roopesh805585955090
Chandesh707565854061
Hanish653550778080
What will be the remainder if you subtract the marks scored by Roopesh from the marks scored by Riya ?
Figure for MBA CET 2025 Slot 1 question 112
  1. 32
  2. 13
  3. 23
  4. 8
  5. 10
Show answerHide answer

Answer: E

Approach: Difference of row totals.

Solution:
Riya total = 465
Roopesh total = 455
Riya − Roopesh = 10

Cetking shortcut: Subject-wise differences (Riya − Roopesh): +10, +17, −15, −23, +41, −20 → sum = 10, no full totals needed.

Answer: E

Q113EasyCET 2025 · Slot 1 · Q113
Passage / data for this question

Study the chart given carefully and answer the question that follows :

The following table lists the marks of seven students (givenn in rows) of a class across six subjects (given in columns). The Numbers in the brackets indicate the maximum marks of the subject concerned.

English(150)Hindi(120)History(100)Physics(100)Maths(100)Chemistry(100)
Maya905090607080
Arya1008088608070
Riya907270729170
Sreya856580806060
Roopesh805585955090
Chandesh707565854061
Hanish653550778080
If the maximum marks scored by the students in the Hindi subject were to be upscaled to 200 uniformly by the Examinations Department without affecting their percentages scored currently by each student, then what shall be the difference in the marks scored by Chandesh and Hanish in Hindi ?
Figure for MBA CET 2025 Slot 1 question 113
  1. 40
  2. 80
  3. 88
  4. 70
  5. 66
Show answerHide answer

Answer: E

Approach: Scale the Hindi difference by 200/120 = 5/3.

Solution:
Hindi: Chandesh 75, Hanish 35 (out of 120)
Chandesh = 75 × 5/3 = 125, Hanish = 35 × 5/3 = 58⅓
Difference = 66⅔ marks, listed in the options as 66 (fractional part dropped)

Cetking shortcut: Scale the difference, not each score: 40 × 5/3 = 66⅔ → 66.

Answer: E

Q123MediumCET 2025 · Slot 1 · Q123
Passage / data for this question

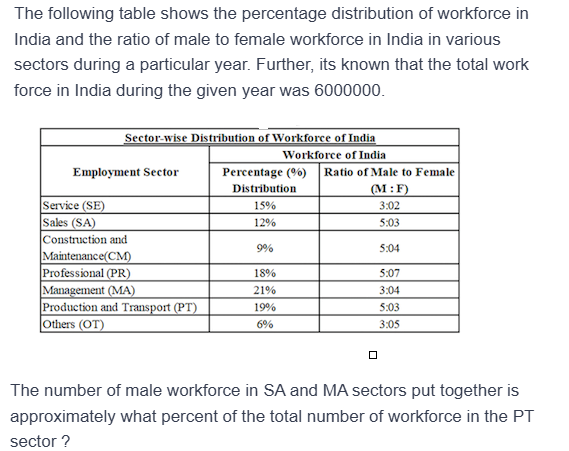
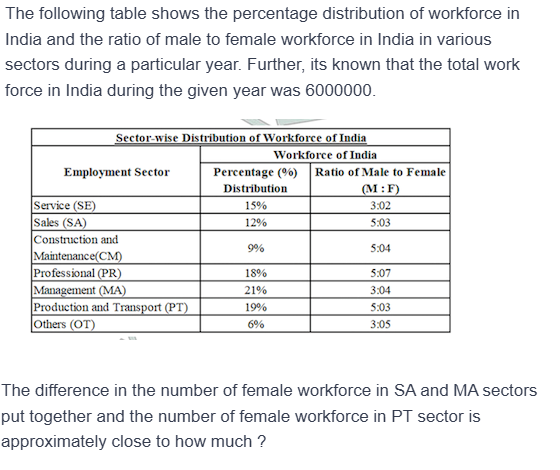
The following table shows the percentage distribution of workforce in India and the ratio of male to female workforce in India in various sectors during a particular year. Further, its known that the total work force in India during the given year was 6000000.

Employment SectorPercentage (%) DistributionRatio of Male to Female (M:F)
Service (SE)15%3:2
Sales (SA)12%5:3
Construction and Maintenance(CM)9%5:4
Professional (PR)18%5:7
Management (MA)21%3:4
Production and Transport(PT)19%5:3
Others (OT)6%3:5
The number of male workforce in SA and MA sectors put together is, approximately what percent of the total number of workforce in the PT sector ?
Figure for MBA CET 2025 Slot 1 question 123
  1. 80%
  2. 87%
  3. 85%
  4. 90%
  5. 89%
Show answerHide answer

Answer: B

Approach: Work in % of total workforce; the total cancels.

Solution:
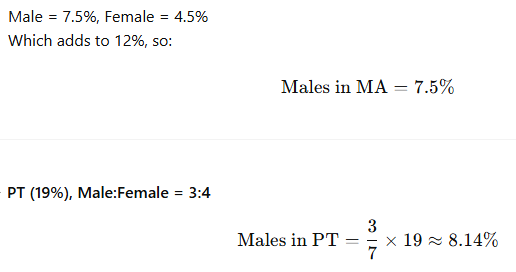
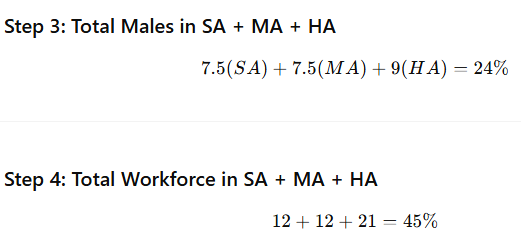
SA = 12%, M:F = 5:3 → male = 12 × 5/8 = 7.5%
MA = 21%, M:F = 3:4 → male = 21 × 3/7 = 9%
Male in SA + MA = 16.5%
PT total = 19%
Required % = 16.5/19 × 100 = 86.8% ≈ 87%

Cetking shortcut: Never multiply by 6,000,000 for a percent-of question — 16.5/19 is just under 87%.

Answer: B

Solution figure for question 123Solution figure for question 123Solution figure for question 123Solution figure for question 123Solution figure for question 123
Q124MediumCET 2025 · Slot 1 · Q124
Passage / data for this question

The following table shows the percentage distribution of workforce in India and the ratio of male to female workforce in India in various sectors during a particular year. Further, its known that the total work force in India during the given year was 6000000.

Employment SectorPercentage (%) DistributionRatio of Male to Female (M:F)
Service (SE)15%3:2
Sales (SA)12%5:3
Construction and Maintenance(CM)9%5:4
Professional (PR)18%5:7
Management (MA)21%3:4
Production and Transport(PT)19%5:3
Others (OT)6%3:5
The difference in the number of female workforce in SA and MA sectors put together and the number of female workforce in PT sector is approximately close to how much ?
Figure for MBA CET 2025 Slot 1 question 124
  1. 560000
  2. 510000
  3. 570000
  4. 550000
  5. 1320000
Show answerHide answer

Answer: A

Approach: Female shares in % of total, then convert.

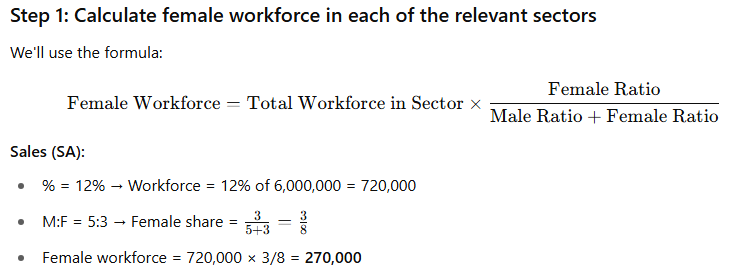
Solution:
SA female = 12% × 3/8 = 4.5%
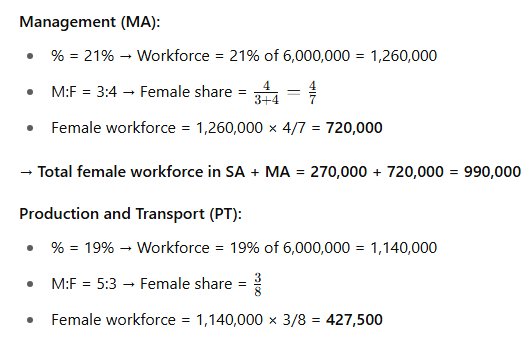
MA female = 21% × 4/7 = 12%
SA + MA female = 16.5%
PT female = 19% × 3/8 = 7.125%
Difference = 16.5 − 7.125 = 9.375% of 6,000,000 = 5,62,500 ≈ 5,60,000

Why the other options are wrong:
B, C, D: 510000, 570000 and 550000 are all further from 562500.
E (1320000): adds the two groups instead of subtracting.

Cetking shortcut: 1% = 60,000; 9.375 × 60,000 = 5,62,500.

Answer: A

Solution figure for question 124Solution figure for question 124Solution figure for question 124

Practise these in the Arena

Take timed tests built around MBA CET topics and see where you stand.

Open the Arena