CET Pie Charts Questions with Solutions
All 38 Pie Charts questions from MBA CET 2025 and 2026 papers. Tap Show answer, or open the detailed solution (free login). Page 1 of 9.
Questions 146–150 share this
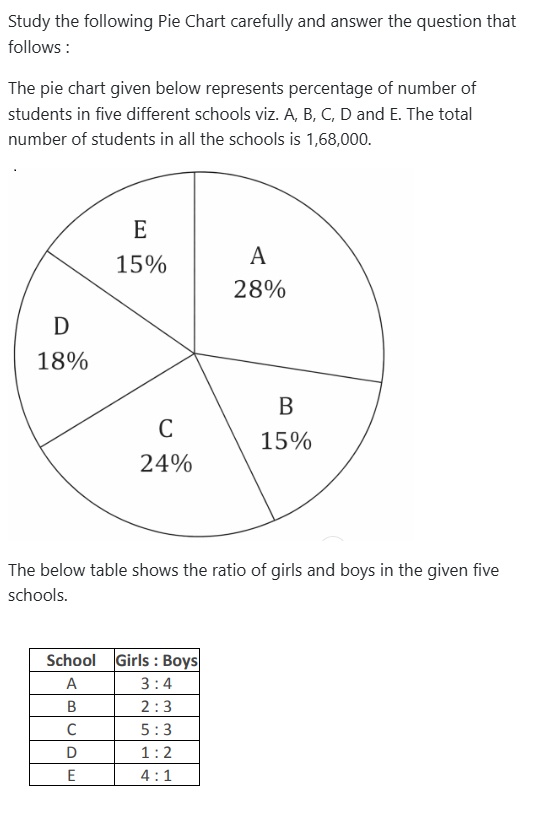
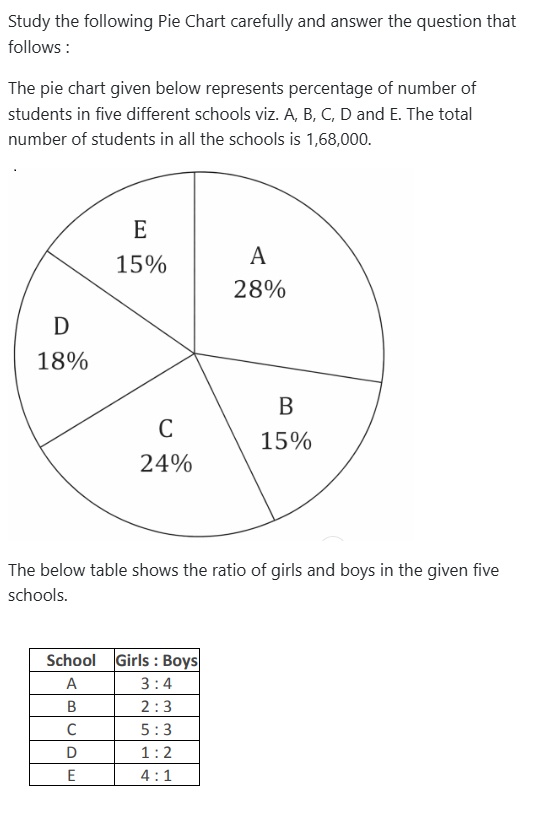
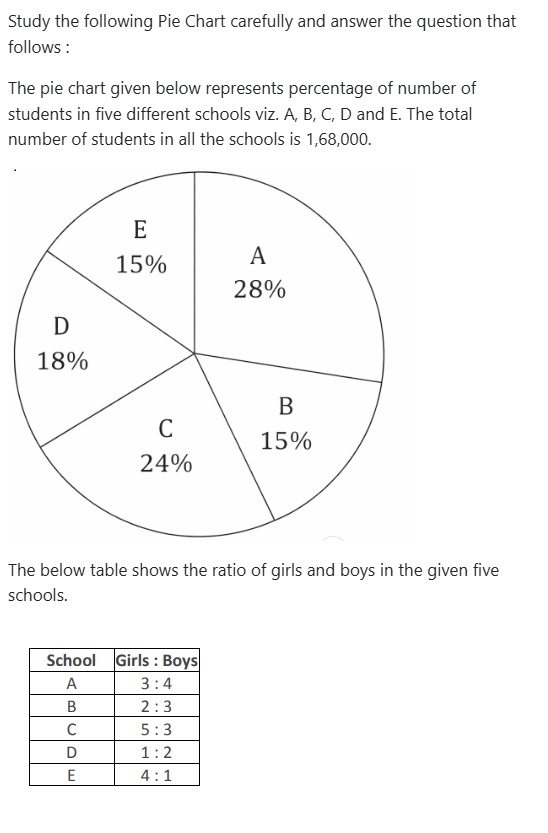
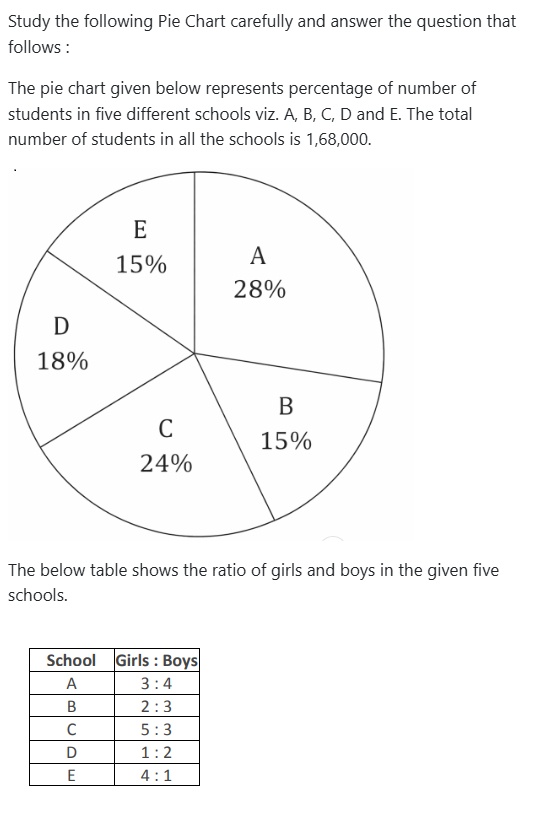
Study the following Pie Chart carefully and answer the question that follows :
The pie chart given below represents percentage of number of students in five different schools viz. A, B, C, D and E. The total number of students in all the schools is 1,68,000.
Data read from chart:
| School | Percentage of students |
|---|---|
| A | 28% |
| B | 15% |
| C | 24% |
| D | 18% |
| E | 15% |
The below table shows the ratio of girls and boys in the given five schools.
| School | Girls : Boys |
|---|---|
| A | 3 : 4 |
| B | 2 : 3 |
| C | 5 : 3 |
| D | 1 : 2 |
| E | 4 : 1 |
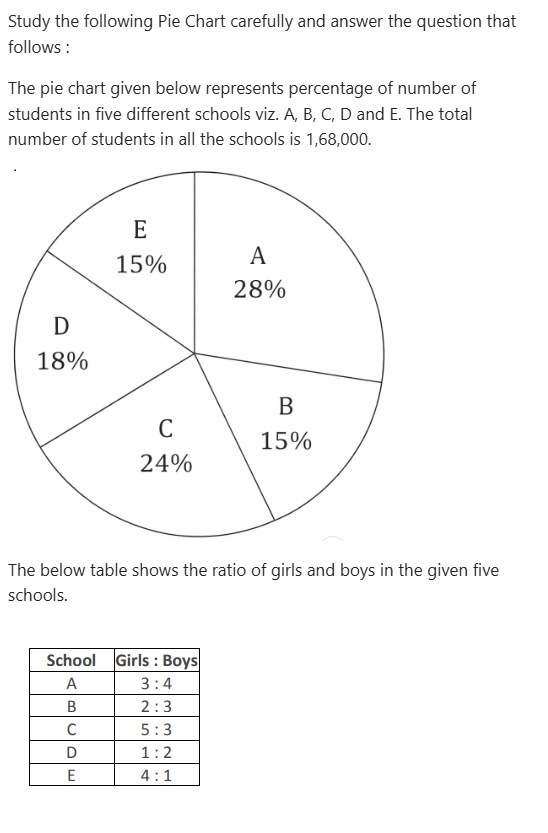
Find the ratio of number of girls from each school.
- 1:2:2:4:5
- 3:5:7:9:8
- 4:2:5:2:4
- 1:2:3:2:1
- 5:2:6:7:4
Show answerHide answer
Answer: C. 4:2:5:2:4
Refer to the passage above ↑
If 14.28% students of school A change their school and go to school D, what will be the percentage change in the number of students of school D.
- 11.11%
- 22.22%
- 33.33%
- 12.18%
- 14.15%
Show answerHide answer
Answer: B. 22.22%
Refer to the passage above ↑
What is the ratio of average number of students from School A and D to that of the average number of students from School B, C and E?
- 18 : 23
- 14 : 25
- 23 : 18
- 8 : 9
- 27 : 19
Show answerHide answer
Answer: C. 23 : 18
Refer to the passage above ↑
The number of students in School E is what percentage of the difference between the number of students in School C and School B?
- 156.76%
- 186.67%
- 60%
- 166.67%
- 74%
Show answerHide answer
Answer: D. 166.67%
Refer to the passage above ↑
Find the average number of boys in all the schools combined?
- 15784
- 16464
- 17840
- 16465
- 15400
Show answerHide answer
Answer: B. 16464