CET Pie Charts Questions with Solutions – Page 5
All 38 Pie Charts questions from MBA CET 2025 and 2026 papers. Tap Show answer, or open the detailed solution (free login). Page 5 of 9.
Questions 141–145 share this
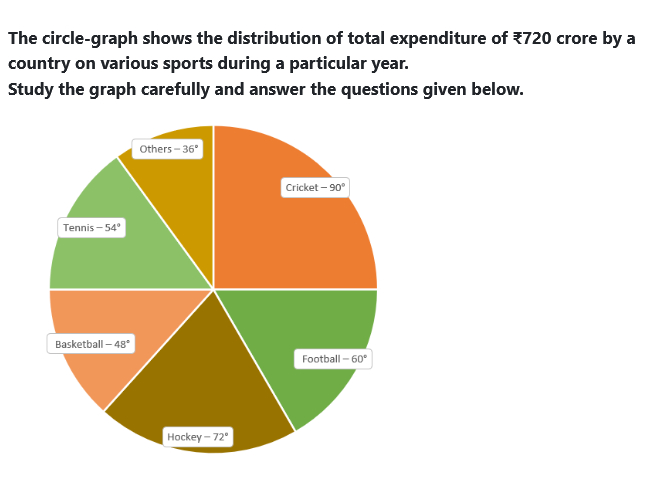
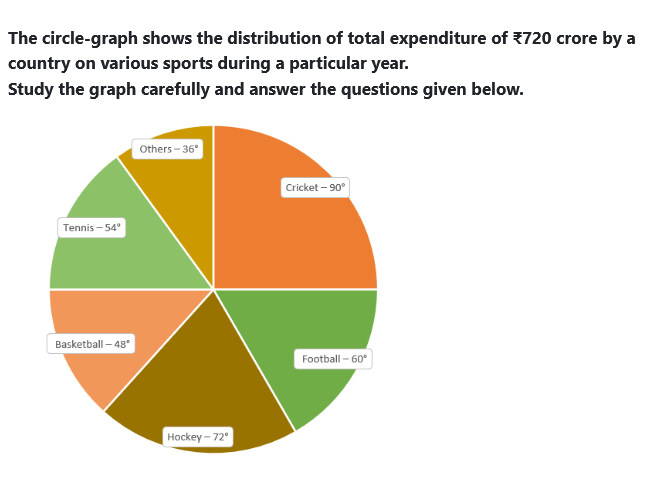
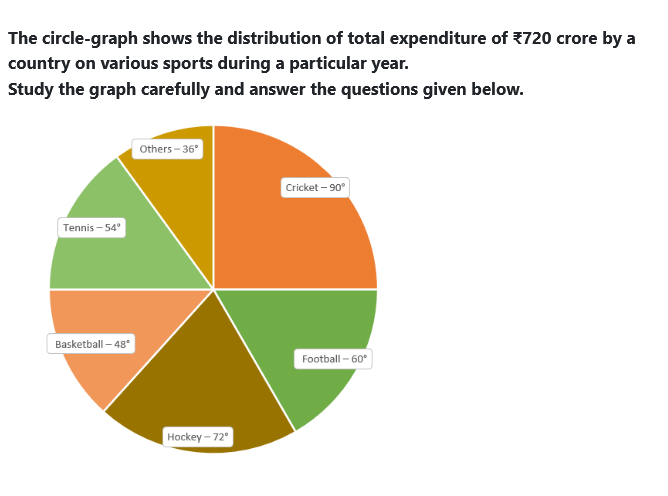
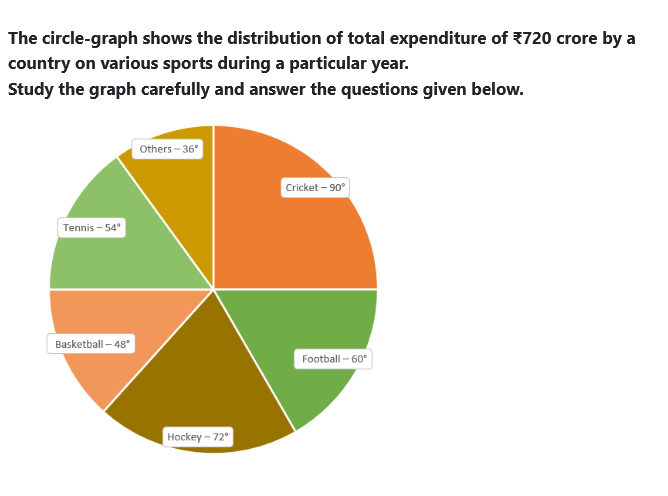
The circle-graph shows the distribution of total expenditure of ₹720 crore by a country on various sports during a particular year.
Study the graph carefully and answer the questions given below.
Data read from chart:
| Sport | Central angle |
|---|---|
| Cricket | 90° |
| Football | 60° |
| Hockey | 72° |
| Basketball | 48° |
| Tennis | 54° |
| Others | 36° |
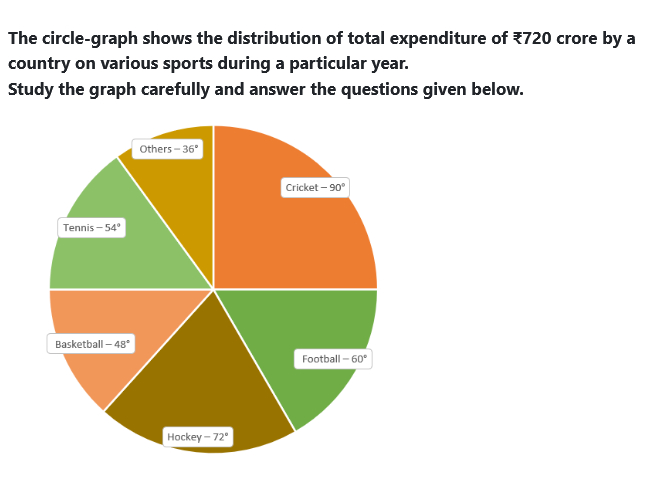
What is the expenditure on Cricket?
Answer: C. ₹180 crore
Solution — first steps
The full step-by-step working opens with a free login.
Refer to the passage above ↑
What is the difference between the average expenditure on Cricket and Football and the expenditure on Hockey?
Answer: C. ₹6 crore
Solution — first steps
The full step-by-step working opens with a free login.
Refer to the passage above ↑
If ₹36 crore is transferred from Cricket to Basketball, what will be the new ratio of expenditure on Cricket to Basketball?
Answer: C. 12:11
Solution — first steps
The full step-by-step working opens with a free login.
Refer to the passage above ↑
Expenditure on Tennis is what percent less than the combined expenditure on Hockey and Others?
Answer: D. 50 %
Solution — first steps
The full step-by-step working opens with a free login.
Refer to the passage above ↑
The expenditure on Cricket is equal to the expenditure on which of the following combinations?
Answer: C. Tennis + Others
Solution — first steps
The full step-by-step working opens with a free login.