CET Pie Charts Questions with Solutions – Page 8
All 38 Pie Charts questions from MBA CET 2025 and 2026 papers. Tap Show answer, or open the detailed solution (free login). Page 8 of 9.
Questions 144–146 share this
Read the information provided and answer the question that follows :
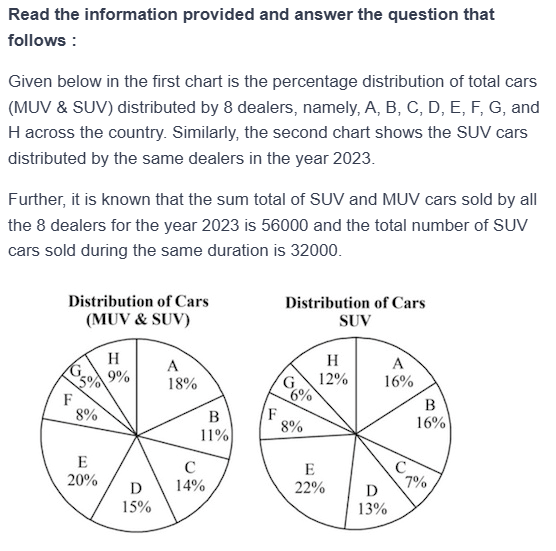
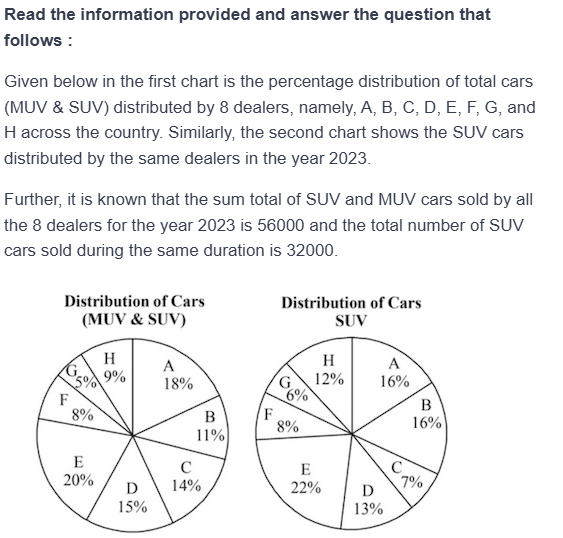
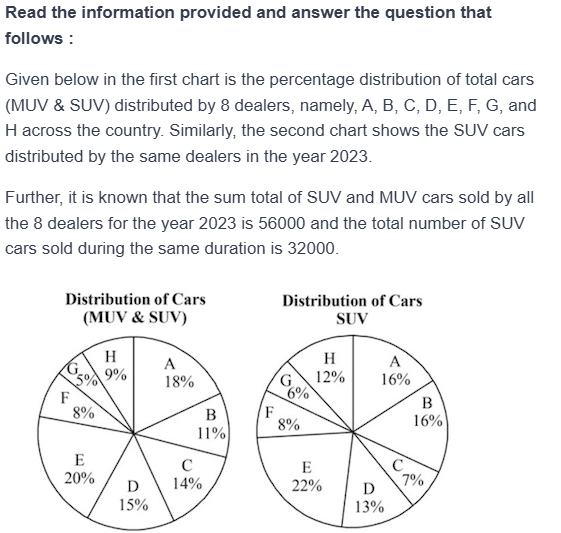
Given below in the first chart is the percentage distribution of total cars (MUV & SUV) distributed by 8 dealers, namely, A, B, C, D, E, F, G, and H across the country. Similarly, the second chart shows the SUV cars distributed by the same dealers in the year 2023.
Further, it is known that the sum total of SUV and MUV cars sold by all the 8 dealers for the year 2023 is 56000 and the total number of SUV cars sold during the same duration is 32000.
Distribution of Cars (MUV & SUV): A 18%, B 11%, C 14%, D 15%, E 20%, F 8%, G 5%, H 9%.
Distribution of Cars SUV: A 16%, B 16%, C 7%, D 13%, E 22%, F 8%, G 6%, H 12%.

- 75%
- 50%
- 63%
- 33%
- 25%
Show answerHide answer
Answer: E. 25%
Refer to the passage above ↑

- 54:77
- 64:73
- 64:77
- 1:4.33
- 64:79
Show answerHide answer
Answer: C. 64:77
Refer to the passage above ↑

- 2892
- 3634
- 3326
- 3296
- 3354
Show answerHide answer
Answer: D. 3296