CET Pie Charts Questions with Solutions – Page 7
All 38 Pie Charts questions from MBA CET 2025 and 2026 papers. Tap Show answer, or open the detailed solution (free login). Page 7 of 9.
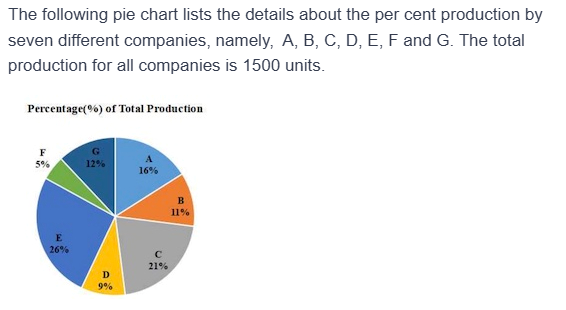
The following pie chart lists the details about the per cent production by seven different companies, namely, A, B, C, D, E, F and G. The total production for all companies is 1500 units.
Percentage(%) of Total Production: A 16%, B 11%, C 21%, D 9%, E 26%, F 5%, G 12%.
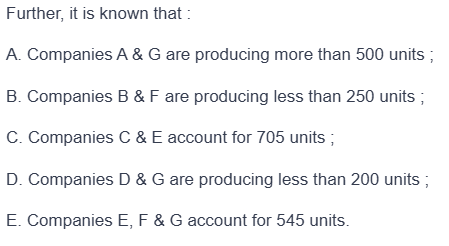
Further, it is known that
A. Companies A & G are producing more than 500 units ;
B. Companies B & F are producing less than 250 units ;
C. Companies C & E account for 705 units ;
D. Companies D & G are producing less than 200 units ;
E. Companies E, F & G account for 545 units.
Choose which of the following is correct
- Only A,D and E are true
- Only A and E are true
- Only C and E are true
- Only B and C are true
- Only A and D are true
Show answerHide answer
Answer: D. Only B and C are true