CET Pie Charts Questions with Solutions – Page 6
All 38 Pie Charts questions from MBA CET 2025 and 2026 papers. Tap Show answer, or open the detailed solution (free login). Page 6 of 9.
Questions 146–150 share this
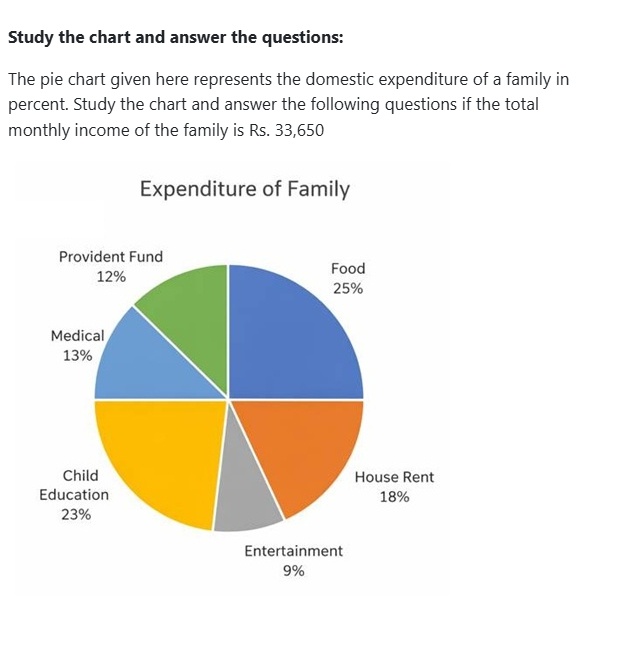
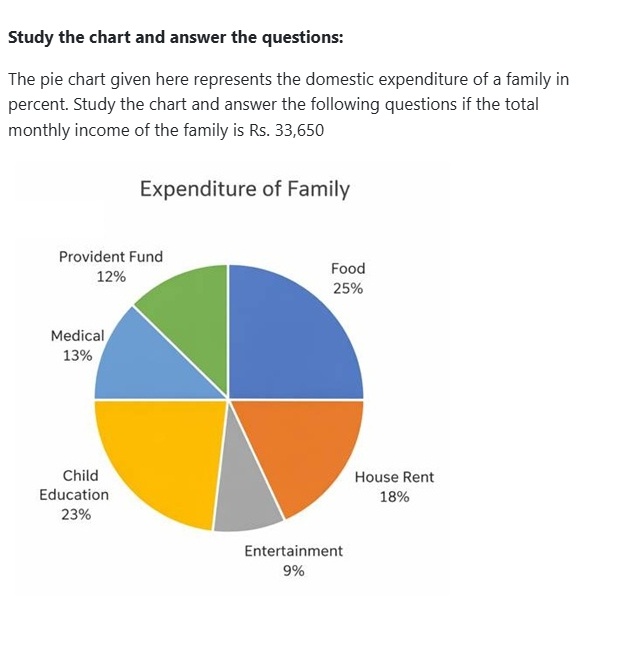
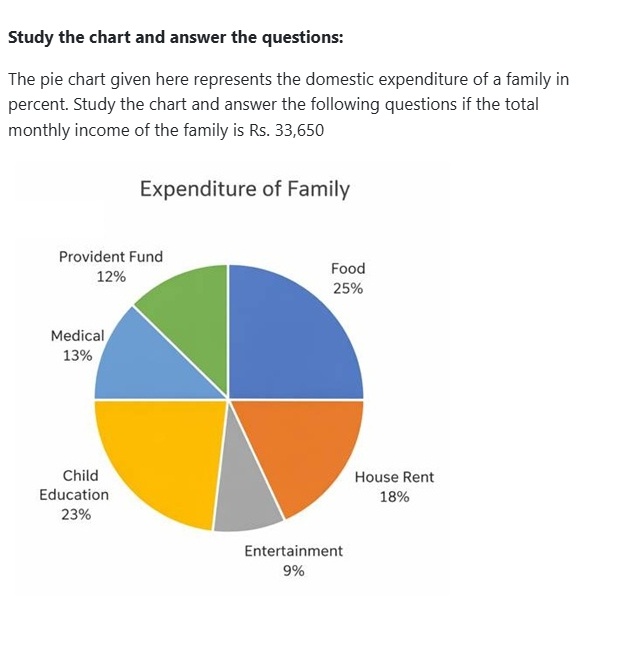
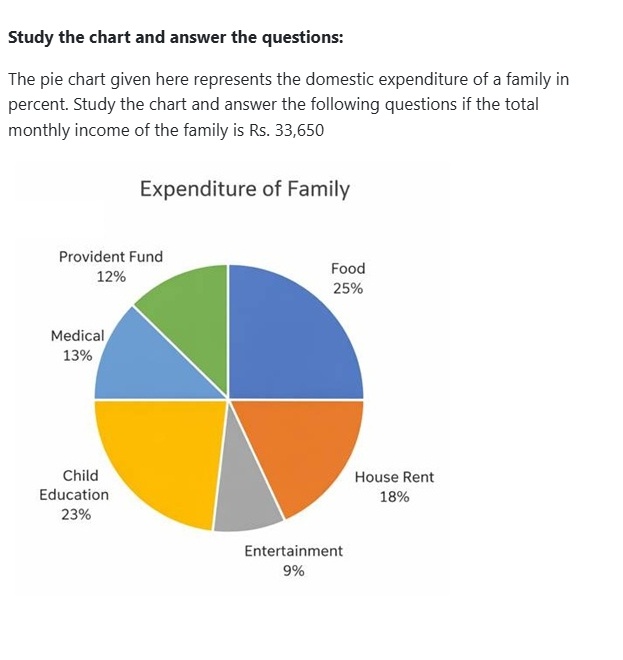
Study the chart and answer the questions:
The pie chart given here represents the domestic expenditure of a family in percent. Study the chart and answer the following questions if the total monthly income of the family is Rs. 33,650
Data read from chart (Expenditure of Family):
| Item | Percent |
|---|---|
| Food | 25% |
| House Rent | 18% |
| Entertainment | 9% |
| Child Education | 23% |
| Medical | 13% |
| Provident Fund | 12% |
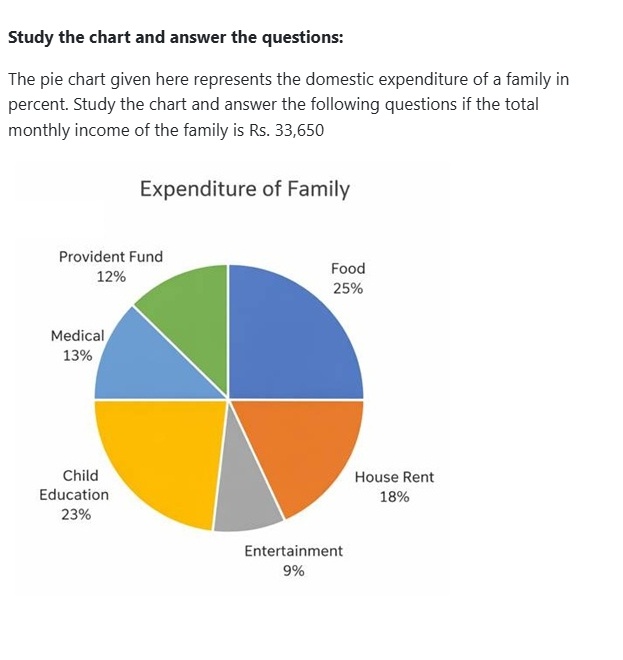
House rent per month is
Answer: C. Rs. 6057
Solution — first steps
The full step-by-step working opens with a free login.
Refer to the passage above ↑
Annual Saving in the form of provident funds
Answer: A. Rs. 48456
Solution — first steps
The full step-by-step working opens with a free login.
Refer to the passage above ↑
After provident fund deduction and payment of house rent,total monthly income of family remains:
Answer: C. Rs. 23555
Solution — first steps
The full step-by-step working opens with a free login.
Refer to the passage above ↑
Total amount per month,the family spends on food and entertainment combined together is
Answer: B. Rs. 11441
Solution — first steps
The full step-by-step working opens with a free login.
Refer to the passage above ↑
What is the difference between medical and entertainment expenses?
Answer: A. 1346
Solution — first steps
The full step-by-step working opens with a free login.