CET Pie Charts Questions with Solutions – Page 9
All 38 Pie Charts questions from MBA CET 2025 and 2026 papers. Tap Show answer, or open the detailed solution (free login). Page 9 of 9.
Questions 141–144 share this
The following pie-charts show the distribution of students of graduate and post-graduate levels in 7 different institutes: M, N, P, Q, R, S, and T in a town. Study the pie-charts carefully and answer the questions given below:
Distribution of students at graduate and post-graduate levels in seven institutes – M, N, P, Q, R, S and T
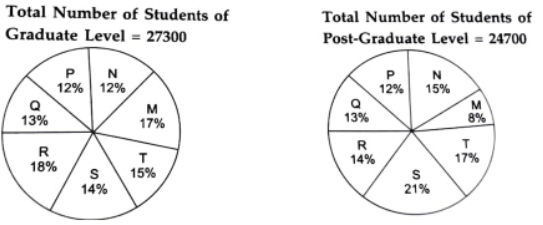
Answer: B. 8463
Solution — first steps
The full step-by-step working opens with a free login.
Refer to the passage above ↑
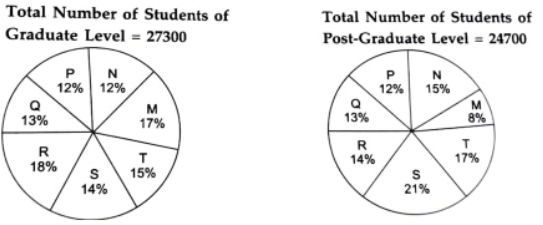
Answer: C. 6669
Solution — first steps
The full step-by-step working opens with a free login.
Refer to the passage above ↑
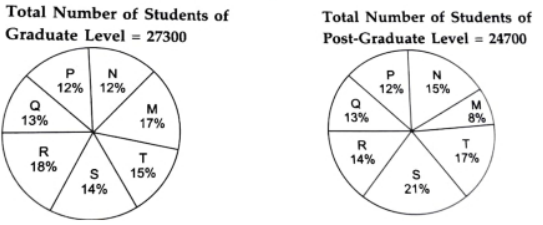
Answer: D. 8372
Solution — first steps
The full step-by-step working opens with a free login.
Refer to the passage above ↑
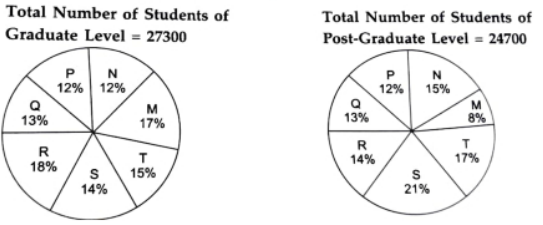
Answer: D. 19:14
Solution — first steps
The full step-by-step working opens with a free login.