CET Pie Charts Questions with Solutions – Page 2
All 38 Pie Charts questions from MBA CET 2025 and 2026 papers. Tap Show answer, or open the detailed solution (free login). Page 2 of 9.
Questions 146–150 share this
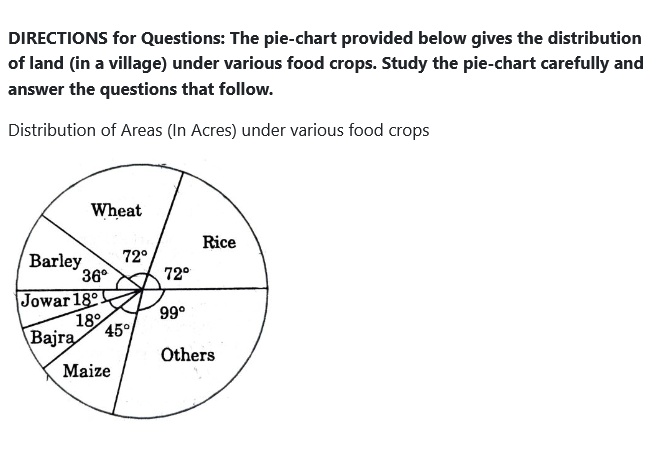
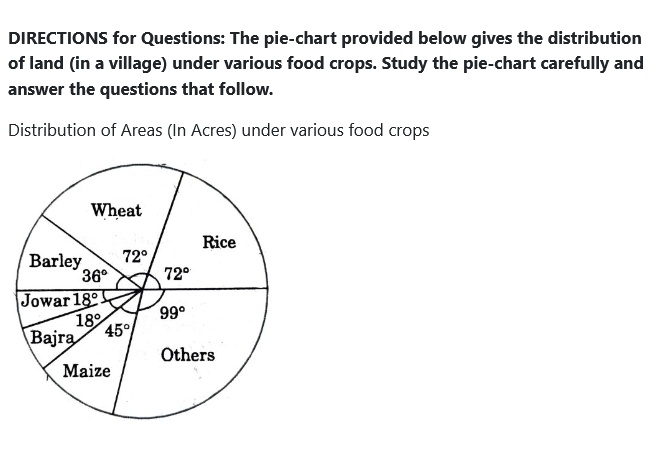
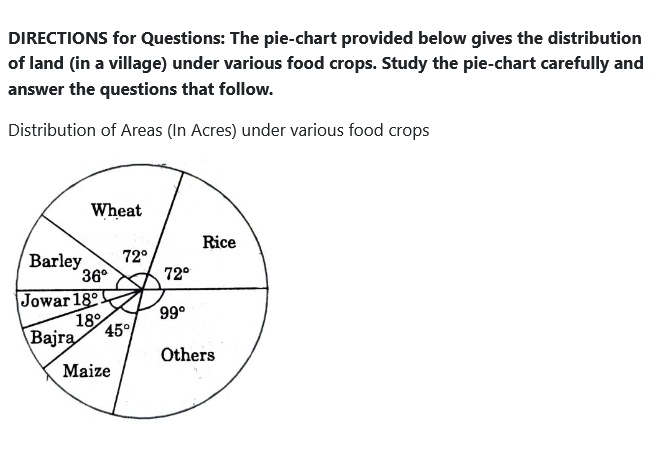
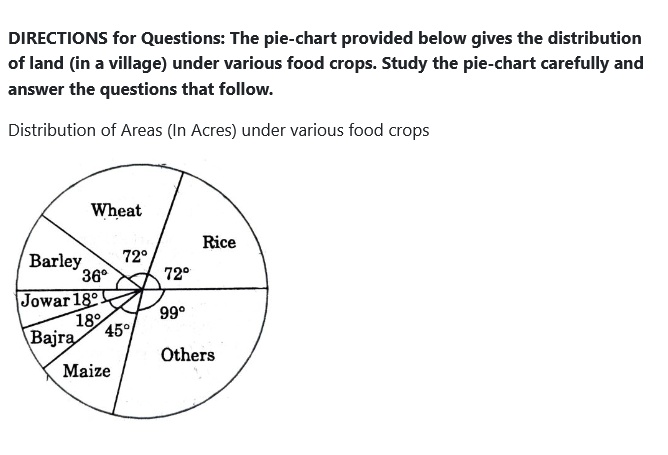
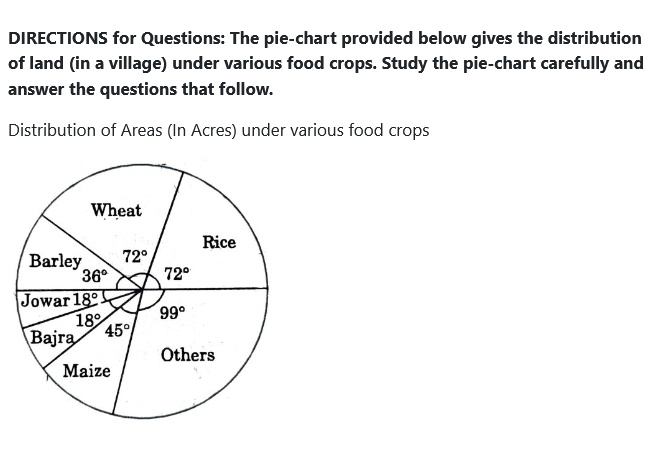
DIRECTIONS for Questions: The pie-chart provided below gives the distribution of land (in a village) under various food crops. Study the pie-chart carefully and answer the questions that follow.
Distribution of Areas (In Acres) under various food crops
Data read from chart (central angles):
| Crop | Angle |
|---|---|
| Wheat | 72° |
| Rice | 72° |
| Others | 99° |
| Maize | 45° |
| Bajra | 18° |
| Jowar | 18° |
| Barley | 36° |
Which combination of three crops contributes to 50% of the total area under the food crops?
- Wheat, Barley and Jowar
- Rice, Wheat and Jowar
- Rice, Wheat and Barley
- Bajra , Maize and Rice
- Barley, Jowar and Rice
Show answerHide answer
Answer: C. Rice, Wheat and Barley
Refer to the passage above ↑
If the total area under jowar was 1.5 million acres, then what was the area (in million acres) under rice?
- 6
- 7.5
- 9
- 4.5
- 2
Show answerHide answer
Answer: A. 6
Refer to the passage above ↑
If the production of wheat is 6 times that of barley, then what is the ratio between the yield per acre of wheat and barley?
- 3:2
- 3:1
- 12:1
- 2:3
- 3:5
Show answerHide answer
Answer: B. 3:1
Refer to the passage above ↑
If the yield per acre of rice was 50% more than that of barley, then the production of barley is what percentage of that of rice?
- 30%
- 33.33%
- 35.5%
- 36%
- 50.65%
Show answerHide answer
Answer: B. 33.33%
Refer to the passage above ↑
If the total area goes up by 5%, and the area under wheat production goes up by 12%, then what will be the angle for wheat in the new pie-chart?
- 62.4°
- 76.8°
- 80.6°
- 84.2°
- 12.4°
Show answerHide answer
Answer: B. 76.8°