CET Pie Charts Questions with Solutions – Page 3
All 38 Pie Charts questions from MBA CET 2025 and 2026 papers. Tap Show answer, or open the detailed solution (free login). Page 3 of 9.
Questions 141–145 share this
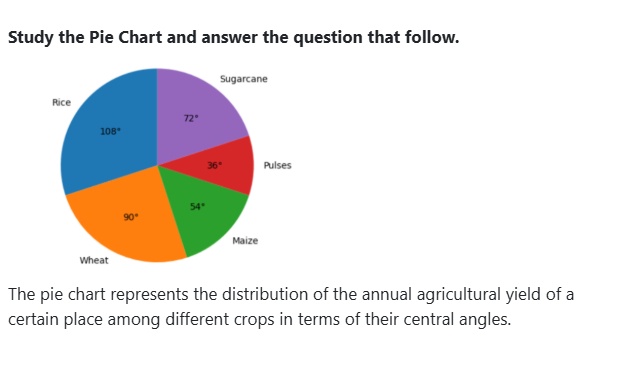
Study the Pie Chart and answer the question that follow.
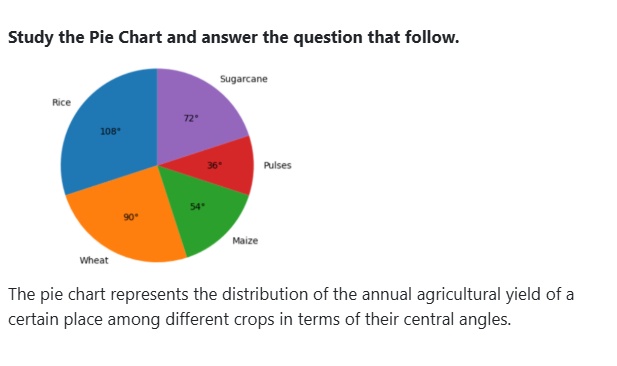
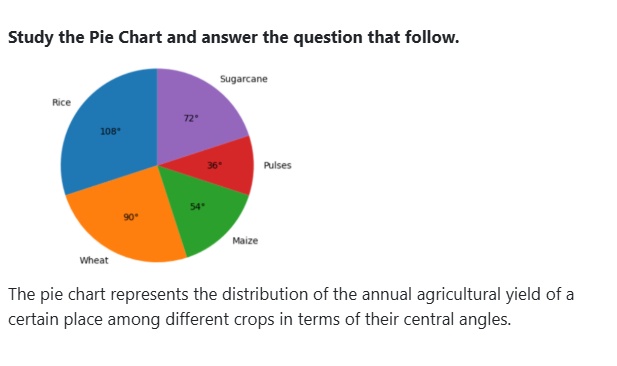
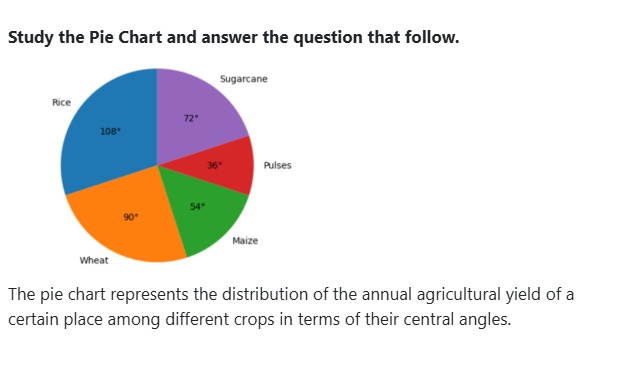
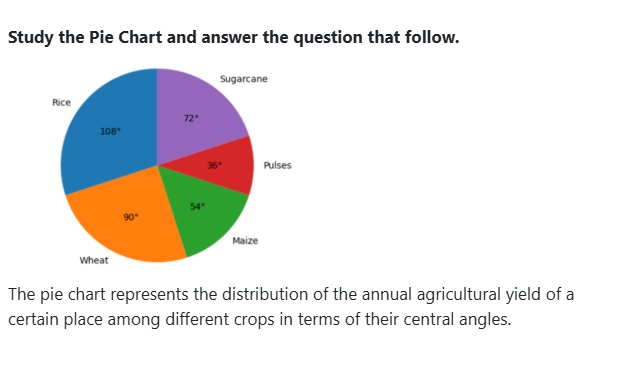
The pie chart represents the distribution of the annual agricultural yield of a certain place among different crops in terms of their central angles.
Data read from chart:
| Crop | Central angle |
|---|---|
| Rice | 108° |
| Wheat | 90° |
| Maize | 54° |
| Pulses | 36° |
| Sugarcane | 72° |
Answer: C. 240 tonnes
Solution — first steps
The full step-by-step working opens with a free login.
Refer to the passage above ↑
Answer: B. 23%
Solution — first steps
The full step-by-step working opens with a free login.
Refer to the passage above ↑
Answer: B. Wheat
Solution — first steps
The full step-by-step working opens with a free login.
Refer to the passage above ↑
Answer: B. 3 : 1
Solution — first steps
The full step-by-step working opens with a free login.
Refer to the passage above ↑
Answer: A. Pulses will have the lowest production
Solution — first steps
The full step-by-step working opens with a free login.