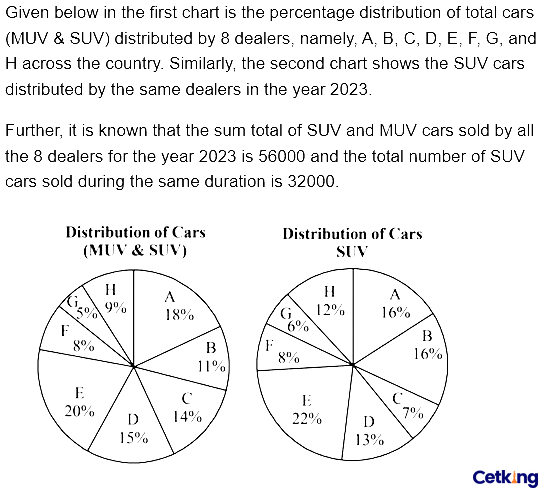
Passage / data for this question
The following table gives the sales of batteries manufactured by a company over the years.
Number of Different Types of Batteries Sold by a Company Over the Years (Numbers in Thousands)
| Year | Types of Batteries |
|---|
| 4AH | 7AH | 32AH | 35AH | 55AH | Total |
|---|
| 1992 | 75 | 144 | 114 | 102 | 108 | 543 |
| 1993 | 90 | 126 | 102 | 84 | 126 | 528 |
| 1994 | 96 | 114 | 75 | 105 | 135 | 525 |
| 1995 | 105 | 90 | 150 | 90 | 75 | 510 |
| 1996 | 90 | 75 | 135 | 75 | 90 | 465 |
| 1997 | 105 | 60 | 165 | 45 | 120 | 495 |
| 1998 | 115 | 85 | 160 | 100 | 145 | 605 |
What was the approximate percentage increase in the sales of 55AH batteries in 1998 compared to that in 1992 ?
- A28%
- B38%
- C34%
- D25%
- E22%
Show answerHide answer
Answer: C ✓ official key
Approach: Percentage change = (new − old)/old × 100.
Solution:
55AH: 1992 = 108, 1998 = 145.
Increase = 37 → 37/108 × 100 ≈ 34.3% ≈ 34%.
Cetking shortcut: 37/108 is a bit more than 1/3 → 34%.
Answer: C
Passage / data for this question
The following table gives the sales of batteries manufactured by a company over the years.
Number of Different Types of Batteries Sold by a Company Over the Years (Numbers in Thousands)
| Year | Types of Batteries |
|---|
| 4AH | 7AH | 32AH | 35AH | 55AH | Total |
|---|
| 1992 | 75 | 144 | 114 | 102 | 108 | 543 |
| 1993 | 90 | 126 | 102 | 84 | 126 | 528 |
| 1994 | 96 | 114 | 75 | 105 | 135 | 525 |
| 1995 | 105 | 90 | 150 | 90 | 75 | 510 |
| 1996 | 90 | 75 | 135 | 75 | 90 | 465 |
| 1997 | 105 | 60 | 165 | 45 | 120 | 495 |
| 1998 | 115 | 85 | 160 | 100 | 145 | 605 |
The total sales of all the seven years is the maximum for which battery ?
- A4AH
- B7AH
- C32AH
- D35AH
- E55AH
Show answerHide answer
Answer: C ✓ official key
Approach: Add each column over the seven years.
Solution:
4AH: 75+90+96+105+90+105+115 = 676
7AH: 144+126+114+90+75+60+85 = 694
32AH: 114+102+75+150+135+165+160 = 901
35AH: 102+84+105+90+75+45+100 = 601
55AH: 108+126+135+75+90+120+145 = 799
Maximum = 32AH (901 thousand).
Cetking shortcut: 32AH has three values ≥ 150 in the last four years — check it against 55AH only.
Answer: C
Passage / data for this question
The following table gives the sales of batteries manufactured by a company over the years.
Number of Different Types of Batteries Sold by a Company Over the Years (Numbers in Thousands)
| Year | Types of Batteries |
|---|
| 4AH | 7AH | 32AH | 35AH | 55AH | Total |
|---|
| 1992 | 75 | 144 | 114 | 102 | 108 | 543 |
| 1993 | 90 | 126 | 102 | 84 | 126 | 528 |
| 1994 | 96 | 114 | 75 | 105 | 135 | 525 |
| 1995 | 105 | 90 | 150 | 90 | 75 | 510 |
| 1996 | 90 | 75 | 135 | 75 | 90 | 465 |
| 1997 | 105 | 60 | 165 | 45 | 120 | 495 |
| 1998 | 115 | 85 | 160 | 100 | 145 | 605 |
What is the difference in the number of 35AH batteries sold in 1993 and 1997 ?
- A24000
- B32000
- C45000
- D39000
- E46000
Show answerHide answer
Answer: D ✓ official key
Approach: Read two cells and subtract; table is in thousands.
Solution:
35AH: 1993 = 84 thousand, 1997 = 45 thousand.
Difference = 39 thousand = 39,000.
Cetking shortcut: Remember the unit (thousands).
Answer: D
Passage / data for this question
The following table gives the sales of batteries manufactured by a company over the years.
Number of Different Types of Batteries Sold by a Company Over the Years (Numbers in Thousands)
| Year | Types of Batteries |
|---|
| 4AH | 7AH | 32AH | 35AH | 55AH | Total |
|---|
| 1992 | 75 | 144 | 114 | 102 | 108 | 543 |
| 1993 | 90 | 126 | 102 | 84 | 126 | 528 |
| 1994 | 96 | 114 | 75 | 105 | 135 | 525 |
| 1995 | 105 | 90 | 150 | 90 | 75 | 510 |
| 1996 | 90 | 75 | 135 | 75 | 90 | 465 |
| 1997 | 105 | 60 | 165 | 45 | 120 | 495 |
| 1998 | 115 | 85 | 160 | 100 | 145 | 605 |
The percentage of 4AH batteries sold to the total number of batteries sold was maximum in the year ?
- A1994
- B1995
- C1996
- D1997
- E1998
Show answerHide answer
Answer: D ✓ official key
Approach: Share = 4AH sales / year total; compare ratios.
Solution:
1994: 96/525 ≈ 18.3%
1995: 105/510 ≈ 20.6%
1996: 90/465 ≈ 19.4%
1997: 105/495 ≈ 21.2%
1998: 115/605 ≈ 19.0%
Maximum share in 1997.
Cetking shortcut: 1995 vs 1997: same numerator 105, smaller total in 1997 (495 < 510) → 1997 beats 1995; others are clearly below 20%.
Answer: D
Passage / data for this question
The following table gives the sales of batteries manufactured by a company over the years.
Number of Different Types of Batteries Sold by a Company Over the Years (Numbers in Thousands)
| Year | Types of Batteries |
|---|
| 4AH | 7AH | 32AH | 35AH | 55AH | Total |
|---|
| 1992 | 75 | 144 | 114 | 102 | 108 | 543 |
| 1993 | 90 | 126 | 102 | 84 | 126 | 528 |
| 1994 | 96 | 114 | 75 | 105 | 135 | 525 |
| 1995 | 105 | 90 | 150 | 90 | 75 | 510 |
| 1996 | 90 | 75 | 135 | 75 | 90 | 465 |
| 1997 | 105 | 60 | 165 | 45 | 120 | 495 |
| 1998 | 115 | 85 | 160 | 100 | 145 | 605 |
In case of which battery there was a continuous decrease in sales from 1992 to 1997 ?
- A4AH
- B7AH
- C32AH
- D35AH
- E55AH
Show answerHide answer
Answer: B ✓ official key
Approach: Scan each column from 1992 to 1997 for a strictly falling run.
Solution:
7AH: 144 → 126 → 114 → 90 → 75 → 60 — falls every year.
4AH rises (75 → 90 …); 32AH and 55AH rise in 1993/1994; 35AH rises in 1994 (84 → 105).
Why the other options are wrong:
A and E rise in the first year (75 → 90; 108 → 126); C falls at first but rises in 1995 (75 → 150); D (35AH) rises from 84 to 105 in 1994.
Cetking shortcut: Reject a column at the first rise you see.
Answer: B
Passage / data for this question
Six fruits are sold at different rates per kg in six different cities. The rates in (Rs.) per kg at which they are sold are given below. Study the figure and answer the question that follows.
| Fruits | Cities |
|---|
| Delhi | Mumbai | Chennai | Bangalore | Agra | Amritsar |
|---|
| Apple | 83 | 96 | 55 | 90 | 88 | 66 |
| Banana | 55 | 59 | 86 | 47 | 55 | 72 |
| Carrot | 98 | 99 | 90 | 88 | 83 | 81 |
| Grapes | 75 | 34 | 45 | 79 | 75 | 69 |
| Mango | 102 | 28 | 66 | 65 | 100 | 65 |
| Orange | 69 | 98 | 32 | 79 | 105 | 91 |
If one buys 1 kg of each fruit from all the different cities, then in which city will the cost be the highest?
- ADelhi
- BMumbai
- CBangalore
- DAmritsar
- EAgra
Show answerHide answer
Answer: E ✓ official key
Approach: Add each city's column (1 kg of each fruit).
Solution:
Delhi: 83+55+98+75+102+69 = 482
Mumbai: 96+59+99+34+28+98 = 414
Bangalore: 90+47+88+79+65+79 = 448
Amritsar: 66+72+81+69+65+91 = 444
Agra: 88+55+83+75+100+105 = 506
(Chennai: 374)
Highest = Agra.
Cetking shortcut: Delhi vs Agra only: Agra beats Delhi by +5, 0, −15, 0, −2, +36 = +24.
Answer: E
Passage / data for this question
Six fruits are sold at different rates per kg in six different cities. The rates in (Rs.) per kg at which they are sold are given below. Study the figure and answer the question that follows.
| Fruits | Cities |
|---|
| Delhi | Mumbai | Chennai | Bangalore | Agra | Amritsar |
|---|
| Apple | 83 | 96 | 55 | 90 | 88 | 66 |
| Banana | 55 | 59 | 86 | 47 | 55 | 72 |
| Carrot | 98 | 99 | 90 | 88 | 83 | 81 |
| Grapes | 75 | 34 | 45 | 79 | 75 | 69 |
| Mango | 102 | 28 | 66 | 65 | 100 | 65 |
| Orange | 69 | 98 | 32 | 79 | 105 | 91 |
What is the cost of 2 kg Banana from Amritsar, 4 kg Apple from Mumbai and 3kg Mango from Delhi?
- ARs. 798
- BRs. 807
- CRs. 834
- DRs. 877
- ERs. 896
Show answerHide answer
Answer: C ✓ official key
Approach: Read the three rates, multiply by quantities, add.
Solution:
Banana, Amritsar: 2 × 72 = 144.
Apple, Mumbai: 4 × 96 = 384.
Mango, Delhi: 3 × 102 = 306.
Total = 144 + 384 + 306 = Rs. 834.
Why the other options are wrong:
A (798), B (807), D (877), E (896) do not match 144 + 384 + 306.
Cetking shortcut: Unit digits: 4 + 4 + 6 = 14 → answer ends in 4 → only 834.
Answer: C
Passage / data for this question
Six fruits are sold at different rates per kg in six different cities. The rates in (Rs.) per kg at which they are sold are given below. Study the figure and answer the question that follows.
| Fruits | Cities |
|---|
| Delhi | Mumbai | Chennai | Bangalore | Agra | Amritsar |
|---|
| Apple | 83 | 96 | 55 | 90 | 88 | 66 |
| Banana | 55 | 59 | 86 | 47 | 55 | 72 |
| Carrot | 98 | 99 | 90 | 88 | 83 | 81 |
| Grapes | 75 | 34 | 45 | 79 | 75 | 69 |
| Mango | 102 | 28 | 66 | 65 | 100 | 65 |
| Orange | 69 | 98 | 32 | 79 | 105 | 91 |
In the options given below, four out of five are alike and share some common characteristics, one of the following options is the odd man out. Find the odd man out.
- A84 kg grapes from Delhi
- B70 kg carrots from Chennai
- C63 kg mangoes from Agra
- D95 kg mangoes from Bangalore
- E60 kg oranges from Agra
Show answerHide answer
Answer: D ✓ official key
Approach: Compute each total cost; four are equal, one is not.
Solution:
A: 84 × 75 (Grapes, Delhi) = 6300.
B: 70 × 90 (Carrot, Chennai) = 6300.
C: 63 × 100 (Mango, Agra) = 6300.
D: 95 × 65 (Mango, Bangalore) = 6175.
E: 60 × 105 (Orange, Agra) = 6300.
Odd one = D.
Why the other options are wrong:
A, B, C, E all cost exactly Rs. 6300.
Cetking shortcut: 6300 = 2² × 3² × 5² × 7; 95 × 65 has no factor 3 or 7 → it cannot be 6300.
Answer: D
Passage / data for this question
Six fruits are sold at different rates per kg in six different cities. The rates in (Rs.) per kg at which they are sold are given below. Study the figure and answer the question that follows.
| Fruits | Cities |
|---|
| Delhi | Mumbai | Chennai | Bangalore | Agra | Amritsar |
|---|
| Apple | 83 | 96 | 55 | 90 | 88 | 66 |
| Banana | 55 | 59 | 86 | 47 | 55 | 72 |
| Carrot | 98 | 99 | 90 | 88 | 83 | 81 |
| Grapes | 75 | 34 | 45 | 79 | 75 | 69 |
| Mango | 102 | 28 | 66 | 65 | 100 | 65 |
| Orange | 69 | 98 | 32 | 79 | 105 | 91 |
Which of the following options is cheapest to buy?
- A4 kg apple from Bangalore
- B5 kg banana from Agra
- C7 kg grapes from Mumbai
- D4 kg carrot from Amritsar
- E8 kg orange from Chennai
Show answerHide answer
Answer: C ✓ official key
Approach: Compute each cost from the table and pick the minimum.
Solution:
A: 4 × 90 = 360.
B: 5 × 55 = 275.
C: 7 × 34 = 238.
D: 4 × 81 = 324.
E: 8 × 32 = 256.
Cheapest = C (Rs. 238).
Why the other options are wrong:
A 360, B 275, D 324, E 256 — all costlier than Rs. 238.
Cetking shortcut: Only C and E are under 260 — compare 238 vs 256.
Answer: C
Passage / data for this question
Six fruits are sold at different rates per kg in six different cities. The rates in (Rs.) per kg at which they are sold are given below. Study the figure and answer the question that follows.
| Fruits | Cities |
|---|
| Delhi | Mumbai | Chennai | Bangalore | Agra | Amritsar |
|---|
| Apple | 83 | 96 | 55 | 90 | 88 | 66 |
| Banana | 55 | 59 | 86 | 47 | 55 | 72 |
| Carrot | 98 | 99 | 90 | 88 | 83 | 81 |
| Grapes | 75 | 34 | 45 | 79 | 75 | 69 |
| Mango | 102 | 28 | 66 | 65 | 100 | 65 |
| Orange | 69 | 98 | 32 | 79 | 105 | 91 |
What is the average selling price of Orange for all the cities?
- ARs.68
- BRs.88
- CRs.74
- DRs.91
- ERs.79
Show answerHide answer
Answer: E ✓ official key
Approach: Average = sum of the row ÷ number of cities.
Solution:
Orange: 69 + 98 + 32 + 79 + 105 + 91 = 474.
Average = 474 / 6 = Rs. 79.
Cetking shortcut: Deviation from 80: −11, +18, −48, −1, +25, +11 = −6 → 80 − 1 = 79.
Answer: E
Passage / data for this question
Study the table carefully and answer the questions that follow.
The table below shows the export value of selected major commodities from India during the period April–October 2024–25. The export values are expressed in US$ million.
| Commodity | Export Value |
|---|
| Engineering Goods | 67,426 |
| Petroleum Products | 39,068 |
| Electronic Goods | 19,068 |
| Gems & Jewellery | 17,160 |
| Drugs & Pharmaceuticals | 17,032 |
If the total export value of the given commodities is taken as 100%, which of the following commodities accounts for approximately 12% of the total exports?
- AEngineering Goods
- BPetroleum Products
- CElectronic Goods
- DGems & Jewellery
- EDrugs & Pharmaceuticals
Show answerHide answer
Answer: C ✓ official key
Approach: Find the total, then 12% of it, and match.
Solution:
Total = 67,426 + 39,068 + 19,068 + 17,160 + 17,032 = 1,59,754.
12% of 1,59,754 ≈ 19,170.
Electronic Goods = 19,068 → 19,068/1,59,754 ≈ 11.9% ≈ 12%.
Why the other options are wrong:
A ≈ 42%, B ≈ 24%, D ≈ 10.7%, E ≈ 10.7%.
Cetking shortcut: 10% of total ≈ 16,000, so 12% ≈ 19,200 — only Electronic Goods is near.
Answer: C
Passage / data for this question
Study the table carefully and answer the questions that follow.
The table below shows the export value of selected major commodities from India during the period April–October 2024–25. The export values are expressed in US$ million.
| Commodity | Export Value |
|---|
| Engineering Goods | 67,426 |
| Petroleum Products | 39,068 |
| Electronic Goods | 19,068 |
| Gems & Jewellery | 17,160 |
| Drugs & Pharmaceuticals | 17,032 |
What is the percentage share of Engineering Goods in the total exports of the selected commodities (approx.)?
- A38.5%
- B40.9%
- C42.2%
- D45.6%
- E52.3 %
Show answerHide answer
Answer: C ✓ official key
Approach: Percentage share = part / total × 100.
Solution:
Total = 1,59,754.
Engineering share = 67,426 / 1,59,754 × 100 ≈ 42.2%.
Cetking shortcut: 40% of 1,59,754 = 63,902; remaining 3,524 ≈ 2.2% → 42.2%.
Answer: C
Passage / data for this question
Study the table carefully and answer the questions that follow.
The table below shows the export value of selected major commodities from India during the period April–October 2024–25. The export values are expressed in US$ million.
| Commodity | Export Value |
|---|
| Engineering Goods | 67,426 |
| Petroleum Products | 39,068 |
| Electronic Goods | 19,068 |
| Gems & Jewellery | 17,160 |
| Drugs & Pharmaceuticals | 17,032 |
By how much (in US$ million) do Petroleum Products exports exceed the combined exports of Gems & Jewellery and Drugs & Pharmaceuticals?
- A4,876
- B4,904
- C5,012
- D5,146
- E5,346
Show answerHide answer
Answer: A ✓ official key
Approach: Simple difference from the table.
Solution:
Gems & Jewellery + Drugs & Pharma = 17,160 + 17,032 = 34,192.
Petroleum − combined = 39,068 − 34,192 = 4,876.
Cetking shortcut: Units digit: 0 + 2 = 2, and 8 − 2 = 6 → only A ends in 6.
Answer: A
Passage / data for this question
Study the table carefully and answer the questions that follow.
The table below shows the export value of selected major commodities from India during the period April–October 2024–25. The export values are expressed in US$ million.
| Commodity | Export Value |
|---|
| Engineering Goods | 67,426 |
| Petroleum Products | 39,068 |
| Electronic Goods | 19,068 |
| Gems & Jewellery | 17,160 |
| Drugs & Pharmaceuticals | 17,032 |
If exports of Petroleum Products decline by 8% and exports of Gems & Jewellery increase by 12%, what will be the net change (increase/decrease) in total exports of the five commodities (in US$ million)?
- ADecrease of 1,058
- BDecrease of 1,066
- CIncrease of 1,196
- DDecrease of 1,248
- EIncrease of 1,058
Show answerHide answer
Answer: B ✓ official key
Approach: Net change = sum of individual changes; other commodities unchanged.
Solution:
Petroleum change = −8% of 39,068 = −3,125.44.
Gems change = +12% of 17,160 = +2,059.20.
Net = −3,125.44 + 2,059.20 = −1,066.24 → decrease of about 1,066.
Cetking shortcut: Sign check first: 8% of ~39k (≈3.1k) > 12% of ~17k (≈2.1k), so it is a decrease — eliminates C and E.
Answer: B
Passage / data for this question
Study the table carefully and answer the questions that follow.
The table below shows the export value of selected major commodities from India during the period April–October 2024–25. The export values are expressed in US$ million.
| Commodity | Export Value |
|---|
| Engineering Goods | 67,426 |
| Petroleum Products | 39,068 |
| Electronic Goods | 19,068 |
| Gems & Jewellery | 17,160 |
| Drugs & Pharmaceuticals | 17,032 |
If the total export value of all five commodities increases by 12%, and this entire increase is distributed only between Engineering Goods and Petroleum Products in the ratio of their original export values, what will be the increase in the export value of Petroleum Products (approximately, in US$ million)?
- A4,500
- B7,020
- C8,500
- D9,702
- E11720
Show answerHide answer
Answer: B ✓ official key
Approach: Distribute the increase in proportion to the two original values.
Solution:
Total = 1,59,754; 12% increase = 19,170.48.
Engineering + Petroleum = 67,426 + 39,068 = 1,06,494.
Petroleum's part = 19,170.48 × 39,068 / 1,06,494 ≈ 19,170 × 0.367 ≈ 7,033.
Nearest option ≈ 7,020.
Cetking shortcut: Petroleum : Engineering ≈ 39 : 67 ≈ 37% of the pair; 37% of 19,170 ≈ 7,000 → B.
Answer: B
Passage / data for this question
Study the chart and answer the questions:
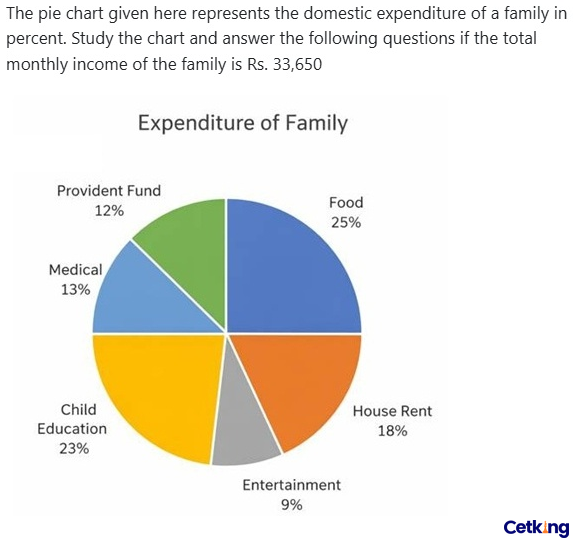
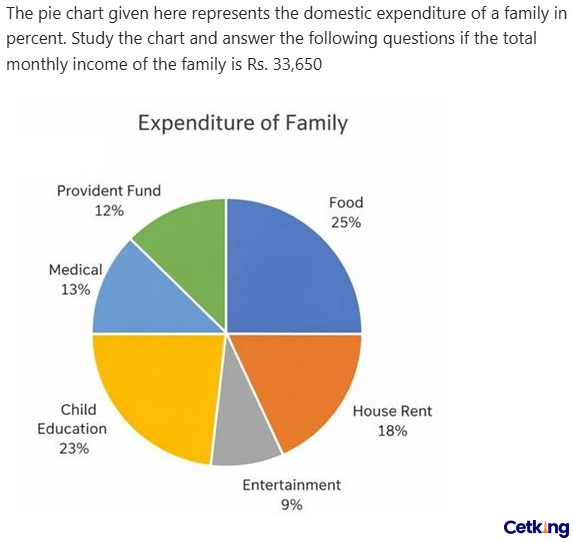
The pie chart given here represents the domestic expenditure of a family in percent. Study the chart and answer the following questions if the total monthly income of the family is Rs. 33,650
- ARs. 6000
- BRs. 6152
- CRs. 6057
- DRs. 6048
- ERs. 7740
Show answerHide answer
Answer: C ✓ official key
Approach: Pie percentage to absolute value.
Solution:
House Rent = 18% of 33,650.
10% = 3,365; 8% = 2,692; total = 6,057.
Cetking shortcut: 1% = 336.5 → 18 × 336.5 = 6,057.
Answer: C
Passage / data for this question
Study the chart and answer the questions:
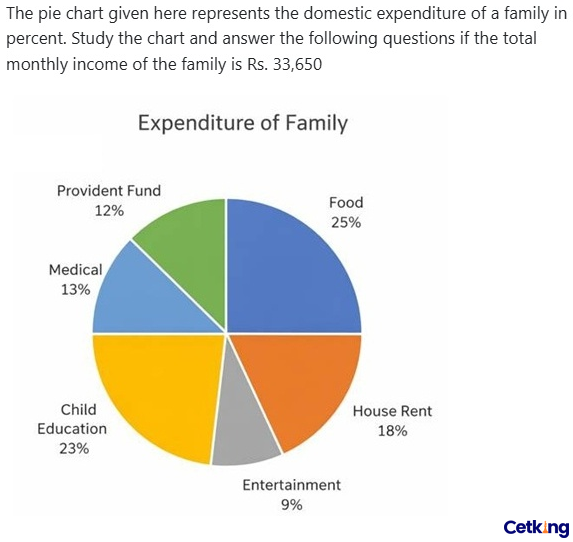
The pie chart given here represents the domestic expenditure of a family in percent. Study the chart and answer the following questions if the total monthly income of the family is Rs. 33,650
Annual Saving in the form of provident funds
- ARs. 48456
- BRs. 48540
- CRs. 44856
- DRs. 45480
- ERs. 46480
Show answerHide answer
Answer: A ✓ official key
Approach: Monthly PF from the pie, then annualise.
Solution:
PF = 12% of 33,650 = 4,038 per month.
Annual = 4,038 × 12 = 48,456.
Why the other options are wrong:
B, D shuffle digits (48,540 / 45,480); C, E are miscalculations.
Cetking shortcut: 12% × 12 months = 144% of monthly income: 1.44 × 33,650 = 48,456.
Answer: A
Passage / data for this question
Study the chart and answer the questions:
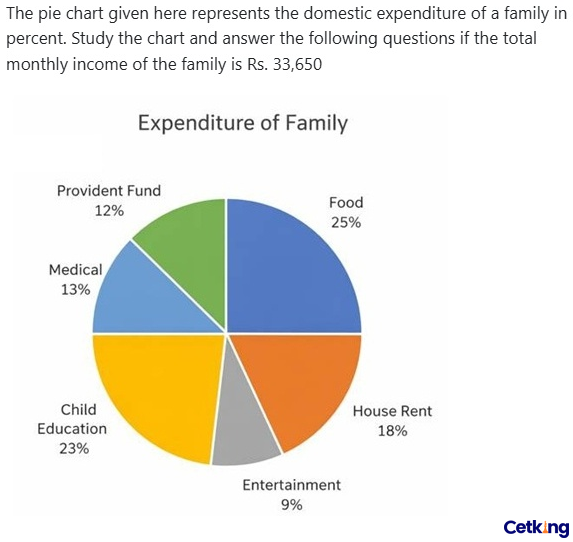
The pie chart given here represents the domestic expenditure of a family in percent. Study the chart and answer the following questions if the total monthly income of the family is Rs. 33,650
After provident fund deduction and payment of house rent,total monthly income of family remains:
- ARs. 23545
- BRs. 24435
- CRs. 23555
- DRs. 25355
- ERs. 26355
Show answerHide answer
Answer: C ✓ official key
Approach: Remaining share = 100% − (Rent + PF).
Solution:
Rent + PF = 18% + 12% = 30%.
Remaining = 70% of 33,650 = 23,555.
Why the other options are wrong:
A (23,545) and B (24,435) are near-miss digit traps; D, E are wrong percentages.
Cetking shortcut: 33,650 − 30% (10,095) = 23,555.
Answer: C
Passage / data for this question
Study the chart and answer the questions:
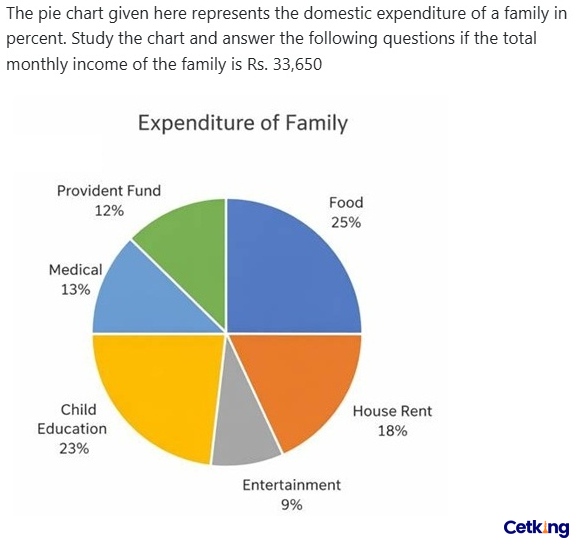
The pie chart given here represents the domestic expenditure of a family in percent. Study the chart and answer the following questions if the total monthly income of the family is Rs. 33,650
Total amount per month,the family spends on food and entertainment combined together is
- ARs. 11432
- BRs. 11441
- CRs. 12315
- DRs. 12443
- ERs. 13443
Show answerHide answer
Answer: B ✓ official key
Approach: Add the two percentages, then convert.
Solution:
Food + Entertainment = 25% + 9% = 34%.
34% of 33,650 = 11,441.
Why the other options are wrong:
A (11,432) is a near-miss; C, D, E use wrong percentages.
Cetking shortcut: 1% = 336.5; × 34 = 11,441.
Answer: B
Passage / data for this question
Study the chart and answer the questions:
The pie chart given here represents the domestic expenditure of a family in percent. Study the chart and answer the following questions if the total monthly income of the family is Rs. 33,650
What is the difference between medical and entertainment expenses?
- A1346
- B1386
- C2019
- D2355
- E3365
Show answerHide answer
Answer: A ✓ official key
Approach: Difference of two pie percentages, then convert.
Solution:
Medical − Entertainment = 13% − 9% = 4%.
4% of 33,650 = 1,346.
Why the other options are wrong:
C (2,019) = 6%; D (2,355) = 7%; E (3,365) = 10%; B is a near-miss.
Cetking shortcut: 1% = 336.5 → × 4 = 1,346.
Answer: A
Passage / data for this question
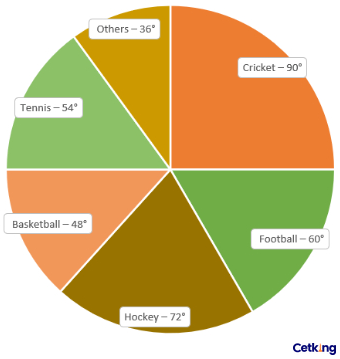
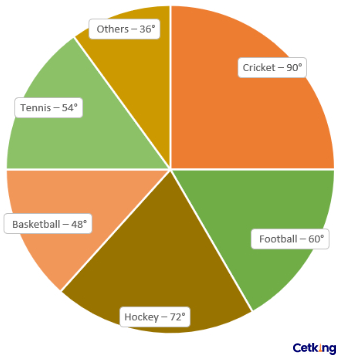
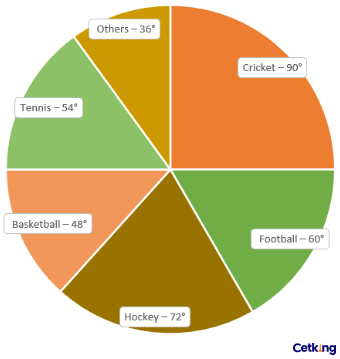
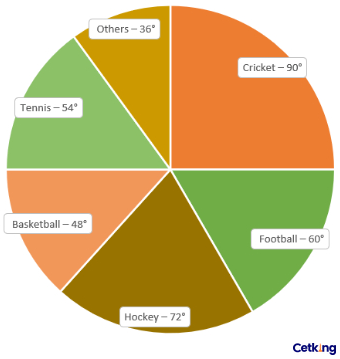
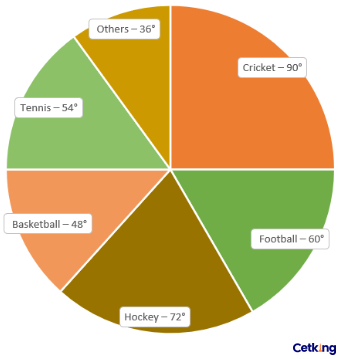
The circle-graph shows the distribution of total expenditure of ₹720 crore by a country on various sports during a particular year.
Study the graph carefully and answer the questions given below.
What is the expenditure on Cricket?
- A₹150 crore
- B₹162 crore
- C₹180 crore
- D₹200 crore
- E₹216 crore
Show answerHide answer
Answer: C ✓ official key
Approach: Pie chart: value = (angle/360) × total.
Solution:
Total = ₹720 crore → each degree = 720/360 = ₹2 crore.
Cricket = 90° × 2 = ₹180 crore.
Why the other options are wrong:
- A, B, D, E: correspond to 75°, 81°, 100°, 108° — not 90°.
Cetking shortcut: 90° is a quarter of the circle → 720/4 = 180.
Answer: C
Passage / data for this question
The circle-graph shows the distribution of total expenditure of ₹720 crore by a country on various sports during a particular year.
Study the graph carefully and answer the questions given below.
What is the difference between the average expenditure on Cricket and Football and the expenditure on Hockey?
- A₹4 crore
- B₹5 crore
- C₹6 crore
- D₹7 crore
- E₹10 crore
Show answerHide answer
Answer: C ✓ official key
Approach: Convert each angle to value at ₹2 crore per degree.
Solution:
Cricket = 90 × 2 = 180; Football = 60 × 2 = 120 (₹ crore).
Average of Cricket and Football = (180 + 120)/2 = 150.
Hockey = 72 × 2 = 144.
Difference = 150 − 144 = ₹6 crore.
Why the other options are wrong:
- A, B, D, E: correspond to angle differences of 2°, 2.5°, 3.5°, 5° — the actual difference is 3°.
Cetking shortcut: Work in degrees: average (90 + 60)/2 = 75°, Hockey 72° → 3° × 2 = ₹6 crore.
Answer: C
Passage / data for this question
The circle-graph shows the distribution of total expenditure of ₹720 crore by a country on various sports during a particular year.
Study the graph carefully and answer the questions given below.
If ₹36 crore is transferred from Cricket to Basketball, what will be the new ratio of expenditure on Cricket to Basketball?
- A11 : 9
- B10 : 9
- C12:11
- D18 : 7
- E7 : 6
Show answerHide answer
Answer: C ✓ official key
Approach: Find each value, transfer the amount, then reduce the ratio.
Solution:
Cricket = 90 × 2 = ₹180 crore; Basketball = 48 × 2 = ₹96 crore.
After transferring ₹36 crore: Cricket = 180 − 36 = 144; Basketball = 96 + 36 = 132.
Ratio = 144 : 132 = 12 : 11.
Why the other options are wrong:
- B (10 : 9): mis-simplifies 144 : 132.
- A, D, E: wrong base values or transfer in the wrong direction.
Cetking shortcut: In degrees: ₹36 crore = 18°. Cricket 90 − 18 = 72°, Basketball 48 + 18 = 66° → 72 : 66 = 12 : 11.
Answer: C
Passage / data for this question
The circle-graph shows the distribution of total expenditure of ₹720 crore by a country on various sports during a particular year.
Study the graph carefully and answer the questions given below.
Expenditure on Tennis is what percent less than the combined expenditure on Hockey and Others?
- A20%
- B25%
- C30%
- D50 %
- E55 %
Show answerHide answer
Answer: D ✓ official key
Approach: Percent less = (difference/larger base) × 100.
Solution:
Tennis = 54 × 2 = ₹108 crore.
Hockey + Others = (72 + 36) × 2 = ₹216 crore.
Tennis is less by (216 − 108)/216 × 100 = 50%.
Why the other options are wrong:
- B (25%): misreads the Tennis/Others values.
- A, C, E: wrong base or arithmetic.
Cetking shortcut: Degrees: 54 vs 72 + 36 = 108 → Tennis is exactly half → 50% less.
Answer: D
Passage / data for this question
The circle-graph shows the distribution of total expenditure of ₹720 crore by a country on various sports during a particular year.
Study the graph carefully and answer the questions given below.
The expenditure on Cricket is equal to the expenditure on which of the following combinations?
- AFootball + Others
- BHockey + Basketball
- CTennis + Others
- DFootball + Basketball
- EBasketball + Tennis
Show answerHide answer
Answer: C ✓ official key
Approach: Compare angles directly — equal angles mean equal expenditure.
Solution:
Cricket = 90°.
Tennis + Others = 54° + 36° = 90° ✓ → equal to Cricket (₹180 crore each).
Why the other options are wrong:
- A: Football + Others = 96°.
- B: Hockey + Basketball = 120°.
- D: Football + Basketball = 108°.
- E: Basketball + Tennis = 102°.
Cetking shortcut: No conversion needed — just add the angles of each pair and look for 90°.
Answer: C
Passage / data for this question
Directions
The following table shows the number of different types of solar panels sold by a company over a period of five years (2021–2025). The figures are given in thousands. Study the data carefully and answer the questions that follow.
| Year | Type A | Type B | Type C | Type D |
|---|
| 2021 | 120 | 95 | 80 | 65 |
| 2022 | 135 | 110 | 90 | 70 |
| 2023 | 150 | 125 | 105 | 85 |
| 2024 | 165 | 140 | 120 | 100 |
| 2025 | 180 | 155 | 135 | 115 |
What is the total number of solar panels (all types) sold by the company in 2023?
- A420 thousand
- B445 thousand
- C465 thousand
- D480 thousand
- E495 thousand
Show answerHide answer
Answer: C ✓ official key
Approach: Add the 2023 row.
Solution:
2023: Type A 150 + Type B 125 + Type C 105 + Type D 85.
Total = 465 thousand.
Why the other options are wrong:
- A, B, D, E: arithmetic slips — the 2023 row adds to exactly 465.
Cetking shortcut: Pair friendly numbers: (150 + 85) + (125 + 105) = 235 + 230 = 465.
Answer: C
Passage / data for this question
Directions
The following table shows the number of different types of solar panels sold by a company over a period of five years (2021–2025). The figures are given in thousands. Study the data carefully and answer the questions that follow.
| Year | Type A | Type B | Type C | Type D |
|---|
| 2021 | 120 | 95 | 80 | 65 |
| 2022 | 135 | 110 | 90 | 70 |
| 2023 | 150 | 125 | 105 | 85 |
| 2024 | 165 | 140 | 120 | 100 |
| 2025 | 180 | 155 | 135 | 115 |
In which year was the difference between sales of Type A and Type D solar panels the minimum?
- A2021
- B2022
- C2023
- D2024
- E2025
Show answerHide answer
Answer: A ✓ official key
Approach: Compute A − D for each year.
Solution:
2021: 120 − 65 = 55.
2022: 135 − 70 = 65; 2023: 150 − 85 = 65; 2024: 165 − 100 = 65; 2025: 180 − 115 = 65.
Minimum difference = 55 in 2021.
Why the other options are wrong:
- B, C, D, E: each has a difference of 65 thousand.
Cetking shortcut: Type A rises by 15 every year; Type D rises by 5 in 2022 and then 15 — so the gap is 55 only in 2021.
Answer: A
Passage / data for this question
Directions
The following table shows the number of different types of solar panels sold by a company over a period of five years (2021–2025). The figures are given in thousands. Study the data carefully and answer the questions that follow.
| Year | Type A | Type B | Type C | Type D |
|---|
| 2021 | 120 | 95 | 80 | 65 |
| 2022 | 135 | 110 | 90 | 70 |
| 2023 | 150 | 125 | 105 | 85 |
| 2024 | 165 | 140 | 120 | 100 |
| 2025 | 180 | 155 | 135 | 115 |
What is the average annual sale of Type B solar panels over the five years?
- A120 thousand
- B125 thousand
- C130 thousand
- D135 thousand
- E140 thousand
Show answerHide answer
Answer: B ✓ official key
Approach: Average = sum of the column ÷ 5.
Solution:
Type B: 95 + 110 + 125 + 140 + 155 = 625.
Average = 625/5 = 125 thousand.
Why the other options are wrong:
- A (120): wrong sum (600).
- C, D, E: averages of other columns or arithmetic slips.
Cetking shortcut: The values are in AP (+15) → average = middle term (2023) = 125.
Answer: B
Passage / data for this question
Directions
The following table shows the number of different types of solar panels sold by a company over a period of five years (2021–2025). The figures are given in thousands. Study the data carefully and answer the questions that follow.
| Year | Type A | Type B | Type C | Type D |
|---|
| 2021 | 120 | 95 | 80 | 65 |
| 2022 | 135 | 110 | 90 | 70 |
| 2023 | 150 | 125 | 105 | 85 |
| 2024 | 165 | 140 | 120 | 100 |
| 2025 | 180 | 155 | 135 | 115 |
Sales of Type C solar panels in 2025 are approximately what percent more than sales of Type C in 2021?
- A50%
- B59 %
- C65%
- D69 %
- E75%
Show answerHide answer
Answer: D ✓ official key
Approach: Percentage increase = (new − old)/old × 100.
Solution:
Type C: 2021 = 80, 2025 = 135.
Increase = 55; % increase = 55/80 × 100 = 68.75% ≈ 69%.
Why the other options are wrong:
- A (50%), B (59%), C (65%), E (75%): wrong base (e.g. 55/135 ≈ 41%) or misread values.
Cetking shortcut: 55/80 = 11/16 = 0.6875 → 69%.
Answer: D
Passage / data for this question
Directions
The following table shows the number of different types of solar panels sold by a company over a period of five years (2021–2025). The figures are given in thousands. Study the data carefully and answer the questions that follow.
| Year | Type A | Type B | Type C | Type D |
|---|
| 2021 | 120 | 95 | 80 | 65 |
| 2022 | 135 | 110 | 90 | 70 |
| 2023 | 150 | 125 | 105 | 85 |
| 2024 | 165 | 140 | 120 | 100 |
| 2025 | 180 | 155 | 135 | 115 |
The ratio of total sales of all types in 2021 to that in 2025 is
- A2 : 3
- B4 : 5
- C8 : 13
- D9 : 11
- E11 : 13
Show answerHide answer
Answer: C ✓ official key
Approach: Find both row totals and simplify the ratio.
Solution:
2021 total = 120 + 95 + 80 + 65 = 360.
2025 total = 180 + 155 + 135 + 115 = 585.
360 : 585 = (÷45) 8 : 13.
Why the other options are wrong:
- A (2 : 3): would need 2025 = 540.
- B (4 : 5), D (9 : 11), E (11 : 13): do not reduce from 360 : 585.
Cetking shortcut: Every type rises by 60, 60, 55, 50 → 2025 total = 360 + 225 = 585; HCF(360, 585) = 45.
Answer: C
Passage / data for this question
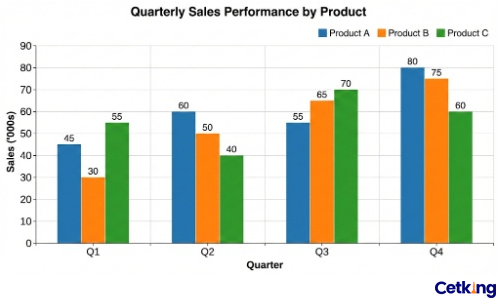
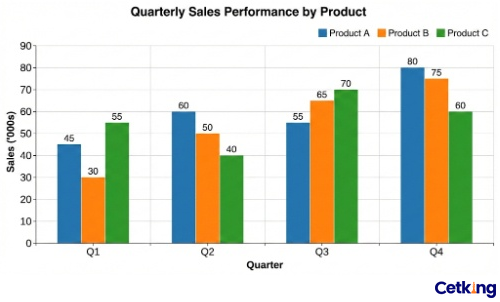
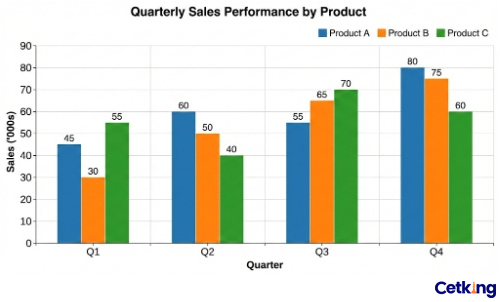
Bar graph. With reference to this graph answer the next 5 questions.
Quarterly Sales Performance by Product (Sales ('000s))
What is the average sales of Product B across all four quarters?
- A50
- B55
- C60
- D65
- E52.5
Show answerHide answer
Answer: B ✓ official key
Approach: Average = sum of the four quarterly values ÷ 4.
Solution:
Product B: Q1 = 30, Q2 = 50, Q3 = 65, Q4 = 75 (in '000s).
Sum = 30 + 50 + 65 + 75 = 220.
Average = 220/4 = 55.
Why the other options are wrong:
A (50) – Q2 value only.
C (60), D (65) – read another product or a single quarter.
E (52.5) – arithmetic slip.
Cetking shortcut: Pair the ends: (30 + 75) + (50 + 65) = 105 + 115 = 220.
Answer: B
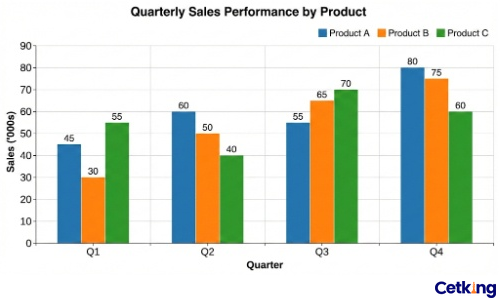
Passage / data for this question
Bar graph. With reference to this graph answer the next 5 questions.
Quarterly Sales Performance by Product (Sales ('000s))
Which quarter witnessed the highest total sales for all three products combined?
- AQ1
- BQ2
- CQ3
- DQ4
- EQ3 and Q4 have equal sales
Show answerHide answer
Answer: D ✓ official key
Approach: Add the three bars of each quarter and compare.
Solution:
Q1 = 45 + 30 + 55 = 130.
Q2 = 60 + 50 + 40 = 150.
Q3 = 55 + 65 + 70 = 190.
Q4 = 80 + 75 + 60 = 215 → highest.
Why the other options are wrong:
A, B – clearly lower totals.
C (Q3) – 190 < 215.
E – Q3 and Q4 are not equal (190 vs 215).
Cetking shortcut: Q4 has the two tallest bars (80, 75) and its third bar (60) is only 10 below Q3's 70 — Q4 wins by inspection.
Answer: D
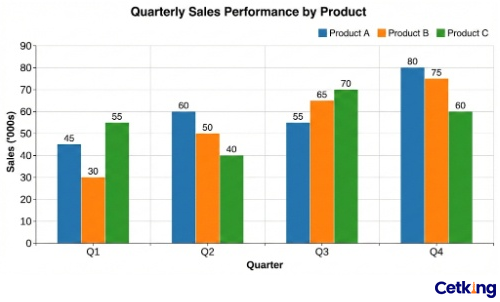
Passage / data for this question
Bar graph. With reference to this graph answer the next 5 questions.
Quarterly Sales Performance by Product (Sales ('000s))
What is the percentage increase in sales of Product A from Q1 to Q4?
- A75%
- B80%
- C77.78%
- D43.75%
- E56.25%
Show answerHide answer
Answer: C ✓ official key
Approach: Percentage increase = (new − old)/old × 100.
Solution:
Product A: Q1 = 45, Q4 = 80.
Increase = 80 − 45 = 35.
% increase = 35/45 × 100 = 7/9 × 100 = 77.78%.
Why the other options are wrong:
D (43.75%) – divides by the new value 80 (35/80).
A (75%), B (80%) – rounding or wrong base.
E (56.25%) – wrong values.
Cetking shortcut: 35/45 = 7/9 = 77.78% (memorise ninths: 1/9 = 11.11%).
Answer: C
Passage / data for this question
Bar graph. With reference to this graph answer the next 5 questions.
Quarterly Sales Performance by Product (Sales ('000s))
What is the ratio of the total sales of Product C to the total sales of Product A?
- A4:11
- B15:16
- C16:15
- D7:11
- E8:15
Show answerHide answer
Answer: B ✓ official key
Approach: Find each product's annual total, then simplify the ratio.
Solution:
Product C total = 55 + 40 + 70 + 60 = 225.
Product A total = 45 + 60 + 55 + 80 = 240.
C : A = 225 : 240 = 15 : 16 (divide by 15).
Why the other options are wrong:
C (16:15) – ratio reversed (A : C).
A, D, E – not supported by the totals.
Cetking shortcut: Both totals are multiples of 15: 225 = 15 × 15, 240 = 15 × 16.
Answer: B
Passage / data for this question
Bar graph. With reference to this graph answer the next 5 questions.
Quarterly Sales Performance by Product (Sales ('000s))
In which quarter did Product B have the lowest share of the total sales?
- AQ1
- BQ2
- CQ3
- DQ4
- EQ1 and Q2
Show answerHide answer
Answer: A ✓ official key
Approach: Share = Product B ÷ quarter total; compare fractions.
Solution:
Q1: 30/130 = 23.1%.
Q2: 50/150 = 33.3%.
Q3: 65/190 = 34.2%.
Q4: 75/215 = 34.9%.
Lowest share = Q1.
Why the other options are wrong:
B, C, D – each above 33%.
E – Q1 and Q2 shares differ (23.1% vs 33.3%).
Cetking shortcut: In Q1, B (30) is less than a quarter of 130; in every other quarter B is about one-third of the total.
Answer: A
Passage / data for this question
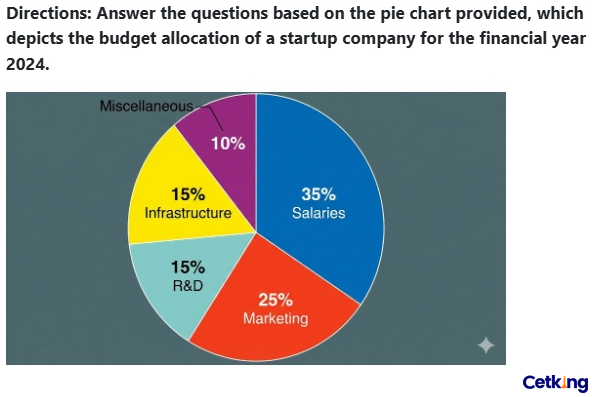
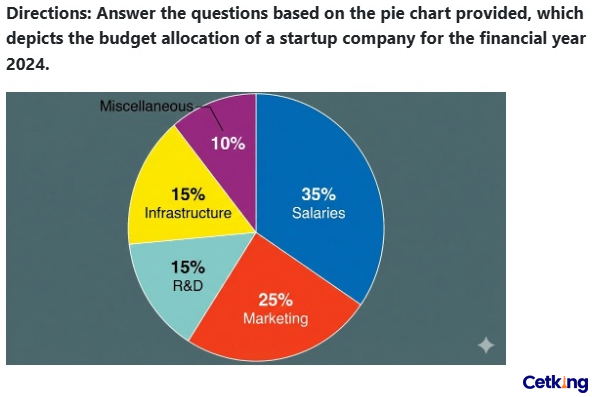
Answer the next 5 questions based on the pie chart shown here.
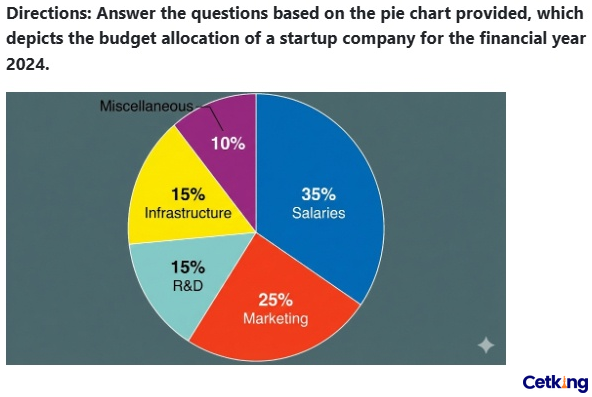
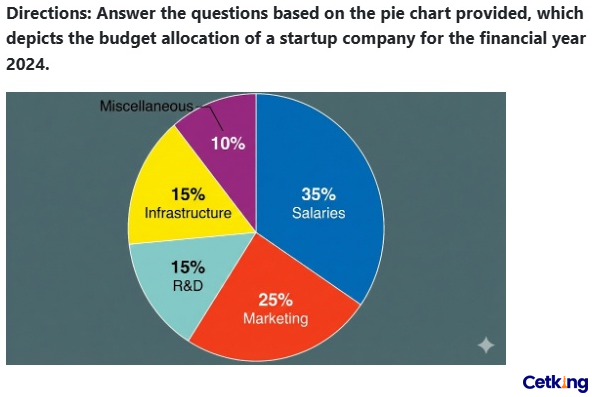
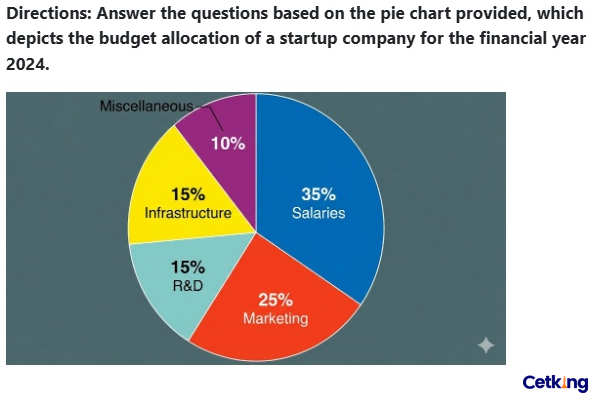
Directions: Answer the questions based on the pie chart provided, which depicts the budget allocation of a startup company for the financial year 2024.
If the total budget of the company is Rs. 20 Crores, what is the difference between the amount spent on 'Salaries' and 'Infrastructure'?
- ARs. 3 Crores
- BRs. 4 Crores
- CRs. 5 Crores
- DRs. 2.5 Crores
- ERs. 3.5 Crores
Show answerHide answer
Answer: B ✓ official key
Approach: Convert the percentage difference into an amount.
Solution:
Salaries = 35%, Infrastructure = 15%.
Difference = 20% of the budget.
20% of Rs. 20 crore = Rs. 4 crore.
Why the other options are wrong:
A (3 Cr) – uses 15% difference.
C (5 Cr) – uses Marketing 25%.
D, E – arithmetic slips.
Cetking shortcut: Subtract percentages first, then convert once: 20% × 20 = 4.
Answer: B
Passage / data for this question
Answer the next 5 questions based on the pie chart shown here.
Directions: Answer the questions based on the pie chart provided, which depicts the budget allocation of a startup company for the financial year 2024.
The expenditure on 'R&D' is what percent less than the expenditure on 'Marketing'?
- A10%
- B40%
- C60%
- D25%
- E33.33%
Show answerHide answer
Answer: B ✓ official key
Approach: 'Percent less than' uses the compared-to value (Marketing) as base.
Solution:
Marketing = 25%, R&D = 15%.
Difference = 10.
% less = 10/25 × 100 = 40%.
Why the other options are wrong:
A (10%) – the percentage-point difference, not percent.
E (33.33%) – uses a wrong base (10/30).
C (60%) – R&D as % of Marketing.
D (25%) – Marketing's share.
Cetking shortcut: R&D/Marketing = 15/25 = 60% ⇒ 40% less.
Answer: B
Passage / data for this question
Answer the next 5 questions based on the pie chart shown here.
Directions: Answer the questions based on the pie chart provided, which depicts the budget allocation of a startup company for the financial year 2024.
What is the central angle corresponding to the sector for 'Salaries'?
- A108 degrees
- B120 degrees
- C135 degrees
- D126 degrees
- E144 degrees
Show answerHide answer
Answer: D ✓ official key
Approach: Central angle = share % × 360°.
Solution:
Salaries = 35%.
Angle = 0.35 × 360° = 126°.
Why the other options are wrong:
A (108°) – 30%.
B (120°) – one-third.
C (135°) – 37.5%.
E (144°) – 40%.
Cetking shortcut: 1% = 3.6° ⇒ 35 × 3.6 = 126°.
Answer: D
Passage / data for this question
Answer the next 5 questions based on the pie chart shown here.
Directions: Answer the questions based on the pie chart provided, which depicts the budget allocation of a startup company for the financial year 2024.
If the company decides to cut the 'Miscellaneous' budget by half and add that amount to 'R&D', what will be the new percentage share of 'R&D'?
- A18%
- B25%
- C20%
- D22.5%
- E17.5%
Show answerHide answer
Answer: C ✓ official key
Approach: Budget total is unchanged — just move share from one sector to another.
Solution:
Miscellaneous = 10%; half of it = 5%.
This 5% is moved to R&D: 15% + 5% = 20%.
Total stays 100%, so the new R&D share = 20%.
Why the other options are wrong:
E (17.5%) – adds half of half.
A (18%), D (22.5%) – wrong amount moved.
B (25%) – adds the whole 10%.
Cetking shortcut: Transfers inside the same total don't change the base, so add percentages directly.
Answer: C
Passage / data for this question
Answer the next 5 questions based on the pie chart shown here.
Directions: Answer the questions based on the pie chart provided, which depicts the budget allocation of a startup company for the financial year 2024.
What is the ratio of expenditure on 'Marketing' and 'Miscellaneous' together to the expenditure on 'Salaries'?
- A3:5
- B1:1
- C5:7
- D4:5
- E7:5
Show answerHide answer
Answer: B ✓ official key
Approach: Add the two shares and compare with Salaries.
Solution:
Marketing + Miscellaneous = 25% + 10% = 35%.
Salaries = 35%.
Ratio = 35 : 35 = 1 : 1.
Why the other options are wrong:
C (5:7) – Marketing alone to Salaries.
E (7:5) – Salaries to Marketing.
A, D – not supported by the data.
Cetking shortcut: Ratios of amounts = ratios of percentages; no need for the total budget.
Answer: B
Passage / data for this question
Study the Pie Chart and answer the question that follow.
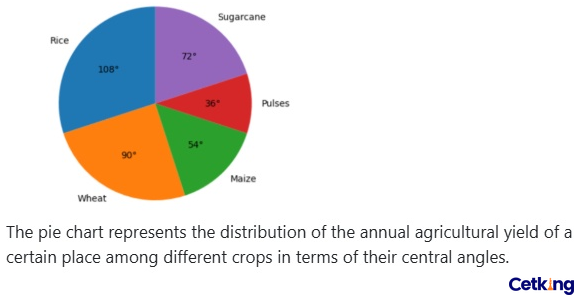
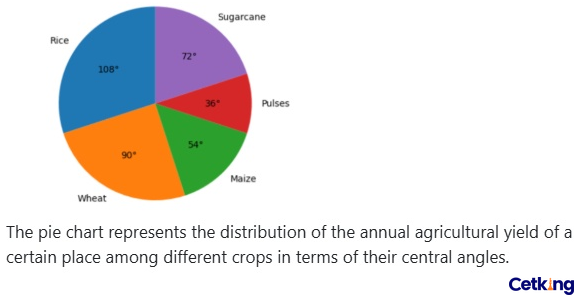
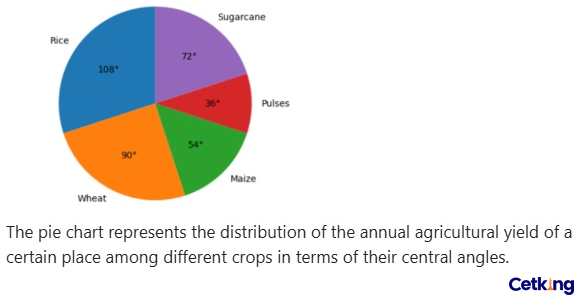
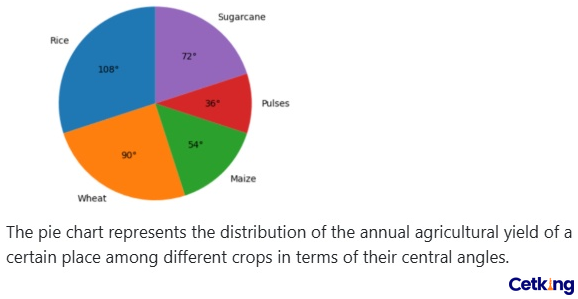
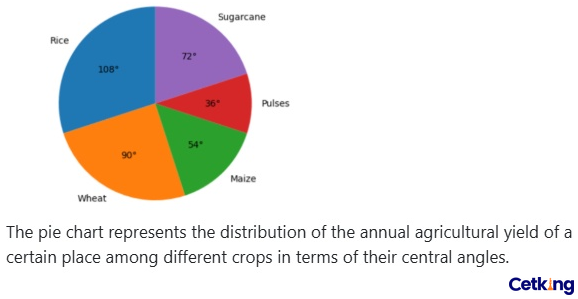
The pie chart represents the distribution of the annual agricultural yield of a certain place among different crops in terms of their central angles.
Data read from chart:
| Crop | Central angle |
|---|
| Rice | 108° |
| Wheat | 90° |
| Maize | 54° |
| Pulses | 36° |
| Sugarcane | 72° |
If the total annual agricultural production is 4800 tonnes, what is the difference between the production of Rice and Wheat?
- A120 tonnes
- B180 tonnes
- C240 tonnes
- D300 tonnes
- E360 tonnes
Show answerHide answer
Answer: C ✓ official key
Approach: Value = (central angle / 360°) × total.
Solution:
Rice − Wheat = 108° − 90° = 18°.
18/360 × 4800 = 4800/20 = 240 tonnes.
Cetking shortcut: Work with the angle difference directly: 1° = 4800/360 = 13.33 t → 18° = 240 t.
Answer: C
Passage / data for this question
Study the Pie Chart and answer the question that follow.
The pie chart represents the distribution of the annual agricultural yield of a certain place among different crops in terms of their central angles.
Data read from chart:
| Crop | Central angle |
|---|
| Rice | 108° |
| Wheat | 90° |
| Maize | 54° |
| Pulses | 36° |
| Sugarcane | 72° |
If the production of Sugarcane is increased by 20%, what will be its new percentage share (approx.) in total production, assuming others remain constant?
- A20%
- B23%
- C25%
- D28 %
- E40 %
Show answerHide answer
Answer: B ✓ official key
Approach: Increase one sector and recompute its share over the NEW total.
Solution:
Sugarcane = 72/360 = 20% of total (take total = 100).
After 20% increase: 20 × 1.2 = 24; new total = 100 + 4 = 104.
New share = 24/104 × 100 ≈ 23.08% ≈ 23%.
Why the other options are wrong:
- A: ignores the increase.
- C: uses a 25% increase and/or forgets the total grows.
- D, E: overstated shares.
Cetking shortcut: If a part p% grows by r%, new share = p(1 + r)/(100 + pr) → 24/104.
Answer: B
Passage / data for this question
Study the Pie Chart and answer the question that follow.
The pie chart represents the distribution of the annual agricultural yield of a certain place among different crops in terms of their central angles.
Data read from chart:
| Crop | Central angle |
|---|
| Rice | 108° |
| Wheat | 90° |
| Maize | 54° |
| Pulses | 36° |
| Sugarcane | 72° |
If Rice production decreases by 10% and Wheat production increases by 10%, which crop will have the highest production?
- ARice
- BWheat
- CSugarcane
- DMaize
- EPulses
Show answerHide answer
Answer: B ✓ official key
Approach: Apply the changes to the sector angles and compare.
Solution:
Rice: 108 × 0.9 = 97.2°.
Wheat: 90 × 1.1 = 99°.
Others unchanged: Sugarcane 72°, Maize 54°, Pulses 36°.
Wheat (99°) is now the highest.
Why the other options are wrong:
- A: Rice drops to 97.2°, below Wheat.
- C, D, E: 72°, 54°, 36° are far below.
Answer: B
Passage / data for this question
Study the Pie Chart and answer the question that follow.
The pie chart represents the distribution of the annual agricultural yield of a certain place among different crops in terms of their central angles.
Data read from chart:
| Crop | Central angle |
|---|
| Rice | 108° |
| Wheat | 90° |
| Maize | 54° |
| Pulses | 36° |
| Sugarcane | 72° |
The production of Rice, Wheat, and Sugarcane together exceeds the production of Maize and Pulses by what ratio?
- A2 : 1
- B3 : 1
- C4 : 1
- D5 : 2
- E7 : 3
Show answerHide answer
Answer: B ✓ official key
Approach: Compare the summed angles of the two groups.
Solution:
Rice + Wheat + Sugarcane = 108 + 90 + 72 = 270°.
Maize + Pulses = 54 + 36 = 90°.
Ratio = 270 : 90 = 3 : 1.
Why the other options are wrong:
- A (2 : 1): ratio of the excess (270 − 90 = 180) to 90 — the question asks for the ratio of the two totals.
- C, D, E: do not match 270 : 90.
Cetking shortcut: The two groups make the whole 360°: 90° vs 270° → 1 : 3 instantly.
Answer: B
Passage / data for this question
Study the Pie Chart and answer the question that follow.
The pie chart represents the distribution of the annual agricultural yield of a certain place among different crops in terms of their central angles.
Data read from chart:
| Crop | Central angle |
|---|
| Rice | 108° |
| Wheat | 90° |
| Maize | 54° |
| Pulses | 36° |
| Sugarcane | 72° |
If the production of Pulses is decreased by 20% and the production of Sugarcane is increased by 20%, while the total production remains unchanged, which of the following will be true?
- APulses will have the lowest production
- BSugarcane will have higher production than Wheat
- CSugarcane will have equal production as Rice
- DPulses will have higher production than Maize
- ERice will lose its top position
Show answerHide answer
Answer: A ✓ official key
Approach: Apply the changes to the angles and test each statement.
Solution:
Pulses: 36 × 0.8 = 28.8°. Sugarcane: 72 × 1.2 = 86.4°.
Others: Rice 108°, Wheat 90°, Maize 54°.
Pulses (28.8°) is still the lowest → A is true.
Why the other options are wrong:
- B: Sugarcane 86.4° < Wheat 90°.
- C: 86.4° ≠ Rice 108°.
- D: Pulses 28.8° < Maize 54°.
- E: Rice 108° remains on top.
Cetking shortcut: Pulses was already the smallest and it only falls — A is true without calculating.
Answer: A
Passage / data for this question
Study the chart carefully and answer the questions that follow.
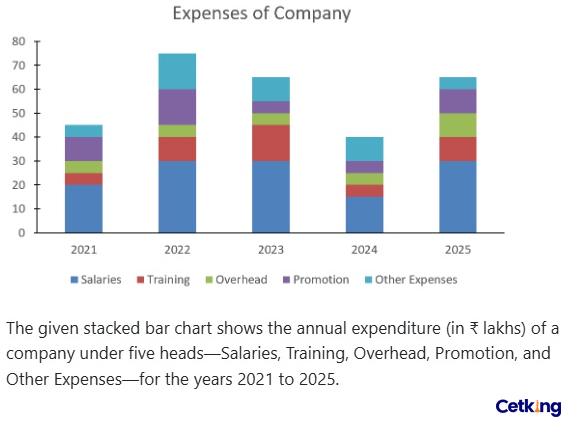
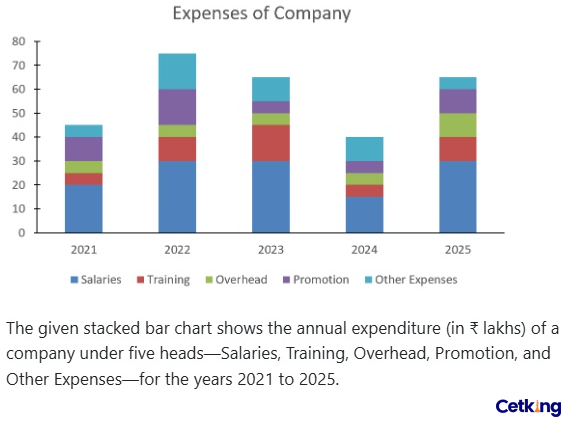
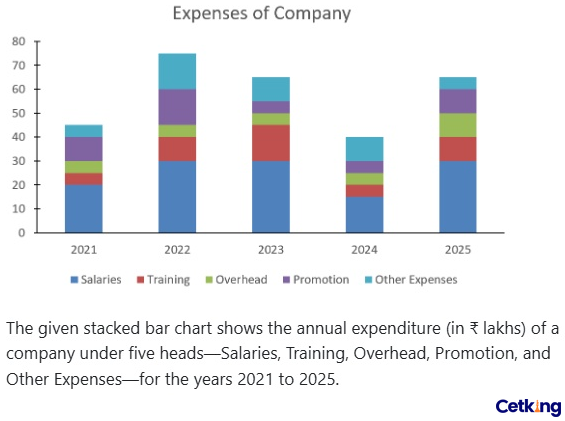
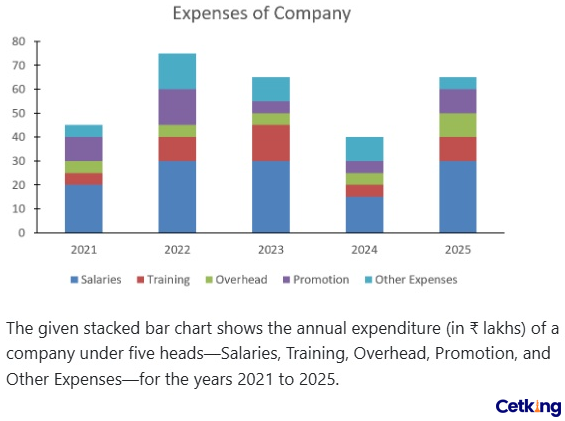
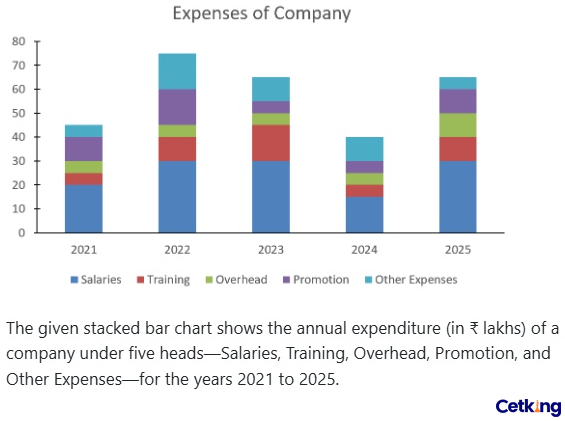
Chart title: Expenses of Company (stacked bar chart; legend: Salaries, Training, Overhead, Promotion, Other Expenses; years 2021 to 2025).
The given stacked bar chart shows the annual expenditure (in ₹ lakhs) of a company under five heads—Salaries, Training, Overhead, Promotion, and Other Expenses—for the years 2021 to 2025.
Data read from chart (₹ lakhs, segment values estimated from stack boundaries):
| Year | Salaries | Training | Overhead | Promotion | Other Expenses | Total |
|---|
| 2021 | 20 | 5 | 5 | 10 | 5 | 45 |
| 2022 | 30 | 10 | 5 | 15 | 15 | 75 |
| 2023 | 30 | 15 | 5 | 5 | 10 | 65 |
| 2024 | 15 | 5 | 5 | 5 | 10 | 40 |
| 2025 | 30 | 10 | 10 | 10 | 5 | 65 |
The average annual expenditure on Training from 2021 to 2025 is approximately what percentage of the average annual Salaries expenditure for the same period?
- A36 %
- B32 %
- C46%
- D50%
- E54%
Show answerHide answer
Answer: A ✓ official key
Approach: Ratio of averages over the same period = ratio of totals.
Solution:
Training: 5 + 10 + 15 + 5 + 10 = 45 → average 9.
Salaries: 20 + 30 + 30 + 15 + 30 = 125 → average 25.
9/25 × 100 = 36%.
Cetking shortcut: Skip averages: 45/125 = 36%.
Answer: A
Passage / data for this question
Study the chart carefully and answer the questions that follow.
Chart title: Expenses of Company (stacked bar chart; legend: Salaries, Training, Overhead, Promotion, Other Expenses; years 2021 to 2025).
The given stacked bar chart shows the annual expenditure (in ₹ lakhs) of a company under five heads—Salaries, Training, Overhead, Promotion, and Other Expenses—for the years 2021 to 2025.
Data read from chart (₹ lakhs, segment values estimated from stack boundaries):
| Year | Salaries | Training | Overhead | Promotion | Other Expenses | Total |
|---|
| 2021 | 20 | 5 | 5 | 10 | 5 | 45 |
| 2022 | 30 | 10 | 5 | 15 | 15 | 75 |
| 2023 | 30 | 15 | 5 | 5 | 10 | 65 |
| 2024 | 15 | 5 | 5 | 5 | 10 | 40 |
| 2025 | 30 | 10 | 10 | 10 | 5 | 65 |
The difference between Salaries and Training expenses was maximum in which year?
- A2022 and 2025
- B2021 and 2024
- C2022 and 2024
- D2021 and 2023
- E2023 and 2025
Show answerHide answer
Answer: A ✓ official key
Approach: Read the Salaries and Training segments for each year and subtract.
Solution:
2021: 20 − 5 = 15; 2022: 30 − 10 = 20; 2023: 30 − 15 = 15; 2024: 15 − 5 = 10; 2025: 30 − 10 = 20.
Maximum difference 20 occurs in 2022 and 2025.
Why the other options are wrong:
- B: 2021 (15), 2024 (10).
- C: 2024 is the minimum.
- D: 15 each.
- E: 2023 gives only 15.
Answer: A
Passage / data for this question
Study the chart carefully and answer the questions that follow.
Chart title: Expenses of Company (stacked bar chart; legend: Salaries, Training, Overhead, Promotion, Other Expenses; years 2021 to 2025).
The given stacked bar chart shows the annual expenditure (in ₹ lakhs) of a company under five heads—Salaries, Training, Overhead, Promotion, and Other Expenses—for the years 2021 to 2025.
Data read from chart (₹ lakhs, segment values estimated from stack boundaries):
| Year | Salaries | Training | Overhead | Promotion | Other Expenses | Total |
|---|
| 2021 | 20 | 5 | 5 | 10 | 5 | 45 |
| 2022 | 30 | 10 | 5 | 15 | 15 | 75 |
| 2023 | 30 | 15 | 5 | 5 | 10 | 65 |
| 2024 | 15 | 5 | 5 | 5 | 10 | 40 |
| 2025 | 30 | 10 | 10 | 10 | 5 | 65 |
Based on the given data, in which year was the total expenditure highest?
- A2021
- B2022
- C2023
- D2024
- E2025
Show answerHide answer
Answer: B ✓ official key
Approach: Total expenditure = height of the full stacked bar.
Solution:
Totals: 2021 = 45, 2022 = 75, 2023 = 65, 2024 = 40, 2025 = 65.
Highest = 2022 (75).
Cetking shortcut: Just compare bar tops — no segment reading needed.
Answer: B
Passage / data for this question
Study the chart carefully and answer the questions that follow.
Chart title: Expenses of Company (stacked bar chart; legend: Salaries, Training, Overhead, Promotion, Other Expenses; years 2021 to 2025).
The given stacked bar chart shows the annual expenditure (in ₹ lakhs) of a company under five heads—Salaries, Training, Overhead, Promotion, and Other Expenses—for the years 2021 to 2025.
Data read from chart (₹ lakhs, segment values estimated from stack boundaries):
| Year | Salaries | Training | Overhead | Promotion | Other Expenses | Total |
|---|
| 2021 | 20 | 5 | 5 | 10 | 5 | 45 |
| 2022 | 30 | 10 | 5 | 15 | 15 | 75 |
| 2023 | 30 | 15 | 5 | 5 | 10 | 65 |
| 2024 | 15 | 5 | 5 | 5 | 10 | 40 |
| 2025 | 30 | 10 | 10 | 10 | 5 | 65 |
The total expenditure on Training is equal to the total expenditure of which of the following years?
- A2023
- B2024
- C2022
- D2021
- E2025
Show answerHide answer
Answer: D ✓ official key
Approach: Sum the Training segments and match with a year's bar total.
Solution:
Training total = 5 + 10 + 15 + 5 + 10 = 45.
Year totals: 2021 = 45, 2022 = 75, 2023 = 65, 2024 = 40, 2025 = 65.
45 matches 2021.
Answer: D
Passage / data for this question
Study the chart carefully and answer the questions that follow.
Chart title: Expenses of Company (stacked bar chart; legend: Salaries, Training, Overhead, Promotion, Other Expenses; years 2021 to 2025).
The given stacked bar chart shows the annual expenditure (in ₹ lakhs) of a company under five heads—Salaries, Training, Overhead, Promotion, and Other Expenses—for the years 2021 to 2025.
Data read from chart (₹ lakhs, segment values estimated from stack boundaries):
| Year | Salaries | Training | Overhead | Promotion | Other Expenses | Total |
|---|
| 2021 | 20 | 5 | 5 | 10 | 5 | 45 |
| 2022 | 30 | 10 | 5 | 15 | 15 | 75 |
| 2023 | 30 | 15 | 5 | 5 | 10 | 65 |
| 2024 | 15 | 5 | 5 | 5 | 10 | 40 |
| 2025 | 30 | 10 | 10 | 10 | 5 | 65 |
Considering only the years in which Training expenditure exceeds Promotion expenditure by at least ₹10 lakhs, what is the total expenditure on Overhead in those years?
- A₹20 lakhs
- B₹30 lakhs
- C₹ 5 lakhs
- D₹10 lakhs
- E₹ 25 lakhs
Show answerHide answer
Answer: C ✓ official key
Approach: Filter the years by the condition, then add Overhead for those years.
Solution:
Training − Promotion: 2021: 5 − 10 = −5; 2022: 10 − 15 = −5; 2023: 15 − 5 = 10; 2024: 5 − 5 = 0; 2025: 10 − 10 = 0.
Only 2023 satisfies 'at least ₹10 lakh'.
Overhead in 2023 = 50 − 45 = ₹5 lakh.
Why the other options are wrong:
- A, B, E: add Overhead of years that fail the condition (e.g. all five years = 30).
- D: misreads the 2023 Overhead segment as 10 (or adds 2025's 10).
Cetking shortcut: Only one bar (2023) has a tall Training and a thin Promotion segment — read just that bar.
Answer: C
Passage / data for this question
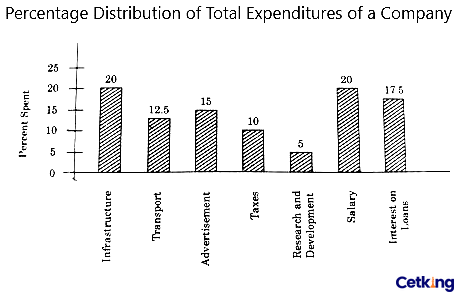
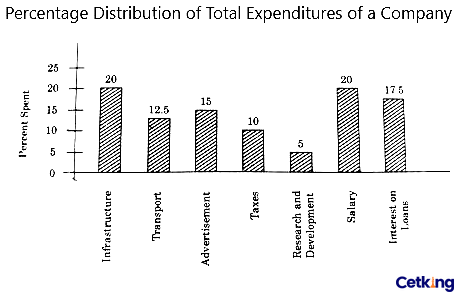
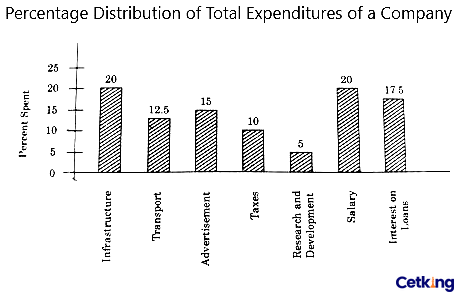
DIRECTIONS for Questions: The bar-graph given below shows the percentage distribution of total expenditures of a company under various expense heads during 2023. Study the graph and answer the questions that follow:
Percentage Distribution of Total Expenditures of a Company
The expenditure on the interest on loans is by what percentage more than the expenditure on transport?
- A5%
- B10%
- C20%
- D30%
- E40%
Show answerHide answer
Answer: E ✓ official key
Approach: Percentage-more formula on the bar values.
Solution: Interest on loans = 17.5%, Transport = 12.5% of total.
Difference = 5.
% more = 5/12.5 × 100 = 40%.
Why the other options are wrong:
A (5%): the percentage-point gap, not % more.
B, C, D: wrong base or misread bars.
Answer: E
Passage / data for this question
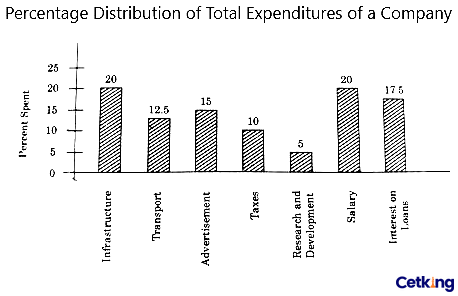
DIRECTIONS for Questions: The bar-graph given below shows the percentage distribution of total expenditures of a company under various expense heads during 2023. Study the graph and answer the questions that follow:
Percentage Distribution of Total Expenditures of a Company
What is the ratio of the total expenditure on infrastructure and transport to the total expenditure on taxes and interest on loans?
- A5:4
- B8:7
- C9:7
- D13:11
- E5:9
Show answerHide answer
Answer: D ✓ official key
Approach: Add the shares, then simplify.
Solution: Infrastructure + Transport = 20 + 12.5 = 32.5.
Taxes + Interest on loans = 10 + 17.5 = 27.5.
Ratio = 32.5 : 27.5 = 65 : 55 = 13 : 11.
Why the other options are wrong:
A, B, C, E: come from misread bars (e.g. 20+15 : 10+17.5 gives 14 : 11, not offered).
Answer: D
Passage / data for this question
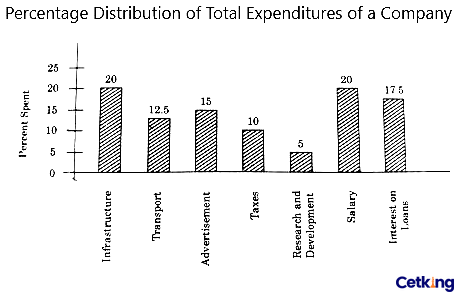
DIRECTIONS for Questions: The bar-graph given below shows the percentage distribution of total expenditures of a company under various expense heads during 2023. Study the graph and answer the questions that follow:
Percentage Distribution of Total Expenditures of a Company
If the expenditure on advertisements is Rs. 2.10 crores, then the difference between the expenditures on transport and taxes is:
- ARs. 1.25 crores
- BRs. 95 lakhs
- CRs. 65 lakhs
- DRs. 35 lakhs
- ERs. 25 lakhs
Show answerHide answer
Answer: D ✓ official key
Approach: Use Advertisement as the scale.
Solution: Advertisement 15% = Rs. 2.10 crore ⇒ 1% = Rs. 0.14 crore.
Transport − Taxes = 12.5 − 10 = 2.5%.
Difference = 2.5 × 0.14 = Rs. 0.35 crore = Rs. 35 lakh.
Why the other options are wrong:
A, B, C, E: misread bars (e.g. transport as 10%) or crore–lakh unit slips.
Cetking shortcut: 2.5% is 1/6 of 15% → 2.10 crore ÷ 6 = 0.35 crore.
Answer: D
Passage / data for this question
DIRECTIONS for Questions: The bar-graph given below shows the percentage distribution of total expenditures of a company under various expense heads during 2023. Study the graph and answer the questions that follow:
Percentage Distribution of Total Expenditures of a Company
The total amount of expenditure of the company is how many times the expenditure on research and development?
- A27
- B20
- C18
- D8
- E5
Show answerHide answer
Answer: B ✓ official key
Approach: Share of total.
Solution: R&D = 5% of total.
Total ÷ R&D = 100 ÷ 5 = 20 times.
Why the other options are wrong:
E (5): the R&D % itself.
A, C, D: misread bars.
Answer: B
Passage / data for this question
DIRECTIONS for Questions: The bar-graph given below shows the percentage distribution of total expenditures of a company under various expense heads during 2023. Study the graph and answer the questions that follow:
Percentage Distribution of Total Expenditures of a Company
If the interest on loans amounted to Rs. 2.45 crores, then the total amount of expenditure on advertisements, taxes and research and development is:
- ARs. 7 crores
- BRs. 5.4 crores
- CRs. 4.2 crores
- DRs. 3 crores
- ERs. 2.4 crores
Show answerHide answer
Answer: C ✓ official key
Approach: Use Interest on loans as the scale.
Solution: Interest on loans 17.5% = Rs. 2.45 crore ⇒ total = 2.45 ÷ 0.175 = Rs. 14 crore.
Advertisement + Taxes + R&D = 15 + 10 + 5 = 30%.
Required = 30% of 14 = Rs. 4.2 crore.
Why the other options are wrong:
A (7 crore): 50% of total.
B, D, E: wrong combined share.
Cetking shortcut: 30/17.5 × 2.45 = 2.45 × 12/7 = 0.35 × 12 = 4.2.
Answer: C
Passage / data for this question
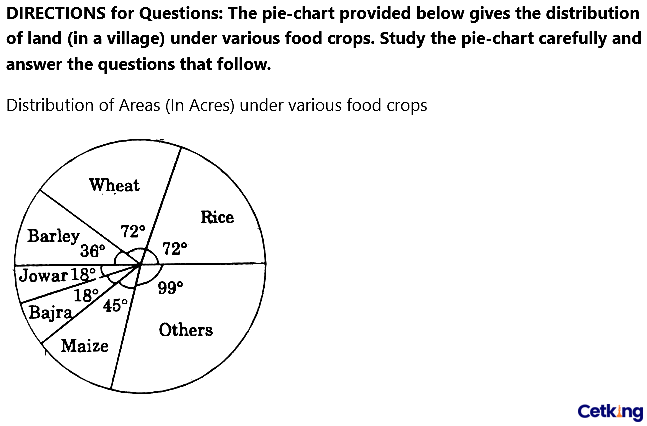
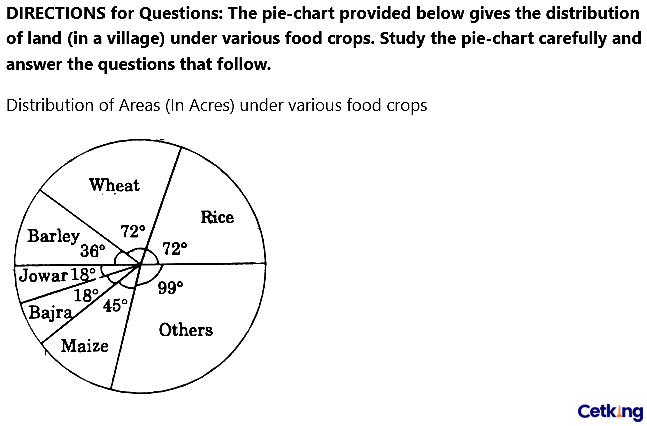
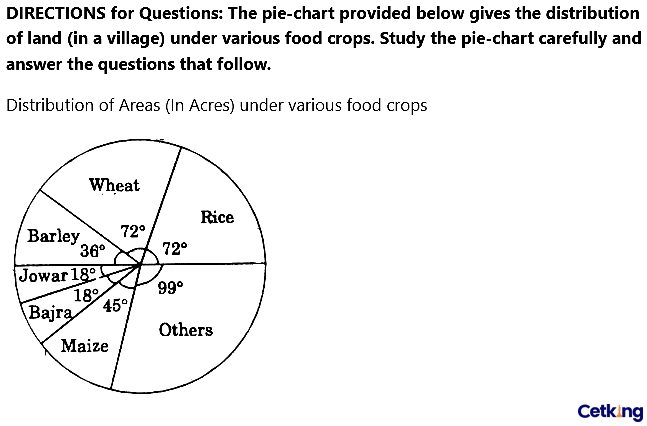
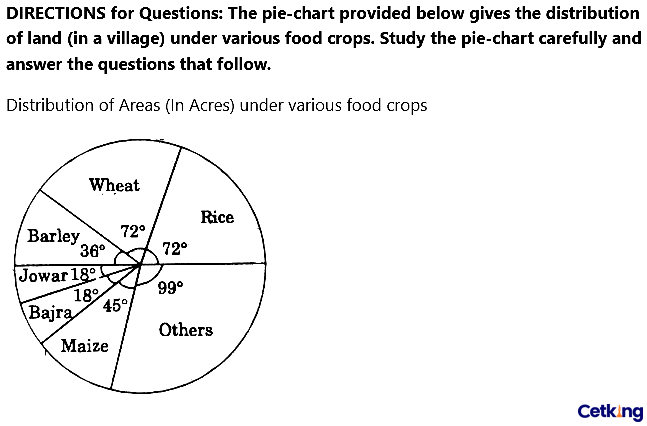
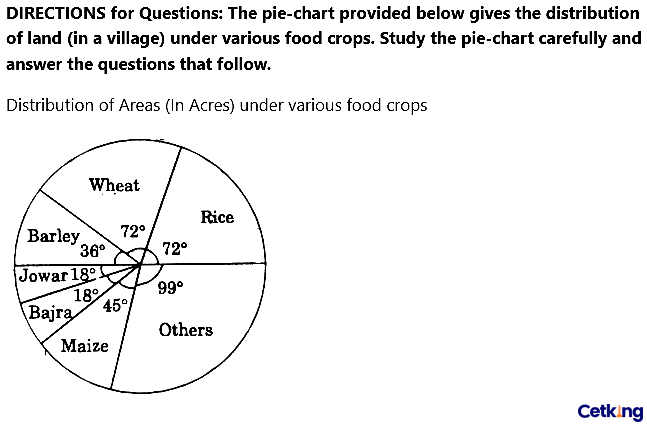
DIRECTIONS for Questions: The pie-chart provided below gives the distribution of land (in a village) under various food crops. Study the pie-chart carefully and answer the questions that follow.
Distribution of Areas (In Acres) under various food crops
Which combination of three crops contributes to 50% of the total area under the food crops?
- AWheat, Barley and Jowar
- BRice, Wheat and Jowar
- CRice, Wheat and Barley
- DBajra , Maize and Rice
- EBarley, Jowar and Rice
Show answerHide answer
Answer: C ✓ official key
Approach: Check which options sum to 180°.
Solution: Rice 72° + Wheat 72° + Barley 36° = 180° = 50%.
Why the other options are wrong:
A: 72 + 36 + 18 = 126°.
B: 72 + 72 + 18 = 162°.
D: 18 + 45 + 72 = 135°.
E: 36 + 18 + 72 = 126°.
Answer: C
Passage / data for this question
DIRECTIONS for Questions: The pie-chart provided below gives the distribution of land (in a village) under various food crops. Study the pie-chart carefully and answer the questions that follow.
Distribution of Areas (In Acres) under various food crops
If the total area under jowar was 1.5 million acres, then what was the area (in million acres) under rice?
- A6
- B7.5
- C9
- D4.5
- E2
Show answerHide answer
Answer: A ✓ official key
Approach: Ratio of angles.
Solution: Rice : Jowar = 72° : 18° = 4 : 1.
Rice area = 4 × 1.5 = 6 million acres.
Why the other options are wrong:
C (9): uses 108°.
B, D, E: wrong angle ratio.
Answer: A
Passage / data for this question
DIRECTIONS for Questions: The pie-chart provided below gives the distribution of land (in a village) under various food crops. Study the pie-chart carefully and answer the questions that follow.
Distribution of Areas (In Acres) under various food crops
If the production of wheat is 6 times that of barley, then what is the ratio between the yield per acre of wheat and barley?
- A3:2
- B3:1
- C12:1
- D2:3
- E3:5
Show answerHide answer
Answer: B ✓ official key
Approach: Yield = production ÷ area.
Solution: Area ratio Wheat : Barley = 72° : 36° = 2 : 1.
Production ratio = 6 : 1.
Yield ratio = (6/2) : (1/1) = 3 : 1.
Why the other options are wrong:
C (12 : 1): multiplies instead of divides.
A, D, E: inverted or wrong ratios.
Answer: B
Passage / data for this question
DIRECTIONS for Questions: The pie-chart provided below gives the distribution of land (in a village) under various food crops. Study the pie-chart carefully and answer the questions that follow.
Distribution of Areas (In Acres) under various food crops
If the yield per acre of rice was 50% more than that of barley, then the production of barley is what percentage of that of rice?
- A30%
- B33.33%
- C35.5%
- D36%
- E50.65%
Show answerHide answer
Answer: B ✓ official key
Approach: Production = area × yield.
Solution: Let Barley yield = 2 units/acre ⇒ Rice yield = 3.
Barley production ∝ 36 × 2 = 72; Rice production ∝ 72 × 3 = 216.
Barley as % of Rice = 72/216 × 100 = 33.33%.
Why the other options are wrong:
E (50.65%): near the 50% you get from areas alone — ignores yield.
A, C, D: arithmetic slips.
Answer: B
Passage / data for this question
DIRECTIONS for Questions: The pie-chart provided below gives the distribution of land (in a village) under various food crops. Study the pie-chart carefully and answer the questions that follow.
Distribution of Areas (In Acres) under various food crops
If the total area goes up by 5%, and the area under wheat production goes up by 12%, then what will be the angle for wheat in the new pie-chart?
- A62.4°
- B76.8°
- C80.6°
- D84.2°
- E12.4°
Show answerHide answer
Answer: B ✓ official key
Approach: Scale the share by relative growth.
Solution: Wheat's old share = 72/360 = 20%.
New share = 20% × 1.12/1.05 = 22.4%/1.05 ≈ 21.33%.
New angle = 72 × 1.12/1.05 = 80.64/1.05 = 76.8°.
Why the other options are wrong:
C (80.6°): ignores the 5% growth in total.
D (84.2°): adds growth instead of dividing.
A, E: wrong direction or nonsense.
Cetking shortcut: 1.12/1.05 = 16/15 → 72 × 16/15 = 76.8°.
Answer: B
Passage / data for this question
Directions: Study the following information carefully and answer the question that follows.
Natasha wants to pursue her B. Tech from ADC University, India, but to be able to afford it, she has to take an education loan. The loan agreement guaranteed to pay 80% of all her expenses. This way she only had to bear the remaining costs. The rent for her new apartment was Rs. 550 per month. She then paid her tuition fee for the current semester worth Rs. 25000. On an average she spent Rs. 340 on utilities and groceries per month. Given that, Natasha's course lasted a total of two years (comprising of 2 semesters per year) and the bank gave 80% of the total expenses of two years at the beginning of her course
How much did the bank have to pay in total for two years on behalf of Natasha?
- ARs. 90308
- BRs. 85428
- CRs. 97088
- DRs. 90288
- ERs. 92286
Show answerHide answer
Answer: C ✓ official key
- Rent for 24 months = 550 x 24 = 13,200.
- Utilities and groceries = 340 x 24 = 8,160.
- Tuition: Rs 25,000 per semester x 4 semesters = 1,00,000.
- Total = 1,21,360. Bank pays 80% = 97,088.
Why not the others:
- (A) 90308: wrong.
- (B) 85428: wrong.
- (D) 90288: wrong.
- (E) 92286: wrong.
Quick check: 121360 x 0.8 = 97088.
Answer: (C)
Passage / data for this question
Directions: Study the following information carefully and answer the question that follows.
Natasha wants to pursue her B. Tech from ADC University, India, but to be able to afford it, she has to take an education loan. The loan agreement guaranteed to pay 80% of all her expenses. This way she only had to bear the remaining costs. The rent for her new apartment was Rs. 550 per month. She then paid her tuition fee for the current semester worth Rs. 25000. On an average she spent Rs. 340 on utilities and groceries per month. Given that, Natasha's course lasted a total of two years (comprising of 2 semesters per year) and the bank gave 80% of the total expenses of two years at the beginning of her course
If the bank charges simple interest at the rate of 9% per annum, then find the total interest amount that Natasha paid after 2 years. (Assume she pays off the entire loan at the end of the course)
- ARs. 17075.84
- BRs. 17005.48
- CRs. 17975.84
- DRs. 16845.48
- ERs. 17475.84
Show answerHide answer
Answer: E ✓ official key
- Loan amount = Rs. 97,088 (from the previous question).
- Simple interest for 2 years at 9% p.a.: SI = 97088 × 9 × 2 / 100.
- SI = 97088 × 0.18 = Rs. 17,475.84.
Why not the others:
- (A) 17075.84: Rs. 400 short of the correct SI.
- (B) 17005.48: wrong digits.
- (C) 17975.84: Rs. 500 more than the correct SI.
- (D) 16845.48: wrong digits.
Quick check: 97088 × 0.18 = 17475.84.
Answer: (E)
Passage / data for this question
Directions: Study the following information carefully and answer the question that follows.
Natasha wants to pursue her B. Tech from ADC University, India, but to be able to afford it, she has to take an education loan. The loan agreement guaranteed to pay 80% of all her expenses. This way she only had to bear the remaining costs. The rent for her new apartment was Rs. 550 per month. She then paid her tuition fee for the current semester worth Rs. 25000. On an average she spent Rs. 340 on utilities and groceries per month. Given that, Natasha's course lasted a total of two years (comprising of 2 semesters per year) and the bank gave 80% of the total expenses of two years at the beginning of her course
The annual expenditure on utilities is what percent less than the annual expenditure on rent?
- A28.15%
- B38.18%
- C37%
- D42.10%
- E40.28%
Show answerHide answer
Answer: B ✓ official key
- Annual rent = 550 x 12 = 6,600. Annual utilities = 340 x 12 = 4,080.
- Percent less = (6600-4080)/6600 x 100 = 38.18%.
Why not the others:
- (A) 28.15%: wrong.
- (C) 37%: wrong.
- (D) 42.10%: wrong.
- (E) 40.28%: wrong.
Quick check: 2520/6600 = 0.3818.
Answer: (B)
Passage / data for this question
Directions: Study the following information carefully and answer the question that follows.
Natasha wants to pursue her B. Tech from ADC University, India, but to be able to afford it, she has to take an education loan. The loan agreement guaranteed to pay 80% of all her expenses. This way she only had to bear the remaining costs. The rent for her new apartment was Rs. 550 per month. She then paid her tuition fee for the current semester worth Rs. 25000. On an average she spent Rs. 340 on utilities and groceries per month. Given that, Natasha's course lasted a total of two years (comprising of 2 semesters per year) and the bank gave 80% of the total expenses of two years at the beginning of her course
Natasha gets an internship for a period of 3 months. The company where she'll be doing internship pays Rs. 12000 per month. The utilities and rent for these 3 months is approximately what percentage of the total amount she will earn from the internship?
- A7.41%
- B5.41%
- C17.41%
- D15.41%
- E12.41%
Show answerHide answer
Answer: A ✓ official key
- Rent + utilities for 3 months = 3 x (550+340) = 2,670.
- Internship earning = 3 x 12,000 = 36,000.
- Percentage = 2670/36000 x 100 = 7.4167% ≈ 7.42%; the closest option is 7.41%.
Why not the others:
- (B) 5.41%: wrong.
- (C) 17.41%: wrong.
- (D) 15.41%: wrong.
- (E) 12.41%: wrong.
Quick check: 36000 x 7.41% = 2667.6, close to 2670.
Answer: (A)
Passage / data for this question
Directions: Study the following information carefully and answer the question that follows.
Natasha wants to pursue her B. Tech from ADC University, India, but to be able to afford it, she has to take an education loan. The loan agreement guaranteed to pay 80% of all her expenses. This way she only had to bear the remaining costs. The rent for her new apartment was Rs. 550 per month. She then paid her tuition fee for the current semester worth Rs. 25000. On an average she spent Rs. 340 on utilities and groceries per month. Given that, Natasha's course lasted a total of two years (comprising of 2 semesters per year) and the bank gave 80% of the total expenses of two years at the beginning of her course
Natasha decides to live with her relatives for 6 months so she will not have to pay for rent and utilities. How much shall she save on rent and utilities if she decides to stay with her relatives for 6 months?
- ARs. 8340
- BRs. 3640
- CRs. 5340
- DRs. 8940
- ERs. 7970
Show answerHide answer
Answer: C ✓ official key
- Monthly rent + utilities = 550 + 340 = 890.
- For 6 months = 890 x 6 = 5,340.
Why not the others:
- (A) 8340: wrong.
- (B) 3640: wrong.
- (D) 8940: wrong.
- (E) 7970: wrong.
Quick check: 890 x 6 = 5340.
Answer: (C)
Passage / data for this question
Study the following Pie Chart carefully and answer the question that follows :
The pie chart given below represents percentage of number of students in five different schools viz. A, B, C, D and E. The total number of students in all the schools is 1,68,000.
Find the ratio of number of girls from each school.
- A1:2:2:4:5
- B3:5:7:9:8
- C4:2:5:2:4
- D1:2:3:2:1
- E5:2:6:7:4
Show answerHide answer
Answer: C ✓ official key
- Students (percent of total): A 28, B 15, C 24, D 18, E 15 (1,68,000 total).
- Girls: A 28 x 3/7 = 12; B 15 x 2/5 = 6; C 24 x 5/8 = 15; D 18 x 1/3 = 6; E 15 x 4/5 = 12.
- Ratio = 12:6:15:6:12 = 4:2:5:2:4.
Why not the others:
- (A) 1:2:2:4:5: wrong.
- (B) 3:5:7:9:8: wrong.
- (D) 1:2:3:2:1: wrong.
- (E) 5:2:6:7:4: wrong.
Quick check: Girls: 20160, 10080, 25200, 10080, 20160; ratio 4:2:5:2:4.
Answer: (C)
Passage / data for this question
Study the following Pie Chart carefully and answer the question that follows :
The pie chart given below represents percentage of number of students in five different schools viz. A, B, C, D and E. The total number of students in all the schools is 1,68,000.
If 14.28% students of school A change their school and go to school D, what will be the percentage change in the number of students of school D.
- A11.11%
- B22.22%
- C33.33%
- D12.18%
- E14.15%
Show answerHide answer
Answer: B ✓ official key
- School A = 28% of 1,68,000 = 47,040; D = 18% = 30,240.
- 14.28% = 1/7 of A = 6,720 move to D.
- D becomes 36,960. Change = 6720/30240 = 22.22%.
Why not the others:
- (A) 11.11%: wrong.
- (C) 33.33%: wrong.
- (D) 12.18%: wrong.
- (E) 14.15%: wrong.
Quick check: 6720/30240 = 2/9 = 22.22%.
Answer: (B)
Passage / data for this question
Study the following Pie Chart carefully and answer the question that follows :
The pie chart given below represents percentage of number of students in five different schools viz. A, B, C, D and E. The total number of students in all the schools is 1,68,000.
What is the ratio of average number of students from School A and D to that of the average number of students from School B, C and E?
- A18 : 23
- B14 : 25
- C23 : 18
- D8 : 9
- E27 : 19
Show answerHide answer
Answer: C ✓ official key
- Average of A and D = (28+18)/2 = 23 (percent units).
- Average of B, C, E = (15+24+15)/3 = 18.
- Ratio = 23:18.
Why not the others:
- (A) 18:23: inverted.
- (B) 14:25: wrong.
- (D) 8:9: wrong.
- (E) 27:19: wrong.
Quick check: Actual: 38640 : 30240 = 23:18.
Answer: (C)
Passage / data for this question
Study the following Pie Chart carefully and answer the question that follows :
The pie chart given below represents percentage of number of students in five different schools viz. A, B, C, D and E. The total number of students in all the schools is 1,68,000.
The number of students in School E is what percentage of the difference between the number of students in School C and School B?
- A156.76%
- B186.67%
- C60%
- D166.67%
- E74%
Show answerHide answer
Answer: D ✓ official key
- E = 15%. C - B = 24% - 15% = 9%.
- E as percent of difference = 15/9 x 100 = 166.67%.
Why not the others:
- (A) 156.76%: wrong.
- (B) 186.67%: wrong.
- (C) 60%: inverted ratio 9/15.
- (E) 74%: wrong.
Quick check: 25200/15120 = 1.6667.
Answer: (D)
Passage / data for this question
Study the following Pie Chart carefully and answer the question that follows :
The pie chart given below represents percentage of number of students in five different schools viz. A, B, C, D and E. The total number of students in all the schools is 1,68,000.
Find the average number of boys in all the schools combined?
- A15784
- B16464
- C17840
- D16465
- E15400
Show answerHide answer
Answer: B ✓ official key
- Boys (percent of total): A 28 x 4/7 = 16; B 15 x 3/5 = 9; C 24 x 3/8 = 9; D 18 x 2/3 = 12; E 15 x 1/5 = 3.
- Total boys = 49% of 1,68,000 = 82,320.
- Average over 5 schools = 82320/5 = 16,464.
Why not the others:
- (A) 15784: wrong.
- (C) 17840: wrong.
- (D) 16465: off by one.
- (E) 15400: wrong.
Quick check: 0.49 x 168000 = 82320; /5 = 16464.
Answer: (B)
Passage / data for this question
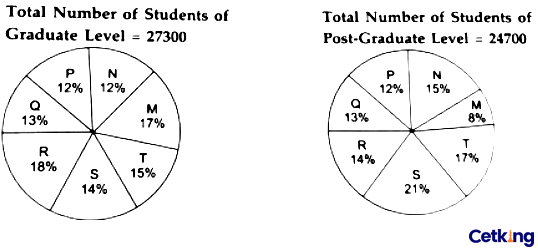
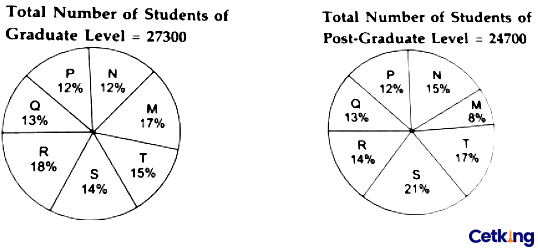
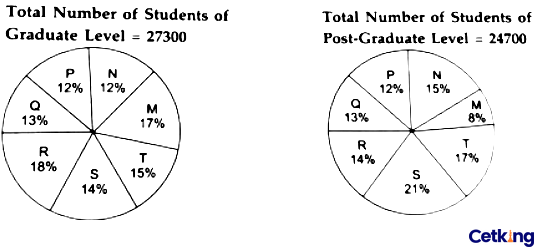
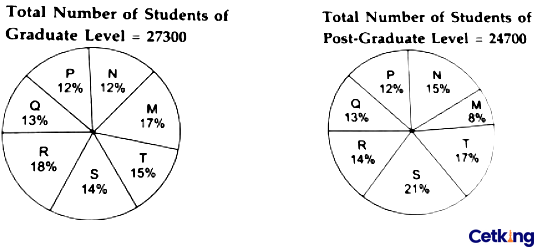
The following pie-charts show the distribution of students of graduate and post-graduate levels in 7 different institutes: M, N, P, Q, R, S, and T in a town. Study the pie-charts carefully and answer the questions given below:
Distribution of students at graduate and post-graduate levels in seven institutes – M, N, P, Q, R, S and T
How many students of institutes M and S are studying at graduate level?
- A7516
- B8463
- C9127
- D9404
- E9900
Show answerHide answer
Answer: B
Approach: Add the shares of M and S in the graduate pie, then take that % of 27,300.
Solution: Graduate pie: M = 17%, S = 14% → 31%.
31% of 27,300 = 0.31 × 27,300 = 8,463.
Cetking shortcut: 1% of 27,300 = 273 → 31 × 273 = 8,463.
Answer: B
Passage / data for this question
The following pie-charts show the distribution of students of graduate and post-graduate levels in 7 different institutes: M, N, P, Q, R, S, and T in a town. Study the pie-charts carefully and answer the questions given below:
Distribution of students at graduate and post-graduate levels in seven institutes – M, N, P, Q, R, S and T
Total number of students studying at post-graduate level from institutes N and P is
- A5601
- B5944
- C6669
- D7004
- E9127
Show answerHide answer
Answer: C
Approach: Add the PG shares of N and P, then take that % of 24,700.
Solution: Post-graduate pie: N = 15%, P = 12% → 27%.
27% of 24,700 = 0.27 × 24,700 = 6,669.
Cetking shortcut: 1% = 247 → 27 × 247 = 6,669.
Answer: C
Passage / data for this question
The following pie-charts show the distribution of students of graduate and post-graduate levels in 7 different institutes: M, N, P, Q, R, S, and T in a town. Study the pie-charts carefully and answer the questions given below:
Distribution of students at graduate and post-graduate levels in seven institutes – M, N, P, Q, R, S and T
What is the total number of graduate and post-graduate level students in institute R?
- A8320
- B7916
- C9116
- D8372
- E7004
Show answerHide answer
Answer: D
Approach: R's graduate count + R's PG count.
Solution: Graduate: 18% of 27,300 = 4,914.
Post-graduate: 14% of 24,700 = 3,458.
Total = 4,914 + 3,458 = 8,372.
Cetking shortcut: Units digits: 18×273 ends in 4, 14×247 ends in 8 → sum ends in 2; only 8,372 ends in 2.
Answer: D
Passage / data for this question
The following pie-charts show the distribution of students of graduate and post-graduate levels in 7 different institutes: M, N, P, Q, R, S, and T in a town. Study the pie-charts carefully and answer the questions given below:
Distribution of students at graduate and post-graduate levels in seven institutes – M, N, P, Q, R, S and T
What is the ratio between the number of students studying at post-graduate and graduate levels respectively from institute S?
- A23:15
- B17:27
- C11:21
- D19:14
- E13:17
Show answerHide answer
Answer: D
Approach: PG(S) : G(S) = (21% × 24,700) : (14% × 27,300).
Solution: PG = 0.21 × 24,700 = 5,187; G = 0.14 × 27,300 = 3,822.
Ratio = (21 × 247) : (14 × 273) = (21 × 13 × 19) : (14 × 3 × 7 × 13) = (21 × 19) : (14 × 21) = 19 : 14.
Cetking shortcut: 247 = 13 × 19 and 273 = 13 × 21 → cancels to 19:14 in one line.
Answer: D
Passage / data for this question
The following line graph gives the % profit earned by 2 companies X and Y during period 2006-11. Study the line graph and answer the questions that are based on it.
% profit earned by Companies X and Y Given Years
If the expenditure of company Y in 2007 was Rs. 220 cr, what was its income in that year?
- A312
- B283
- C297
- D275
- E261
Show answerHide answer
Answer: C
Approach: Income = E × (1 + P/100).
Solution: From the graph, Y's profit % in 2007 = 35%.
Income = 220 × 1.35 = 297 crore.
Answer: C
Passage / data for this question
The following line graph gives the % profit earned by 2 companies X and Y during period 2006-11. Study the line graph and answer the questions that are based on it.
% profit earned by Companies X and Y Given Years
If the Income of 2 companies were equal in 2009, what was the ratio of expenditure of company X to that of company Y in that year?
- A6:5
- B5:6
- C11:6
- D16:15
- E15:16
Show answerHide answer
Answer: D
Approach: E = I ÷ (1 + P/100); incomes equal.
Solution: From the graph, 2009: X = 50%, Y = 60%.
EX = I/1.5, EY = I/1.6.
EX : EY = 1/1.5 : 1/1.6 = 1.6 : 1.5 = 16 : 15.
Why the other options are wrong: 15:16 (E) results from reading X as 60% and Y as 50%; 6:5 / 5:6 ignore the '1 +' in the income formula.
Cetking shortcut: X has the lower profit %, so X must spend more → ratio > 1 → only 6:5, 11:6, 16:15 survive; 160:150 = 16:15.
Answer: D
Passage / data for this question
The following line graph gives the % profit earned by 2 companies X and Y during period 2006-11. Study the line graph and answer the questions that are based on it.
% profit earned by Companies X and Y Given Years
The incomes of the companies X and Y in 2010 were in ratio 3:4 respectively. What was the respective ratio of their expenditure in 2010?
- A15:22
- B14:19
- C7:22
- D27:35
- E33:40
Show answerHide answer
Answer: A
Approach: Divide each income by (1 + profit%).
Solution: From the graph, 2010: X = 65%, Y = 50%.
EX : EY = 3/1.65 : 4/1.5 = (3 × 1.5) : (4 × 1.65) = 4.5 : 6.6 = 45 : 66 = 15 : 22.
Answer: A
Passage / data for this question
Study the chart given carefully and answer the question that follows :
The following table lists the marks of seven students (givenn in rows) of a class across six subjects (given in columns). The Numbers in the brackets indicate the maximum marks of the subject concerned.
| English(150) | Hindi(120) | History(100) | Physics(100) | Maths(100) | Chemistry(100) |
|---|
| Maya | 90 | 50 | 90 | 60 | 70 | 80 |
| Arya | 100 | 80 | 88 | 60 | 80 | 70 |
| Riya | 90 | 72 | 70 | 72 | 91 | 70 |
| Sreya | 85 | 65 | 80 | 80 | 60 | 60 |
| Roopesh | 80 | 55 | 85 | 95 | 50 | 90 |
| Chandesh | 70 | 75 | 65 | 85 | 40 | 61 |
| Hanish | 65 | 35 | 50 | 77 | 80 | 80 |
Who is the topper of the class ?
- AArya
- BSreya
- CChandesh
- DMaya
- ERoopesh
Show answerHide answer
Answer: A
Approach: Add each row (maximum marks are the same for all, so totals compare directly).
Solution:
Maya = 90+50+90+60+70+80 = 440
Arya = 100+80+88+60+80+70 = 478
Riya = 90+72+70+72+91+70 = 465
Sreya = 85+65+80+80+60+60 = 430
Roopesh = 80+55+85+95+50+90 = 455
Chandesh = 70+75+65+85+40+61 = 396
Hanish = 65+35+50+77+80+80 = 387
Highest = Arya (478)
Why the other options are wrong:
B Sreya 430, C Chandesh 396, D Maya 440, E Roopesh 455 — all below Arya's 478.
Cetking shortcut: Total only the five option names (Riya and Hanish are not options); Arya's 478 is the only total above 460.
Answer: A
Passage / data for this question
Study the chart given carefully and answer the question that follows :
The following table lists the marks of seven students (givenn in rows) of a class across six subjects (given in columns). The Numbers in the brackets indicate the maximum marks of the subject concerned.
| English(150) | Hindi(120) | History(100) | Physics(100) | Maths(100) | Chemistry(100) |
|---|
| Maya | 90 | 50 | 90 | 60 | 70 | 80 |
| Arya | 100 | 80 | 88 | 60 | 80 | 70 |
| Riya | 90 | 72 | 70 | 72 | 91 | 70 |
| Sreya | 85 | 65 | 80 | 80 | 60 | 60 |
| Roopesh | 80 | 55 | 85 | 95 | 50 | 90 |
| Chandesh | 70 | 75 | 65 | 85 | 40 | 61 |
| Hanish | 65 | 35 | 50 | 77 | 80 | 80 |
What will be the remainder if you subtract the marks scored by Roopesh from the marks scored by Riya ?
- A32
- B13
- C23
- D8
- E10
Show answerHide answer
Answer: E
Approach: Difference of row totals.
Solution:
Riya total = 465
Roopesh total = 455
Riya − Roopesh = 10
Cetking shortcut: Subject-wise differences (Riya − Roopesh): +10, +17, −15, −23, +41, −20 → sum = 10, no full totals needed.
Answer: E
Passage / data for this question
Study the chart given carefully and answer the question that follows :
The following table lists the marks of seven students (givenn in rows) of a class across six subjects (given in columns). The Numbers in the brackets indicate the maximum marks of the subject concerned.
| English(150) | Hindi(120) | History(100) | Physics(100) | Maths(100) | Chemistry(100) |
|---|
| Maya | 90 | 50 | 90 | 60 | 70 | 80 |
| Arya | 100 | 80 | 88 | 60 | 80 | 70 |
| Riya | 90 | 72 | 70 | 72 | 91 | 70 |
| Sreya | 85 | 65 | 80 | 80 | 60 | 60 |
| Roopesh | 80 | 55 | 85 | 95 | 50 | 90 |
| Chandesh | 70 | 75 | 65 | 85 | 40 | 61 |
| Hanish | 65 | 35 | 50 | 77 | 80 | 80 |
If the maximum marks scored by the students in the Hindi subject were to be upscaled to 200 uniformly by the Examinations Department without affecting their percentages scored currently by each student, then what shall be the difference in the marks scored by Chandesh and Hanish in Hindi ?
- A40
- B80
- C88
- D70
- E66
Show answerHide answer
Answer: E
Approach: Scale the Hindi difference by 200/120 = 5/3.
Solution:
Hindi: Chandesh 75, Hanish 35 (out of 120)
Chandesh = 75 × 5/3 = 125, Hanish = 35 × 5/3 = 58⅓
Difference = 66⅔ marks, listed in the options as 66 (fractional part dropped)
Cetking shortcut: Scale the difference, not each score: 40 × 5/3 = 66⅔ → 66.
Answer: E
The following pie chart lists the details about the per cent production by seven different companies, namely, A, B, C, D, E, F and G. The total production for all companies is 1500 units.
Percentage(%) of Total Production: A 16%, B 11%, C 21%, D 9%, E 26%, F 5%, G 12%.
Further, it is known that
A. Companies A & G are producing more than 500 units ;
B. Companies B & F are producing less than 250 units ;
C. Companies C & E account for 705 units ;
D. Companies D & G are producing less than 200 units ;
E. Companies E, F & G account for 545 units.
Choose which of the following is correct
- AOnly A,D and E are true
- BOnly A and E are true
- COnly C and E are true
- DOnly B and C are true
- EOnly A and D are true
Show answerHide answer
Answer: D
Approach: 1% of 1500 = 15 units; add the percentages of each group and convert.
Solution:
Statement A: A + G = 16% + 12% = 28% = 420 → not more than 500 → false
Statement B: B + F = 11% + 5% = 16% = 240 → less than 250 → true
Statement C: C + E = 21% + 26% = 47% = 705 → true
Statement D: D + G = 9% + 12% = 21% = 315 → not less than 200 → false
Statement E: E + F + G = 26% + 5% + 12% = 43% = 645 ≠ 545 → false
Only B and C are true
Why the other options are wrong:
A, B, E: each includes statement A (420, not more than 500).
C: includes statement E (645, not 545).
Cetking shortcut: Convert thresholds to %: 500 = 33.3%, 250 = 16.7%, 705 = 47%, 200 = 13.3%, 545 = 36.3% — compare percentages directly.
Answer: D
Passage / data for this question
The following table shows the percentage distribution of workforce in India and the ratio of male to female workforce in India in various sectors during a particular year. Further, its known that the total work force in India during the given year was 6000000.
| Employment Sector | Percentage (%) Distribution | Ratio of Male to Female (M:F) |
|---|
| Service (SE) | 15% | 3:2 |
| Sales (SA) | 12% | 5:3 |
| Construction and Maintenance(CM) | 9% | 5:4 |
| Professional (PR) | 18% | 5:7 |
| Management (MA) | 21% | 3:4 |
| Production and Transport(PT) | 19% | 5:3 |
| Others (OT) | 6% | 3:5 |
The number of male workforce in SA and MA sectors put together is, approximately what percent of the total number of workforce in the PT sector ?
- A80%
- B87%
- C85%
- D90%
- E89%
Show answerHide answer
Answer: B
Approach: Work in % of total workforce; the total cancels.
Solution:
SA = 12%, M:F = 5:3 → male = 12 × 5/8 = 7.5%
MA = 21%, M:F = 3:4 → male = 21 × 3/7 = 9%
Male in SA + MA = 16.5%
PT total = 19%
Required % = 16.5/19 × 100 = 86.8% ≈ 87%
Cetking shortcut: Never multiply by 6,000,000 for a percent-of question — 16.5/19 is just under 87%.
Answer: B
Passage / data for this question
The following table shows the percentage distribution of workforce in India and the ratio of male to female workforce in India in various sectors during a particular year. Further, its known that the total work force in India during the given year was 6000000.
| Employment Sector | Percentage (%) Distribution | Ratio of Male to Female (M:F) |
|---|
| Service (SE) | 15% | 3:2 |
| Sales (SA) | 12% | 5:3 |
| Construction and Maintenance(CM) | 9% | 5:4 |
| Professional (PR) | 18% | 5:7 |
| Management (MA) | 21% | 3:4 |
| Production and Transport(PT) | 19% | 5:3 |
| Others (OT) | 6% | 3:5 |
The difference in the number of female workforce in SA and MA sectors put together and the number of female workforce in PT sector is approximately close to how much ?
- A560000
- B510000
- C570000
- D550000
- E1320000
Show answerHide answer
Answer: A
Approach: Female shares in % of total, then convert.
Solution:
SA female = 12% × 3/8 = 4.5%
MA female = 21% × 4/7 = 12%
SA + MA female = 16.5%
PT female = 19% × 3/8 = 7.125%
Difference = 16.5 − 7.125 = 9.375% of 6,000,000 = 5,62,500 ≈ 5,60,000
Why the other options are wrong:
B, C, D: 510000, 570000 and 550000 are all further from 562500.
E (1320000): adds the two groups instead of subtracting.
Cetking shortcut: 1% = 60,000; 9.375 × 60,000 = 5,62,500.
Answer: A
Passage / data for this question
Read the information provided and answer the question that follows :
Given below in the first chart is the percentage distribution of total cars (MUV & SUV) distributed by 8 dealers, namely, A, B, C, D, E, F, G, and H across the country. Similarly, the second chart shows the SUV cars distributed by the same dealers in the year 2023.
Further, it is known that the sum total of SUV and MUV cars sold by all the 8 dealers for the year 2023 is 56000 and the total number of SUV cars sold during the same duration is 32000.
Distribution of Cars (MUV & SUV): A 18%, B 11%, C 14%, D 15%, E 20%, F 8%, G 5%, H 9%.
Distribution of Cars SUV: A 16%, B 16%, C 7%, D 13%, E 22%, F 8%, G 6%, H 12%.
The total number of cars sold by the dealer D is by what percentage more than the total number of SUV cars sold by dealers C, F and G together ?
- A75%
- B50%
- C63%
- D33%
- E25%
Show answerHide answer
Answer: E
Approach: Convert each pie share to units with its own total.
Solution:
Dealer D total cars = 15% of 56000 = 8400
SUVs of C, F, G = (7 + 8 + 6)% = 21% of 32000 = 6720
% more = (8400 − 6720)/6720 × 100 = 1680/6720 × 100 = 25%
Why the other options are wrong:
A, B, C, D: come from applying SUV percentages to 56000, or using the wrong base for 'percentage more'.
Cetking shortcut: 8400/6720 = 1.25 → 25% more.
Answer: E
Passage / data for this question
Read the information provided and answer the question that follows :
Given below in the first chart is the percentage distribution of total cars (MUV & SUV) distributed by 8 dealers, namely, A, B, C, D, E, F, G, and H across the country. Similarly, the second chart shows the SUV cars distributed by the same dealers in the year 2023.
Further, it is known that the sum total of SUV and MUV cars sold by all the 8 dealers for the year 2023 is 56000 and the total number of SUV cars sold during the same duration is 32000.
Distribution of Cars (MUV & SUV): A 18%, B 11%, C 14%, D 15%, E 20%, F 8%, G 5%, H 9%.
Distribution of Cars SUV: A 16%, B 16%, C 7%, D 13%, E 22%, F 8%, G 6%, H 12%.
Determine the ratio between the total number of SUV cars distributed by dealers A and B together and total number of SUV and MUV cars distributed by dealers C and F together ?
- A54:77
- B64:73
- C64:77
- D1:4.33
- E64:79
Show answerHide answer
Answer: C
Approach: Convert to units, then simplify.
Solution:
SUV of A + B = (16 + 16)% of 32000 = 10240
All cars of C + F = (14 + 8)% of 56000 = 12320
Ratio = 10240 : 12320 = 64 : 77 (divide by 160)
Why the other options are wrong:
A (54:77), B (64:73), E (64:79): one term altered.
D (1:4.33): no such relation between the groups.
Cetking shortcut: (32 × 32000) : (22 × 56000) = (32 × 4) : (22 × 7) = 128 : 154 = 64 : 77.
Answer: C
Passage / data for this question
Read the information provided and answer the question that follows :
Given below in the first chart is the percentage distribution of total cars (MUV & SUV) distributed by 8 dealers, namely, A, B, C, D, E, F, G, and H across the country. Similarly, the second chart shows the SUV cars distributed by the same dealers in the year 2023.
Further, it is known that the sum total of SUV and MUV cars sold by all the 8 dealers for the year 2023 is 56000 and the total number of SUV cars sold during the same duration is 32000.
Distribution of Cars (MUV & SUV): A 18%, B 11%, C 14%, D 15%, E 20%, F 8%, G 5%, H 9%.
Distribution of Cars SUV: A 16%, B 16%, C 7%, D 13%, E 22%, F 8%, G 6%, H 12%.
Determine the average number of MUV cars distributed by dealers A, D, E, F and H together ?
- A2892
- B3634
- C3326
- D3296
- E3354
Show answerHide answer
Answer: D
Approach: MUV per dealer = total cars − SUVs, then average.
Solution:
A: 18% × 56000 − 16% × 32000 = 10080 − 5120 = 4960
D: 8400 − 4160 = 4240
E: 11200 − 7040 = 4160
F: 4480 − 2560 = 1920
H: 5040 − 3840 = 1200
Sum = 16480; average = 16480/5 = 3296
Cetking shortcut: Sum directly: total share (18+15+20+8+9)% = 70% × 56000 = 39200; SUV share (16+13+22+8+12)% = 71% × 32000 = 22720; (39200 − 22720)/5 = 3296.
Answer: D