Passage / data for this question
Study the chart and answer the questions:
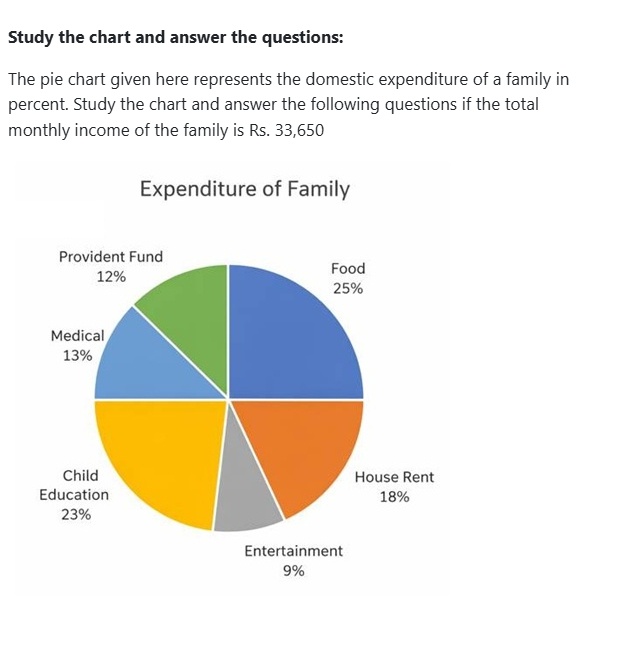
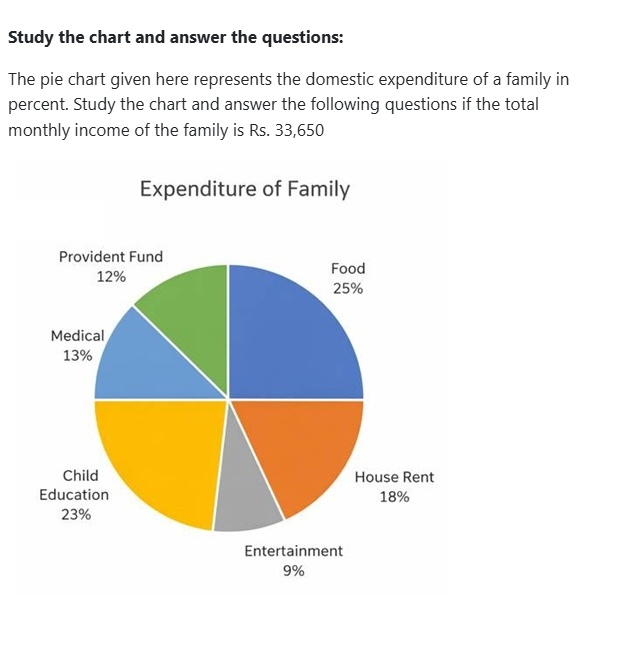
The pie chart given here represents the domestic expenditure of a family in percent. Study the chart and answer the following questions if the total monthly income of the family is Rs. 33,650
Data read from chart (Expenditure of Family):
| Item | Percent |
|---|
| Food | 25% |
| House Rent | 18% |
| Entertainment | 9% |
| Child Education | 23% |
| Medical | 13% |
| Provident Fund | 12% |
- ARs. 6000
- BRs. 6152
- CRs. 6057
- DRs. 6048
- ERs. 7740
Show answerHide answer
Answer: C ✓ official key
Approach: Pie percentage to absolute value.
Solution:
House Rent = 18% of 33,650.
10% = 3,365; 8% = 2,692; total = 6,057.
Cetking shortcut: 1% = 336.5 → 18 × 336.5 = 6,057.
Answer: C
Passage / data for this question
Study the chart and answer the questions:
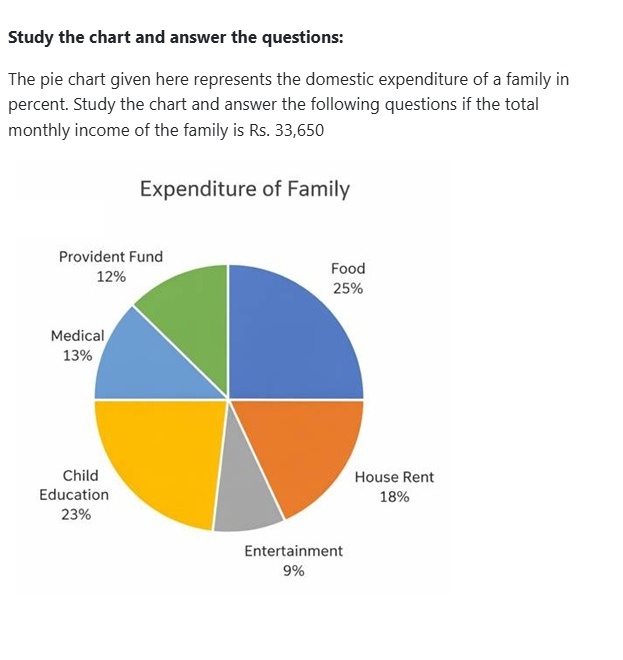
The pie chart given here represents the domestic expenditure of a family in percent. Study the chart and answer the following questions if the total monthly income of the family is Rs. 33,650
Data read from chart (Expenditure of Family):
| Item | Percent |
|---|
| Food | 25% |
| House Rent | 18% |
| Entertainment | 9% |
| Child Education | 23% |
| Medical | 13% |
| Provident Fund | 12% |
Annual Saving in the form of provident funds
- ARs. 48456
- BRs. 48540
- CRs. 44856
- DRs. 45480
- ERs. 46480
Show answerHide answer
Answer: A ✓ official key
Approach: Monthly PF from the pie, then annualise.
Solution:
PF = 12% of 33,650 = 4,038 per month.
Annual = 4,038 × 12 = 48,456.
Why the other options are wrong:
B, D shuffle digits (48,540 / 45,480); C, E are miscalculations.
Cetking shortcut: 12% × 12 months = 144% of monthly income: 1.44 × 33,650 = 48,456.
Answer: A
Passage / data for this question
Study the chart and answer the questions:
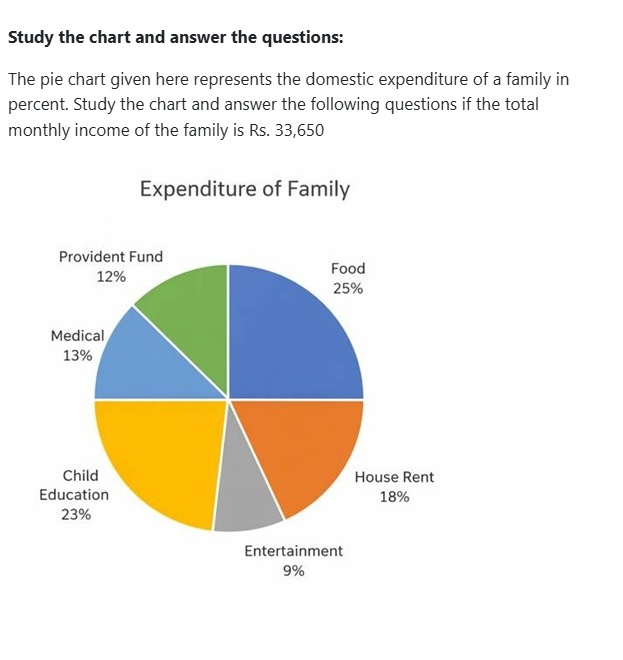
The pie chart given here represents the domestic expenditure of a family in percent. Study the chart and answer the following questions if the total monthly income of the family is Rs. 33,650
Data read from chart (Expenditure of Family):
| Item | Percent |
|---|
| Food | 25% |
| House Rent | 18% |
| Entertainment | 9% |
| Child Education | 23% |
| Medical | 13% |
| Provident Fund | 12% |
After provident fund deduction and payment of house rent,total monthly income of family remains:
- ARs. 23545
- BRs. 24435
- CRs. 23555
- DRs. 25355
- ERs. 26355
Show answerHide answer
Answer: C ✓ official key
Approach: Remaining share = 100% − (Rent + PF).
Solution:
Rent + PF = 18% + 12% = 30%.
Remaining = 70% of 33,650 = 23,555.
Why the other options are wrong:
A (23,545) and B (24,435) are near-miss digit traps; D, E are wrong percentages.
Cetking shortcut: 33,650 − 30% (10,095) = 23,555.
Answer: C
Passage / data for this question
Study the chart and answer the questions:
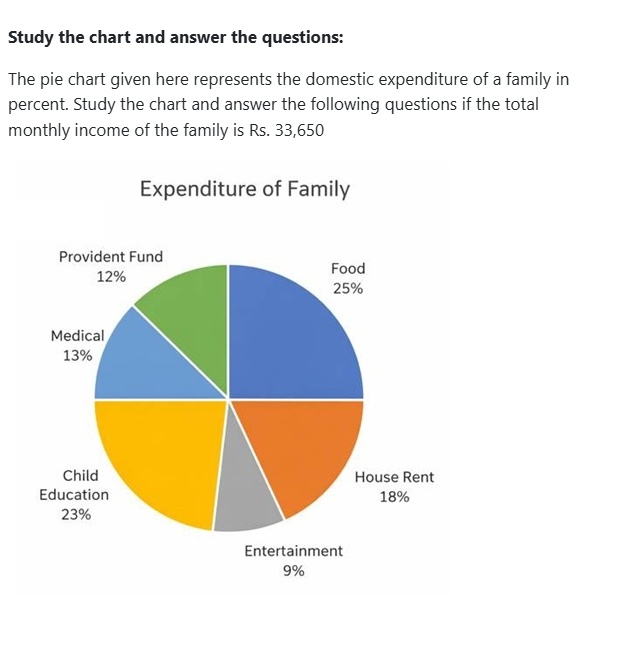
The pie chart given here represents the domestic expenditure of a family in percent. Study the chart and answer the following questions if the total monthly income of the family is Rs. 33,650
Data read from chart (Expenditure of Family):
| Item | Percent |
|---|
| Food | 25% |
| House Rent | 18% |
| Entertainment | 9% |
| Child Education | 23% |
| Medical | 13% |
| Provident Fund | 12% |
Total amount per month,the family spends on food and entertainment combined together is
- ARs. 11432
- BRs. 11441
- CRs. 12315
- DRs. 12443
- ERs. 13443
Show answerHide answer
Answer: B ✓ official key
Approach: Add the two percentages, then convert.
Solution:
Food + Entertainment = 25% + 9% = 34%.
34% of 33,650 = 11,441.
Why the other options are wrong:
A (11,432) is a near-miss; C, D, E use wrong percentages.
Cetking shortcut: 1% = 336.5; × 34 = 11,441.
Answer: B
Passage / data for this question
Study the chart and answer the questions:
The pie chart given here represents the domestic expenditure of a family in percent. Study the chart and answer the following questions if the total monthly income of the family is Rs. 33,650
Data read from chart (Expenditure of Family):
| Item | Percent |
|---|
| Food | 25% |
| House Rent | 18% |
| Entertainment | 9% |
| Child Education | 23% |
| Medical | 13% |
| Provident Fund | 12% |
What is the difference between medical and entertainment expenses?
- A1346
- B1386
- C2019
- D2355
- E3365
Show answerHide answer
Answer: A ✓ official key
Approach: Difference of two pie percentages, then convert.
Solution:
Medical − Entertainment = 13% − 9% = 4%.
4% of 33,650 = 1,346.
Why the other options are wrong:
C (2,019) = 6%; D (2,355) = 7%; E (3,365) = 10%; B is a near-miss.
Cetking shortcut: 1% = 336.5 → × 4 = 1,346.
Answer: A
Passage / data for this question
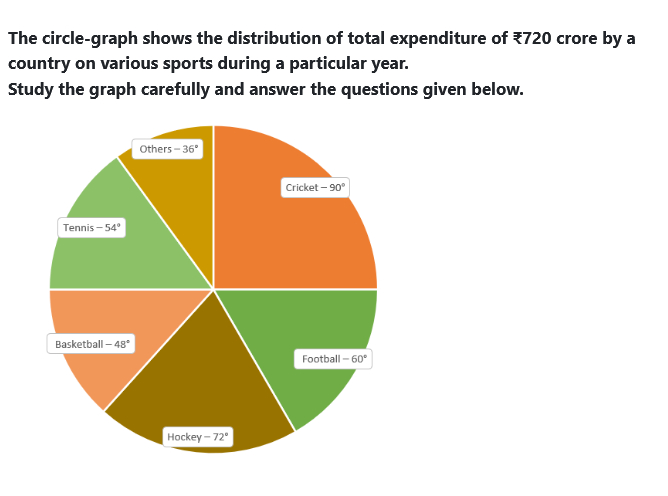
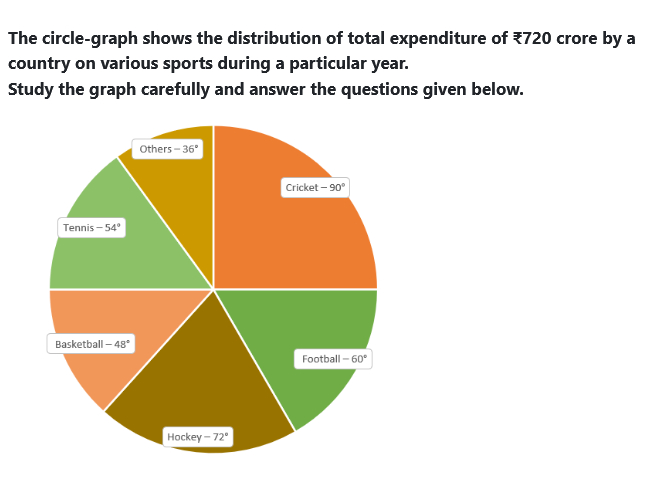
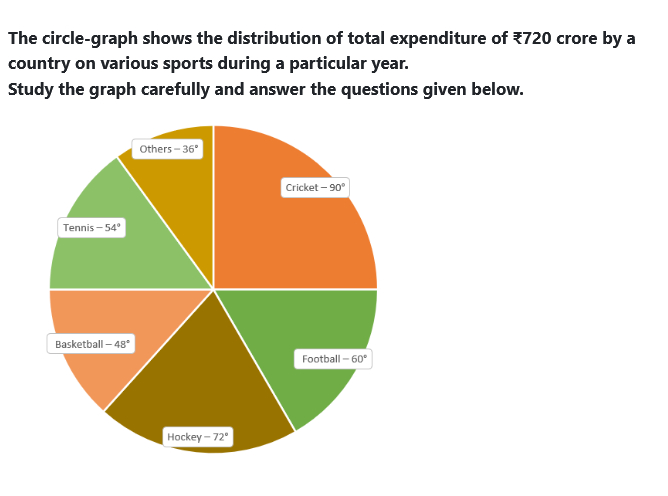
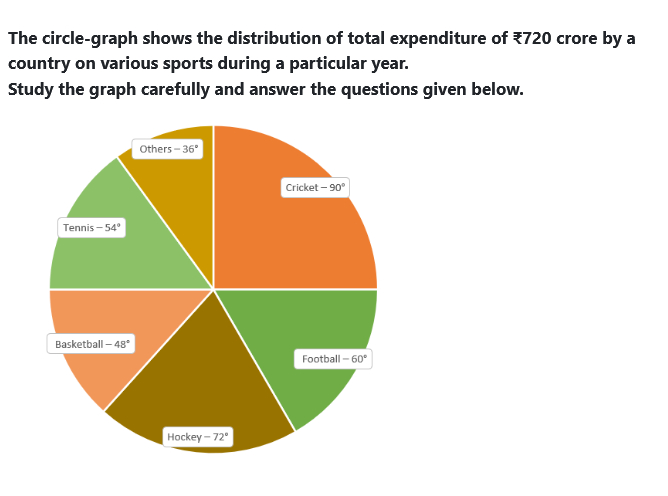
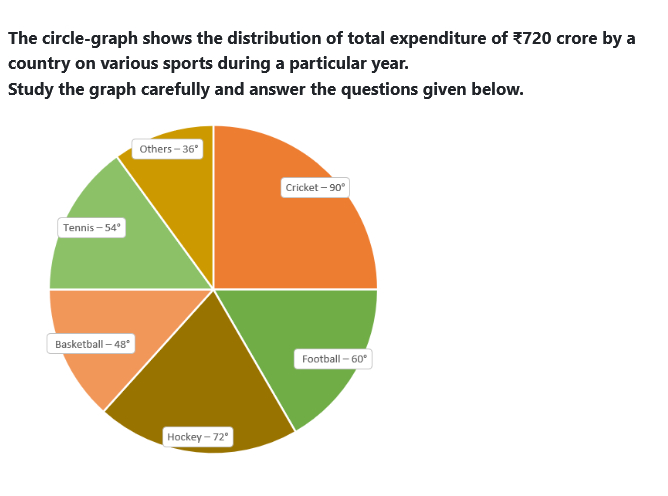
The circle-graph shows the distribution of total expenditure of ₹720 crore by a country on various sports during a particular year.
Study the graph carefully and answer the questions given below.
Data read from chart:
| Sport | Central angle |
|---|
| Cricket | 90° |
| Football | 60° |
| Hockey | 72° |
| Basketball | 48° |
| Tennis | 54° |
| Others | 36° |
What is the expenditure on Cricket?
- A₹150 crore
- B₹162 crore
- C₹180 crore
- D₹200 crore
- E₹216 crore
Show answerHide answer
Answer: C ✓ official key
Approach: Pie chart: value = (angle/360) × total.
Solution:
Total = ₹720 crore → each degree = 720/360 = ₹2 crore.
Cricket = 90° × 2 = ₹180 crore.
Why the other options are wrong:
- A, B, D, E: correspond to 75°, 81°, 100°, 108° — not 90°.
Cetking shortcut: 90° is a quarter of the circle → 720/4 = 180.
Answer: C
Passage / data for this question
The circle-graph shows the distribution of total expenditure of ₹720 crore by a country on various sports during a particular year.
Study the graph carefully and answer the questions given below.
Data read from chart:
| Sport | Central angle |
|---|
| Cricket | 90° |
| Football | 60° |
| Hockey | 72° |
| Basketball | 48° |
| Tennis | 54° |
| Others | 36° |
What is the difference between the average expenditure on Cricket and Football and the expenditure on Hockey?
- A₹4 crore
- B₹5 crore
- C₹6 crore
- D₹7 crore
- E₹10 crore
Show answerHide answer
Answer: C ✓ official key
Approach: Convert each angle to value at ₹2 crore per degree.
Solution:
Cricket = 90 × 2 = 180; Football = 60 × 2 = 120 (₹ crore).
Average of Cricket and Football = (180 + 120)/2 = 150.
Hockey = 72 × 2 = 144.
Difference = 150 − 144 = ₹6 crore.
Why the other options are wrong:
- A, B, D, E: correspond to angle differences of 2°, 2.5°, 3.5°, 5° — the actual difference is 3°.
Cetking shortcut: Work in degrees: average (90 + 60)/2 = 75°, Hockey 72° → 3° × 2 = ₹6 crore.
Answer: C
Passage / data for this question
The circle-graph shows the distribution of total expenditure of ₹720 crore by a country on various sports during a particular year.
Study the graph carefully and answer the questions given below.
Data read from chart:
| Sport | Central angle |
|---|
| Cricket | 90° |
| Football | 60° |
| Hockey | 72° |
| Basketball | 48° |
| Tennis | 54° |
| Others | 36° |
If ₹36 crore is transferred from Cricket to Basketball, what will be the new ratio of expenditure on Cricket to Basketball?
- A11 : 9
- B10 : 9
- C12:11
- D18 : 7
- E7 : 6
Show answerHide answer
Official CET key: C · Cetking's answer: B — see why below
Approach: Find each value, transfer the amount, then reduce the ratio.
Solution:
Cricket = 90 × 2 = ₹180 crore; Basketball = 48 × 2 = ₹96 crore.
After transferring ₹36 crore: Cricket = 180 − 36 = 144; Basketball = 96 + 36 = 132.
Ratio = 144 : 132 = 12 : 11.
Why the other options are wrong:
- B (10 : 9): mis-simplifies 144 : 132.
- A, D, E: wrong base values or transfer in the wrong direction.
Cetking shortcut: In degrees: ₹36 crore = 18°. Cricket 90 − 18 = 72°, Basketball 48 + 18 = 66° → 72 : 66 = 12 : 11.
Answer: C
Passage / data for this question
The circle-graph shows the distribution of total expenditure of ₹720 crore by a country on various sports during a particular year.
Study the graph carefully and answer the questions given below.
Data read from chart:
| Sport | Central angle |
|---|
| Cricket | 90° |
| Football | 60° |
| Hockey | 72° |
| Basketball | 48° |
| Tennis | 54° |
| Others | 36° |
Expenditure on Tennis is what percent less than the combined expenditure on Hockey and Others?
- A20%
- B25%
- C30%
- D50 %
- E55 %
Show answerHide answer
Official CET key: D · Cetking's answer: B — see why below
Approach: Percent less = (difference/larger base) × 100.
Solution:
Tennis = 54 × 2 = ₹108 crore.
Hockey + Others = (72 + 36) × 2 = ₹216 crore.
Tennis is less by (216 − 108)/216 × 100 = 50%.
Why the other options are wrong:
- B (25%): misreads the Tennis/Others values.
- A, C, E: wrong base or arithmetic.
Cetking shortcut: Degrees: 54 vs 72 + 36 = 108 → Tennis is exactly half → 50% less.
Answer: D
Passage / data for this question
The circle-graph shows the distribution of total expenditure of ₹720 crore by a country on various sports during a particular year.
Study the graph carefully and answer the questions given below.
Data read from chart:
| Sport | Central angle |
|---|
| Cricket | 90° |
| Football | 60° |
| Hockey | 72° |
| Basketball | 48° |
| Tennis | 54° |
| Others | 36° |
The expenditure on Cricket is equal to the expenditure on which of the following combinations?
- AFootball + Others
- BHockey + Basketball
- CTennis + Others
- DFootball + Basketball
- EBasketball + Tennis
Show answerHide answer
Official CET key: C · Cetking's answer: D — see why below
Approach: Compare angles directly — equal angles mean equal expenditure.
Solution:
Cricket = 90°.
Tennis + Others = 54° + 36° = 90° ✓ → equal to Cricket (₹180 crore each).
Why the other options are wrong:
- A: Football + Others = 96°.
- B: Hockey + Basketball = 120°.
- D: Football + Basketball = 108°.
- E: Basketball + Tennis = 102°.
Cetking shortcut: No conversion needed — just add the angles of each pair and look for 90°.
Answer: C
Passage / data for this question
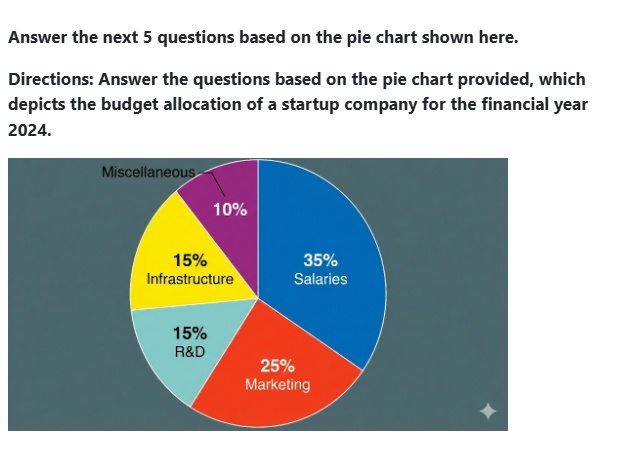
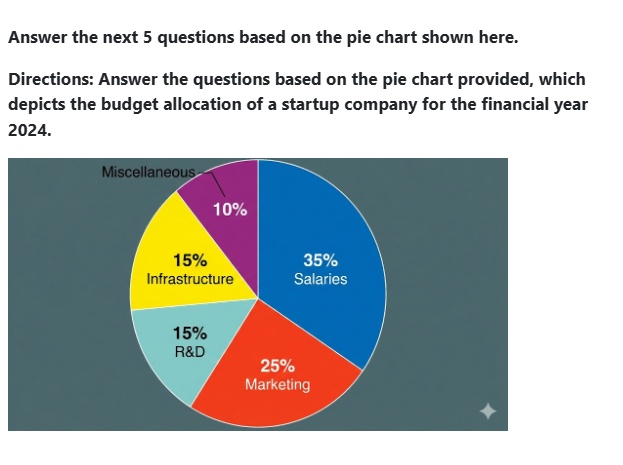
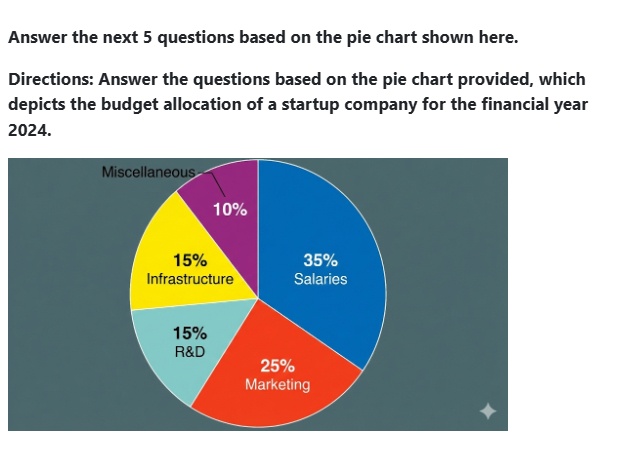
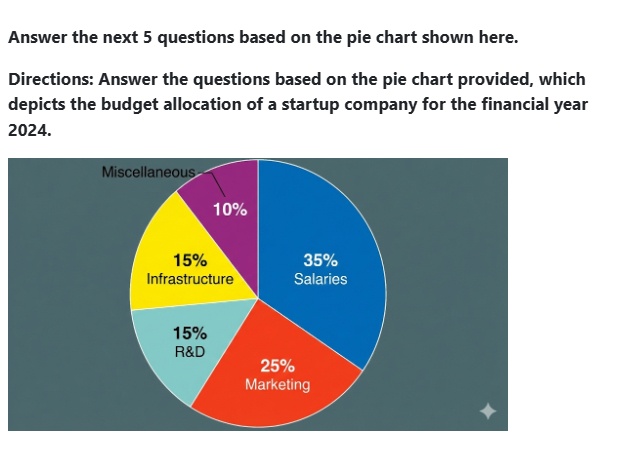
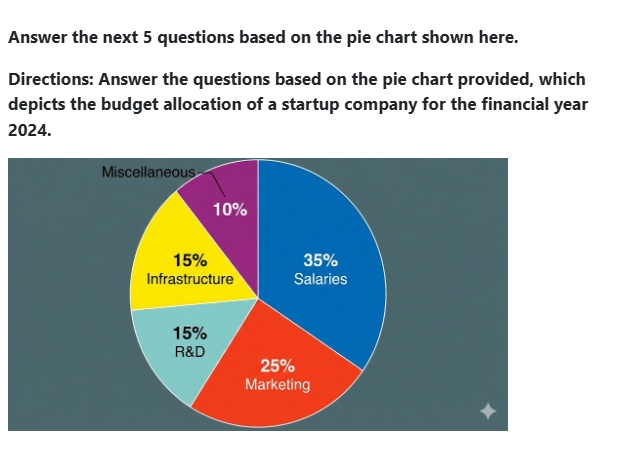
Answer the next 5 questions based on the pie chart shown here.
Directions: Answer the questions based on the pie chart provided, which depicts the budget allocation of a startup company for the financial year 2024.
Data read from chart:
| Category | Share of budget |
|---|
| Salaries | 35% |
| Marketing | 25% |
| R&D | 15% |
| Infrastructure | 15% |
| Miscellaneous | 10% |
If the total budget of the company is Rs. 20 Crores, what is the difference between the amount spent on 'Salaries' and 'Infrastructure'?
- ARs. 3 Crores
- BRs. 4 Crores
- CRs. 5 Crores
- DRs. 2.5 Crores
- ERs. 3.5 Crores
Show answerHide answer
Answer: B ✓ official key
Approach: Convert the percentage difference into an amount.
Solution:
Salaries = 35%, Infrastructure = 15%.
Difference = 20% of the budget.
20% of Rs. 20 crore = Rs. 4 crore.
Why the other options are wrong:
A (3 Cr) – uses 15% difference.
C (5 Cr) – uses Marketing 25%.
D, E – arithmetic slips.
Cetking shortcut: Subtract percentages first, then convert once: 20% × 20 = 4.
Answer: B
Passage / data for this question
Answer the next 5 questions based on the pie chart shown here.
Directions: Answer the questions based on the pie chart provided, which depicts the budget allocation of a startup company for the financial year 2024.
Data read from chart:
| Category | Share of budget |
|---|
| Salaries | 35% |
| Marketing | 25% |
| R&D | 15% |
| Infrastructure | 15% |
| Miscellaneous | 10% |
The expenditure on 'R&D' is what percent less than the expenditure on 'Marketing'?
- A10%
- B40%
- C60%
- D25%
- E33.33%
Show answerHide answer
Answer: B ✓ official key
Approach: 'Percent less than' uses the compared-to value (Marketing) as base.
Solution:
Marketing = 25%, R&D = 15%.
Difference = 10.
% less = 10/25 × 100 = 40%.
Why the other options are wrong:
A (10%) – the percentage-point difference, not percent.
E (33.33%) – uses a wrong base (10/30).
C (60%) – R&D as % of Marketing.
D (25%) – Marketing's share.
Cetking shortcut: R&D/Marketing = 15/25 = 60% ⇒ 40% less.
Answer: B
Passage / data for this question
Answer the next 5 questions based on the pie chart shown here.
Directions: Answer the questions based on the pie chart provided, which depicts the budget allocation of a startup company for the financial year 2024.
Data read from chart:
| Category | Share of budget |
|---|
| Salaries | 35% |
| Marketing | 25% |
| R&D | 15% |
| Infrastructure | 15% |
| Miscellaneous | 10% |
What is the central angle corresponding to the sector for 'Salaries'?
- A108 degrees
- B120 degrees
- C135 degrees
- D126 degrees
- E144 degrees
Show answerHide answer
Answer: D ✓ official key
Approach: Central angle = share % × 360°.
Solution:
Salaries = 35%.
Angle = 0.35 × 360° = 126°.
Why the other options are wrong:
A (108°) – 30%.
B (120°) – one-third.
C (135°) – 37.5%.
E (144°) – 40%.
Cetking shortcut: 1% = 3.6° ⇒ 35 × 3.6 = 126°.
Answer: D
Passage / data for this question
Answer the next 5 questions based on the pie chart shown here.
Directions: Answer the questions based on the pie chart provided, which depicts the budget allocation of a startup company for the financial year 2024.
Data read from chart:
| Category | Share of budget |
|---|
| Salaries | 35% |
| Marketing | 25% |
| R&D | 15% |
| Infrastructure | 15% |
| Miscellaneous | 10% |
If the company decides to cut the 'Miscellaneous' budget by half and add that amount to 'R&D', what will be the new percentage share of 'R&D'?
- A18%
- B25%
- C20%
- D22.5%
- E17.5%
Show answerHide answer
Answer: C ✓ official key
Approach: Budget total is unchanged — just move share from one sector to another.
Solution:
Miscellaneous = 10%; half of it = 5%.
This 5% is moved to R&D: 15% + 5% = 20%.
Total stays 100%, so the new R&D share = 20%.
Why the other options are wrong:
E (17.5%) – adds half of half.
A (18%), D (22.5%) – wrong amount moved.
B (25%) – adds the whole 10%.
Cetking shortcut: Transfers inside the same total don't change the base, so add percentages directly.
Answer: C
Passage / data for this question
Answer the next 5 questions based on the pie chart shown here.
Directions: Answer the questions based on the pie chart provided, which depicts the budget allocation of a startup company for the financial year 2024.
Data read from chart:
| Category | Share of budget |
|---|
| Salaries | 35% |
| Marketing | 25% |
| R&D | 15% |
| Infrastructure | 15% |
| Miscellaneous | 10% |
What is the ratio of expenditure on 'Marketing' and 'Miscellaneous' together to the expenditure on 'Salaries'?
- A3:5
- B1:1
- C5:7
- D4:5
- E7:5
Show answerHide answer
Answer: B ✓ official key
Approach: Add the two shares and compare with Salaries.
Solution:
Marketing + Miscellaneous = 25% + 10% = 35%.
Salaries = 35%.
Ratio = 35 : 35 = 1 : 1.
Why the other options are wrong:
C (5:7) – Marketing alone to Salaries.
E (7:5) – Salaries to Marketing.
A, D – not supported by the data.
Cetking shortcut: Ratios of amounts = ratios of percentages; no need for the total budget.
Answer: B
Passage / data for this question
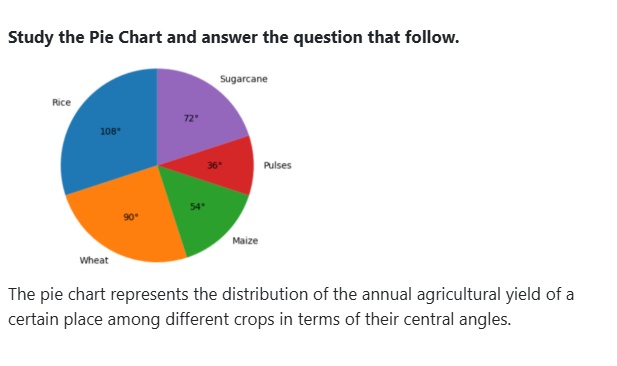
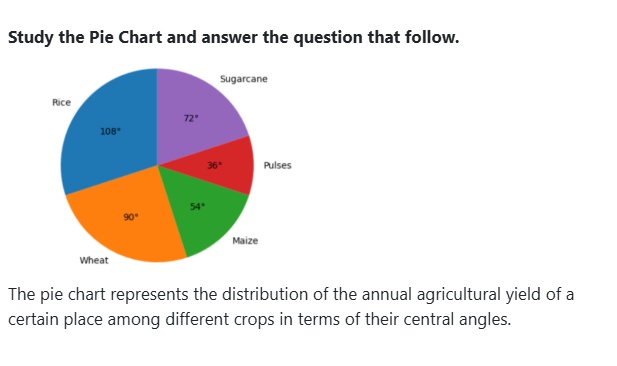
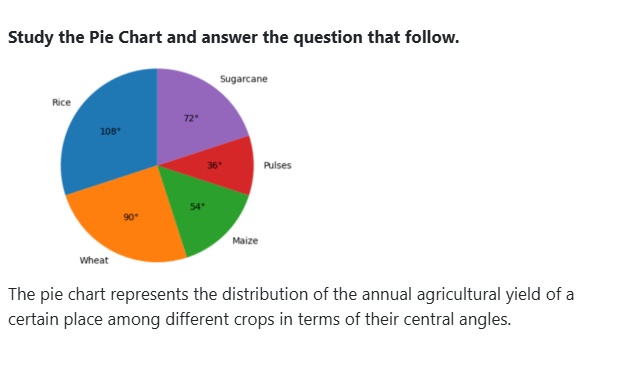
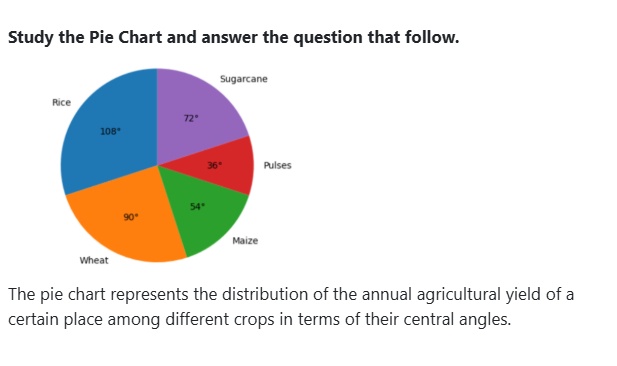
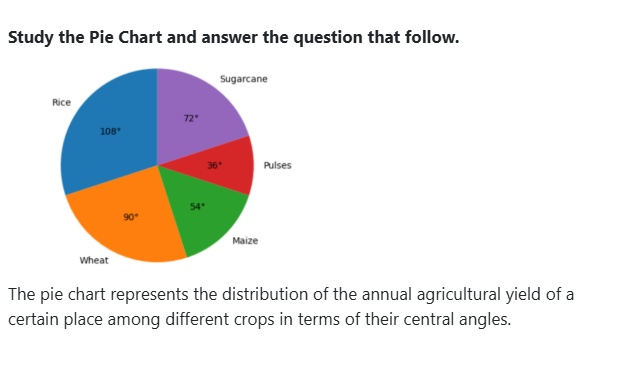
Study the Pie Chart and answer the question that follow.
The pie chart represents the distribution of the annual agricultural yield of a certain place among different crops in terms of their central angles.
Data read from chart:
| Crop | Central angle |
|---|
| Rice | 108° |
| Wheat | 90° |
| Maize | 54° |
| Pulses | 36° |
| Sugarcane | 72° |
If the total annual agricultural production is 4800 tonnes, what is the difference between the production of Rice and Wheat?
- A120 tonnes
- B180 tonnes
- C240 tonnes
- D300 tonnes
- E360 tonnes
Show answerHide answer
Answer: C ✓ official key
Approach: Value = (central angle / 360°) × total.
Solution:
Rice − Wheat = 108° − 90° = 18°.
18/360 × 4800 = 4800/20 = 240 tonnes.
Cetking shortcut: Work with the angle difference directly: 1° = 4800/360 = 13.33 t → 18° = 240 t.
Answer: C
Passage / data for this question
Study the Pie Chart and answer the question that follow.
The pie chart represents the distribution of the annual agricultural yield of a certain place among different crops in terms of their central angles.
Data read from chart:
| Crop | Central angle |
|---|
| Rice | 108° |
| Wheat | 90° |
| Maize | 54° |
| Pulses | 36° |
| Sugarcane | 72° |
If the production of Sugarcane is increased by 20%, what will be its new percentage share (approx.) in total production, assuming others remain constant?
- A20%
- B23%
- C25%
- D28 %
- E40 %
Show answerHide answer
Answer: B ✓ official key
Approach: Increase one sector and recompute its share over the NEW total.
Solution:
Sugarcane = 72/360 = 20% of total (take total = 100).
After 20% increase: 20 × 1.2 = 24; new total = 100 + 4 = 104.
New share = 24/104 × 100 ≈ 23.08% ≈ 23%.
Why the other options are wrong:
- A: ignores the increase.
- C: uses a 25% increase and/or forgets the total grows.
- D, E: overstated shares.
Cetking shortcut: If a part p% grows by r%, new share = p(1 + r)/(100 + pr) → 24/104.
Answer: B
Passage / data for this question
Study the Pie Chart and answer the question that follow.
The pie chart represents the distribution of the annual agricultural yield of a certain place among different crops in terms of their central angles.
Data read from chart:
| Crop | Central angle |
|---|
| Rice | 108° |
| Wheat | 90° |
| Maize | 54° |
| Pulses | 36° |
| Sugarcane | 72° |
If Rice production decreases by 10% and Wheat production increases by 10%, which crop will have the highest production?
- ARice
- BWheat
- CSugarcane
- DMaize
- EPulses
Show answerHide answer
Answer: B ✓ official key
Approach: Apply the changes to the sector angles and compare.
Solution:
Rice: 108 × 0.9 = 97.2°.
Wheat: 90 × 1.1 = 99°.
Others unchanged: Sugarcane 72°, Maize 54°, Pulses 36°.
Wheat (99°) is now the highest.
Why the other options are wrong:
- A: Rice drops to 97.2°, below Wheat.
- C, D, E: 72°, 54°, 36° are far below.
Answer: B
Passage / data for this question
Study the Pie Chart and answer the question that follow.
The pie chart represents the distribution of the annual agricultural yield of a certain place among different crops in terms of their central angles.
Data read from chart:
| Crop | Central angle |
|---|
| Rice | 108° |
| Wheat | 90° |
| Maize | 54° |
| Pulses | 36° |
| Sugarcane | 72° |
The production of Rice, Wheat, and Sugarcane together exceeds the production of Maize and Pulses by what ratio?
- A2 : 1
- B3 : 1
- C4 : 1
- D5 : 2
- E7 : 3
Show answerHide answer
Answer: B ✓ official key
Approach: Compare the summed angles of the two groups.
Solution:
Rice + Wheat + Sugarcane = 108 + 90 + 72 = 270°.
Maize + Pulses = 54 + 36 = 90°.
Ratio = 270 : 90 = 3 : 1.
Why the other options are wrong:
- A (2 : 1): ratio of the excess (270 − 90 = 180) to 90 — the question asks for the ratio of the two totals.
- C, D, E: do not match 270 : 90.
Cetking shortcut: The two groups make the whole 360°: 90° vs 270° → 1 : 3 instantly.
Answer: B
Passage / data for this question
Study the Pie Chart and answer the question that follow.
The pie chart represents the distribution of the annual agricultural yield of a certain place among different crops in terms of their central angles.
Data read from chart:
| Crop | Central angle |
|---|
| Rice | 108° |
| Wheat | 90° |
| Maize | 54° |
| Pulses | 36° |
| Sugarcane | 72° |
If the production of Pulses is decreased by 20% and the production of Sugarcane is increased by 20%, while the total production remains unchanged, which of the following will be true?
- APulses will have the lowest production
- BSugarcane will have higher production than Wheat
- CSugarcane will have equal production as Rice
- DPulses will have higher production than Maize
- ERice will lose its top position
Show answerHide answer
Answer: A ✓ official key
Approach: Apply the changes to the angles and test each statement.
Solution:
Pulses: 36 × 0.8 = 28.8°. Sugarcane: 72 × 1.2 = 86.4°.
Others: Rice 108°, Wheat 90°, Maize 54°.
Pulses (28.8°) is still the lowest → A is true.
Why the other options are wrong:
- B: Sugarcane 86.4° < Wheat 90°.
- C: 86.4° ≠ Rice 108°.
- D: Pulses 28.8° < Maize 54°.
- E: Rice 108° remains on top.
Cetking shortcut: Pulses was already the smallest and it only falls — A is true without calculating.
Answer: A
Passage / data for this question
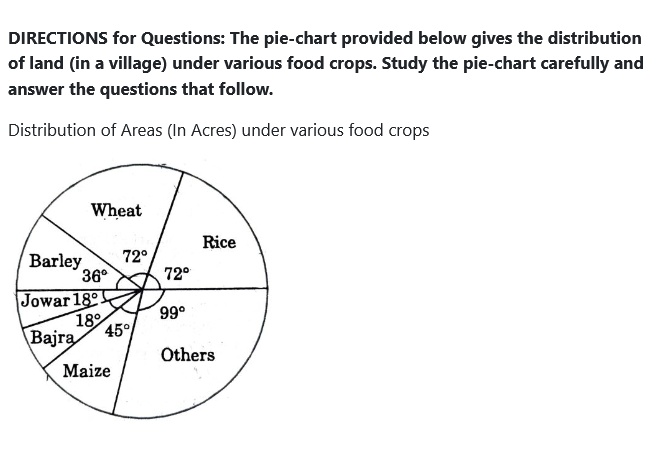
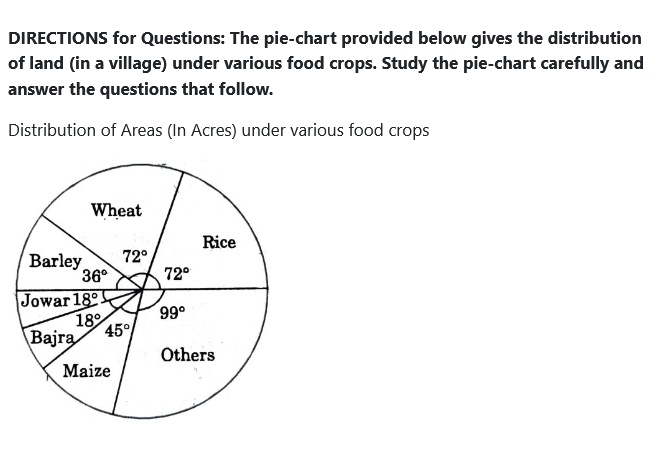
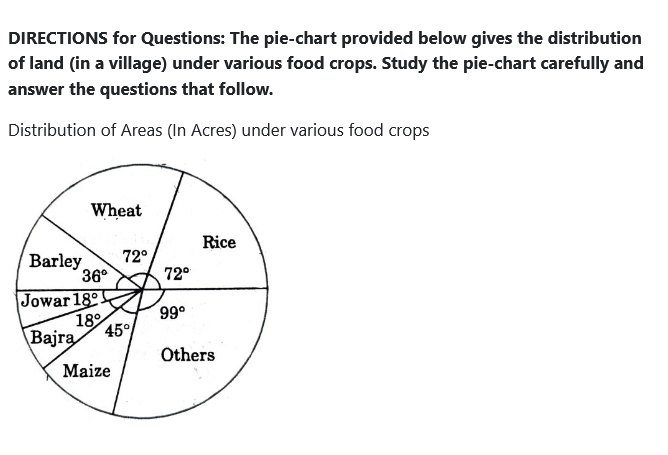
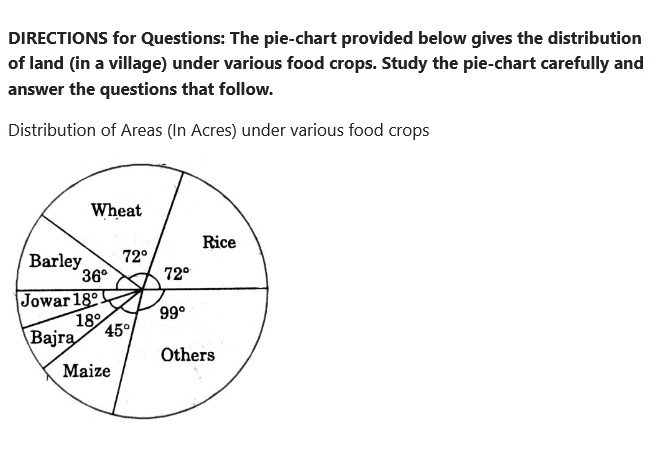
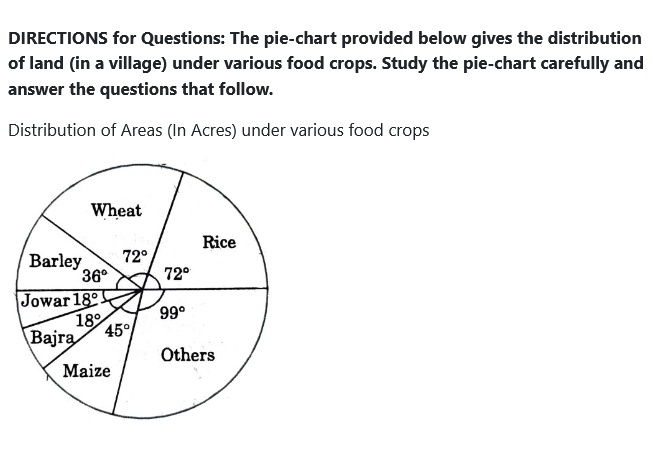
DIRECTIONS for Questions: The pie-chart provided below gives the distribution of land (in a village) under various food crops. Study the pie-chart carefully and answer the questions that follow.
Distribution of Areas (In Acres) under various food crops
Data read from chart (central angles):
| Crop | Angle |
|---|
| Wheat | 72° |
| Rice | 72° |
| Others | 99° |
| Maize | 45° |
| Bajra | 18° |
| Jowar | 18° |
| Barley | 36° |
Which combination of three crops contributes to 50% of the total area under the food crops?
- AWheat, Barley and Jowar
- BRice, Wheat and Jowar
- CRice, Wheat and Barley
- DBajra , Maize and Rice
- EBarley, Jowar and Rice
Show answerHide answer
Answer: C ✓ official key
Approach: Check which options sum to 180°.
Solution: Rice 72° + Wheat 72° + Barley 36° = 180° = 50%.
Why the other options are wrong:
A: 72 + 36 + 18 = 126°.
B: 72 + 72 + 18 = 162°.
D: 18 + 45 + 72 = 135°.
E: 36 + 18 + 72 = 126°.
Answer: C
Passage / data for this question
DIRECTIONS for Questions: The pie-chart provided below gives the distribution of land (in a village) under various food crops. Study the pie-chart carefully and answer the questions that follow.
Distribution of Areas (In Acres) under various food crops
Data read from chart (central angles):
| Crop | Angle |
|---|
| Wheat | 72° |
| Rice | 72° |
| Others | 99° |
| Maize | 45° |
| Bajra | 18° |
| Jowar | 18° |
| Barley | 36° |
If the total area under jowar was 1.5 million acres, then what was the area (in million acres) under rice?
- A6
- B7.5
- C9
- D4.5
- E2
Show answerHide answer
Answer: A ✓ official key
Approach: Ratio of angles.
Solution: Rice : Jowar = 72° : 18° = 4 : 1.
Rice area = 4 × 1.5 = 6 million acres.
Why the other options are wrong:
C (9): uses 108°.
B, D, E: wrong angle ratio.
Answer: A
Passage / data for this question
DIRECTIONS for Questions: The pie-chart provided below gives the distribution of land (in a village) under various food crops. Study the pie-chart carefully and answer the questions that follow.
Distribution of Areas (In Acres) under various food crops
Data read from chart (central angles):
| Crop | Angle |
|---|
| Wheat | 72° |
| Rice | 72° |
| Others | 99° |
| Maize | 45° |
| Bajra | 18° |
| Jowar | 18° |
| Barley | 36° |
If the production of wheat is 6 times that of barley, then what is the ratio between the yield per acre of wheat and barley?
- A3:2
- B3:1
- C12:1
- D2:3
- E3:5
Show answerHide answer
Answer: B ✓ official key
Approach: Yield = production ÷ area.
Solution: Area ratio Wheat : Barley = 72° : 36° = 2 : 1.
Production ratio = 6 : 1.
Yield ratio = (6/2) : (1/1) = 3 : 1.
Why the other options are wrong:
C (12 : 1): multiplies instead of divides.
A, D, E: inverted or wrong ratios.
Answer: B
Passage / data for this question
DIRECTIONS for Questions: The pie-chart provided below gives the distribution of land (in a village) under various food crops. Study the pie-chart carefully and answer the questions that follow.
Distribution of Areas (In Acres) under various food crops
Data read from chart (central angles):
| Crop | Angle |
|---|
| Wheat | 72° |
| Rice | 72° |
| Others | 99° |
| Maize | 45° |
| Bajra | 18° |
| Jowar | 18° |
| Barley | 36° |
If the yield per acre of rice was 50% more than that of barley, then the production of barley is what percentage of that of rice?
- A30%
- B33.33%
- C35.5%
- D36%
- E50.65%
Show answerHide answer
Answer: B ✓ official key
Approach: Production = area × yield.
Solution: Let Barley yield = 2 units/acre ⇒ Rice yield = 3.
Barley production ∝ 36 × 2 = 72; Rice production ∝ 72 × 3 = 216.
Barley as % of Rice = 72/216 × 100 = 33.33%.
Why the other options are wrong:
E (50.65%): near the 50% you get from areas alone — ignores yield.
A, C, D: arithmetic slips.
Answer: B
Passage / data for this question
DIRECTIONS for Questions: The pie-chart provided below gives the distribution of land (in a village) under various food crops. Study the pie-chart carefully and answer the questions that follow.
Distribution of Areas (In Acres) under various food crops
Data read from chart (central angles):
| Crop | Angle |
|---|
| Wheat | 72° |
| Rice | 72° |
| Others | 99° |
| Maize | 45° |
| Bajra | 18° |
| Jowar | 18° |
| Barley | 36° |
If the total area goes up by 5%, and the area under wheat production goes up by 12%, then what will be the angle for wheat in the new pie-chart?
- A62.4°
- B76.8°
- C80.6°
- D84.2°
- E12.4°
Show answerHide answer
Answer: B ✓ official key
Approach: Scale the share by relative growth.
Solution: Wheat's old share = 72/360 = 20%.
New share = 20% × 1.12/1.05 = 22.4%/1.05 ≈ 21.33%.
New angle = 72 × 1.12/1.05 = 80.64/1.05 = 76.8°.
Why the other options are wrong:
C (80.6°): ignores the 5% growth in total.
D (84.2°): adds growth instead of dividing.
A, E: wrong direction or nonsense.
Cetking shortcut: 1.12/1.05 = 16/15 → 72 × 16/15 = 76.8°.
Answer: B
Passage / data for this question
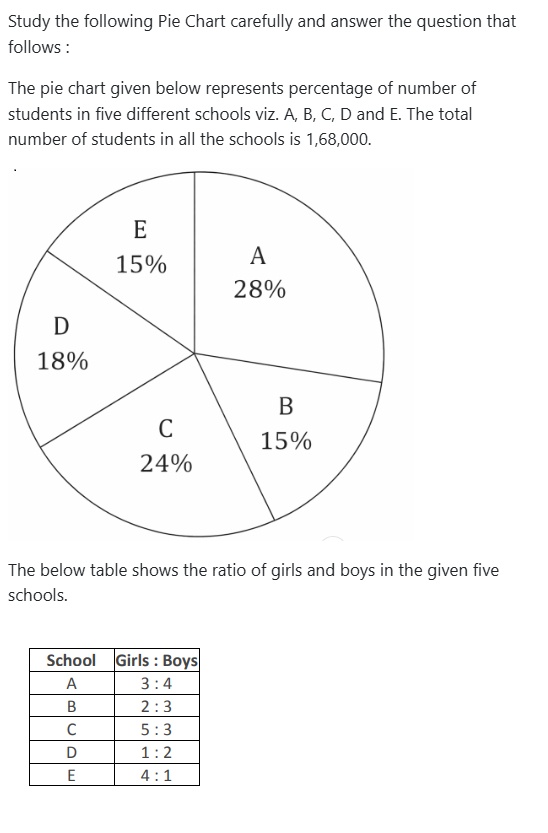
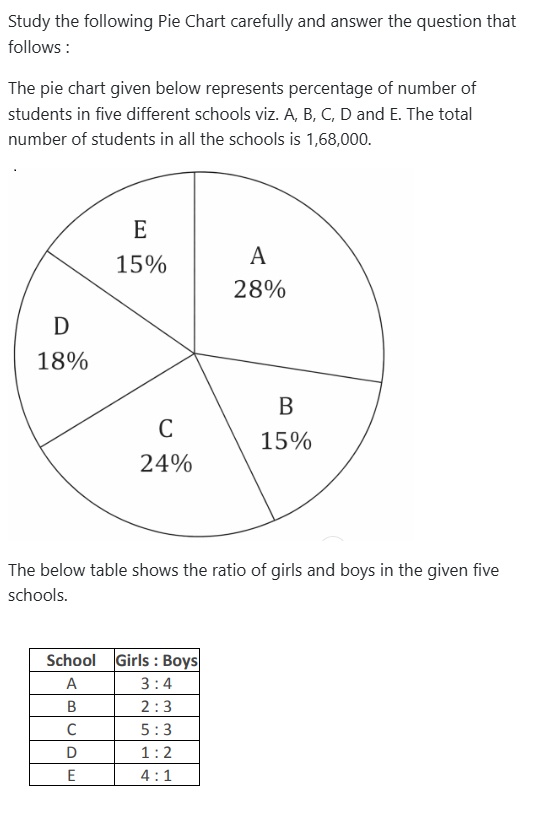
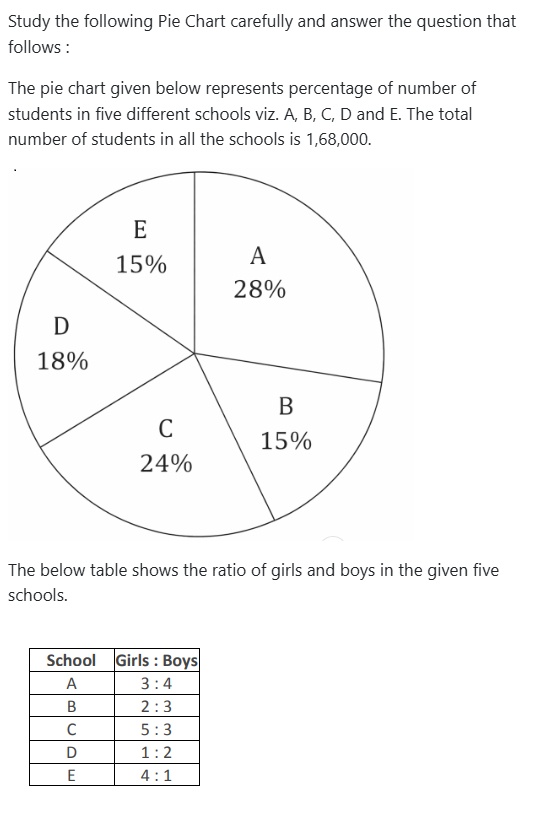
Study the following Pie Chart carefully and answer the question that follows :
The pie chart given below represents percentage of number of students in five different schools viz. A, B, C, D and E. The total number of students in all the schools is 1,68,000.
Data read from chart:
| School | Percentage of students |
|---|
| A | 28% |
| B | 15% |
| C | 24% |
| D | 18% |
| E | 15% |
The below table shows the ratio of girls and boys in the given five schools.
| School | Girls : Boys |
|---|
| A | 3 : 4 |
| B | 2 : 3 |
| C | 5 : 3 |
| D | 1 : 2 |
| E | 4 : 1 |
Find the ratio of number of girls from each school.
- A1:2:2:4:5
- B3:5:7:9:8
- C4:2:5:2:4
- D1:2:3:2:1
- E5:2:6:7:4
Show answerHide answer
Answer: C ✓ official key
Approach: Girls in each school = school total × girls' share; reduce to simplest ratio.
Solution:
Totals (of 1,68,000): A 28% = 47,040; B 15% = 25,200; C 24% = 40,320; D 18% = 30,240; E 15% = 25,200
Girls: A 3/7 × 47,040 = 20,160; B 2/5 × 25,200 = 10,080; C 5/8 × 40,320 = 25,200; D 1/3 × 30,240 = 10,080; E 4/5 × 25,200 = 20,160
Divide by 5,040: 4 : 2 : 5 : 2 : 4
Cetking shortcut: Work in % only: A 28 × 3/7 = 12, B 15 × 2/5 = 6, C 24 × 5/8 = 15, D 18 × 1/3 = 6, E 15 × 4/5 = 12 → 12:6:15:6:12 = 4:2:5:2:4.
Answer: C
Passage / data for this question
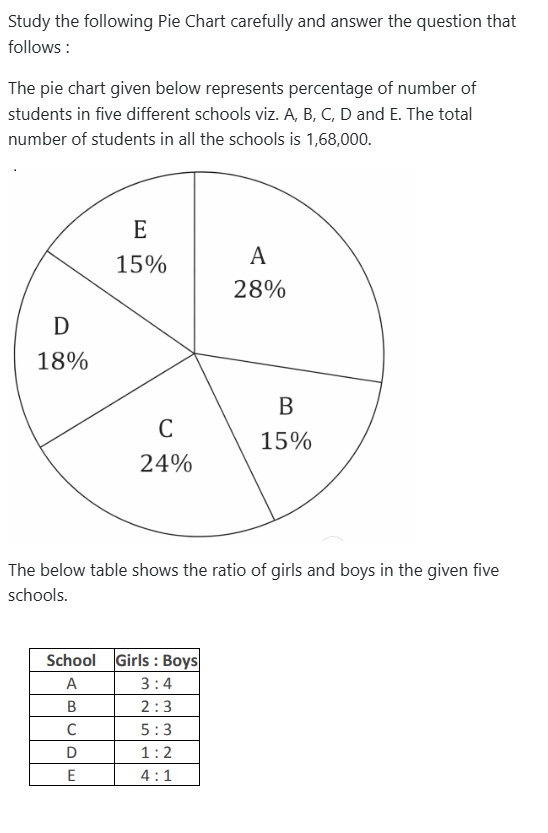
Study the following Pie Chart carefully and answer the question that follows :
The pie chart given below represents percentage of number of students in five different schools viz. A, B, C, D and E. The total number of students in all the schools is 1,68,000.
Data read from chart:
| School | Percentage of students |
|---|
| A | 28% |
| B | 15% |
| C | 24% |
| D | 18% |
| E | 15% |
The below table shows the ratio of girls and boys in the given five schools.
| School | Girls : Boys |
|---|
| A | 3 : 4 |
| B | 2 : 3 |
| C | 5 : 3 |
| D | 1 : 2 |
| E | 4 : 1 |
If 14.28% students of school A change their school and go to school D, what will be the percentage change in the number of students of school D.
- A11.11%
- B22.22%
- C33.33%
- D12.18%
- E14.15%
Show answerHide answer
Answer: B ✓ official key
Approach: 14.28% = 1/7; move that many students from A to D and find D's % rise.
Solution:
A = 47,040 → 1/7 × 47,040 = 6,720 students move
D = 30,240 → new D = 36,960
% change = 6,720/30,240 × 100 = 22.22%
Cetking shortcut: In % terms: 28 × 1/7 = 4 points added to D's 18 → 4/18 = 22.22%.
Answer: B
Passage / data for this question
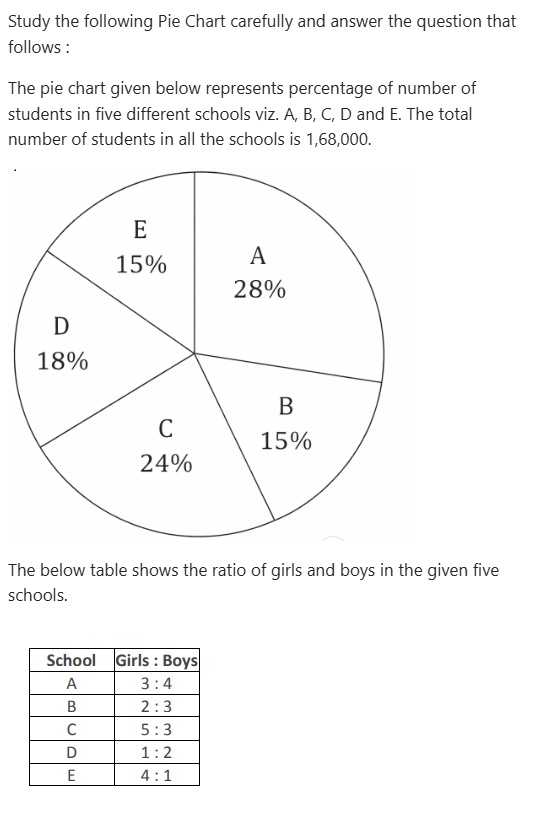
Study the following Pie Chart carefully and answer the question that follows :
The pie chart given below represents percentage of number of students in five different schools viz. A, B, C, D and E. The total number of students in all the schools is 1,68,000.
Data read from chart:
| School | Percentage of students |
|---|
| A | 28% |
| B | 15% |
| C | 24% |
| D | 18% |
| E | 15% |
The below table shows the ratio of girls and boys in the given five schools.
| School | Girls : Boys |
|---|
| A | 3 : 4 |
| B | 2 : 3 |
| C | 5 : 3 |
| D | 1 : 2 |
| E | 4 : 1 |
What is the ratio of average number of students from School A and D to that of the average number of students from School B, C and E?
- A18 : 23
- B14 : 25
- C23 : 18
- D8 : 9
- E27 : 19
Show answerHide answer
Answer: C ✓ official key
Approach: Compare averages using the pie percentages (same total cancels).
Solution:
Average of A and D = (28 + 18)/2 = 23%
Average of B, C, E = (15 + 24 + 15)/3 = 54/3 = 18%
Ratio = 23 : 18
Why the other options are wrong:
A (18 : 23) is the reversed ratio.
Cetking shortcut: No need for absolute numbers — percentages of the same total give the ratio directly.
Answer: C
Passage / data for this question
Study the following Pie Chart carefully and answer the question that follows :
The pie chart given below represents percentage of number of students in five different schools viz. A, B, C, D and E. The total number of students in all the schools is 1,68,000.
Data read from chart:
| School | Percentage of students |
|---|
| A | 28% |
| B | 15% |
| C | 24% |
| D | 18% |
| E | 15% |
The below table shows the ratio of girls and boys in the given five schools.
| School | Girls : Boys |
|---|
| A | 3 : 4 |
| B | 2 : 3 |
| C | 5 : 3 |
| D | 1 : 2 |
| E | 4 : 1 |
The number of students in School E is what percentage of the difference between the number of students in School C and School B?
- A156.76%
- B186.67%
- C60%
- D166.67%
- E74%
Show answerHide answer
Answer: D ✓ official key
Approach: Express E as a percentage of (C − B), working on pie percentages.
Solution:
E = 15%; C − B = 24% − 15% = 9%
15/9 × 100 = 166.67%
Why the other options are wrong:
B (186.67%) and A (156.76%) are near-miss decoys; C (60%) is the inverse (9/15).
Cetking shortcut: 15/9 = 5/3 = 166.67%.
Answer: D
Passage / data for this question
Study the following Pie Chart carefully and answer the question that follows :
The pie chart given below represents percentage of number of students in five different schools viz. A, B, C, D and E. The total number of students in all the schools is 1,68,000.
Data read from chart:
| School | Percentage of students |
|---|
| A | 28% |
| B | 15% |
| C | 24% |
| D | 18% |
| E | 15% |
The below table shows the ratio of girls and boys in the given five schools.
| School | Girls : Boys |
|---|
| A | 3 : 4 |
| B | 2 : 3 |
| C | 5 : 3 |
| D | 1 : 2 |
| E | 4 : 1 |
Find the average number of boys in all the schools combined?
- A15784
- B16464
- C17840
- D16465
- E15400
Show answerHide answer
Answer: B ✓ official key
Approach: Boys in each school = school total × boys' share; average over 5 schools.
Solution:
A 4/7 × 47,040 = 26,880
B 3/5 × 25,200 = 15,120
C 3/8 × 40,320 = 15,120
D 2/3 × 30,240 = 20,160
E 1/5 × 25,200 = 5,040
Total boys = 82,320 → average = 82,320/5 = 16,464
Why the other options are wrong:
D (16,465) is a one-off decoy; the exact average is 16,464.
Cetking shortcut: Total girls (from Q1) = 85,680 → boys = 1,68,000 − 85,680 = 82,320 → ÷ 5 = 16,464.
Answer: B
Passage / data for this question
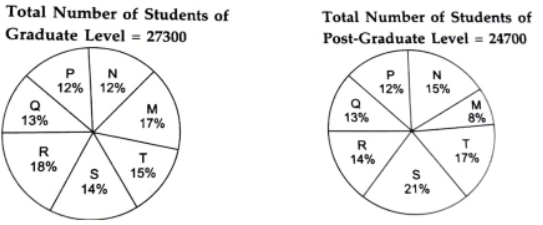
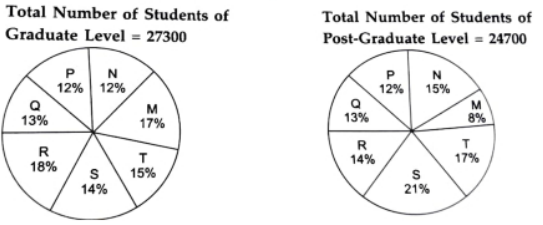
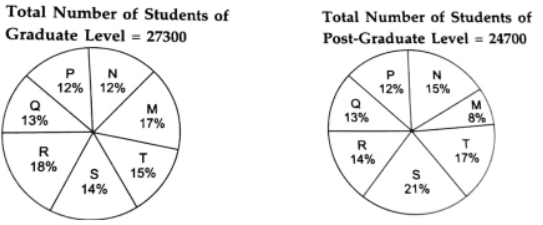
The following pie-charts show the distribution of students of graduate and post-graduate levels in 7 different institutes: M, N, P, Q, R, S, and T in a town. Study the pie-charts carefully and answer the questions given below:
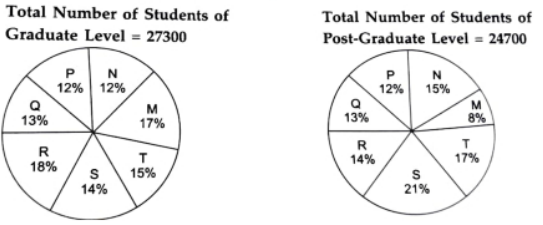
Distribution of students at graduate and post-graduate levels in seven institutes – M, N, P, Q, R, S and T
How many students of institutes M and S are studying at graduate level?
- A7516
- B8463
- C9127
- D9404
- E9900
Show answerHide answer
Answer: B
Approach: Add the shares of M and S in the graduate pie, then take that % of 27,300.
Solution: Graduate pie: M = 17%, S = 14% → 31%.
31% of 27,300 = 0.31 × 27,300 = 8,463.
Cetking shortcut: 1% of 27,300 = 273 → 31 × 273 = 8,463.
Answer: B
Passage / data for this question
The following pie-charts show the distribution of students of graduate and post-graduate levels in 7 different institutes: M, N, P, Q, R, S, and T in a town. Study the pie-charts carefully and answer the questions given below:
Distribution of students at graduate and post-graduate levels in seven institutes – M, N, P, Q, R, S and T
Total number of students studying at post-graduate level from institutes N and P is
- A5601
- B5944
- C6669
- D7004
- E9127
Show answerHide answer
Answer: C
Approach: Add the PG shares of N and P, then take that % of 24,700.
Solution: Post-graduate pie: N = 15%, P = 12% → 27%.
27% of 24,700 = 0.27 × 24,700 = 6,669.
Cetking shortcut: 1% = 247 → 27 × 247 = 6,669.
Answer: C
Passage / data for this question
The following pie-charts show the distribution of students of graduate and post-graduate levels in 7 different institutes: M, N, P, Q, R, S, and T in a town. Study the pie-charts carefully and answer the questions given below:
Distribution of students at graduate and post-graduate levels in seven institutes – M, N, P, Q, R, S and T
What is the total number of graduate and post-graduate level students in institute R?
- A8320
- B7916
- C9116
- D8372
- E7004
Show answerHide answer
Answer: D
Approach: R's graduate count + R's PG count.
Solution: Graduate: 18% of 27,300 = 4,914.
Post-graduate: 14% of 24,700 = 3,458.
Total = 4,914 + 3,458 = 8,372.
Cetking shortcut: Units digits: 18×273 ends in 4, 14×247 ends in 8 → sum ends in 2; only 8,372 ends in 2.
Answer: D
Passage / data for this question
The following pie-charts show the distribution of students of graduate and post-graduate levels in 7 different institutes: M, N, P, Q, R, S, and T in a town. Study the pie-charts carefully and answer the questions given below:
Distribution of students at graduate and post-graduate levels in seven institutes – M, N, P, Q, R, S and T
What is the ratio between the number of students studying at post-graduate and graduate levels respectively from institute S?
- A23:15
- B17:27
- C11:21
- D19:14
- E13:17
Show answerHide answer
Answer: D
Approach: PG(S) : G(S) = (21% × 24,700) : (14% × 27,300).
Solution: PG = 0.21 × 24,700 = 5,187; G = 0.14 × 27,300 = 3,822.
Ratio = (21 × 247) : (14 × 273) = (21 × 13 × 19) : (14 × 3 × 7 × 13) = (21 × 19) : (14 × 21) = 19 : 14.
Cetking shortcut: 247 = 13 × 19 and 273 = 13 × 21 → cancels to 19:14 in one line.
Answer: D
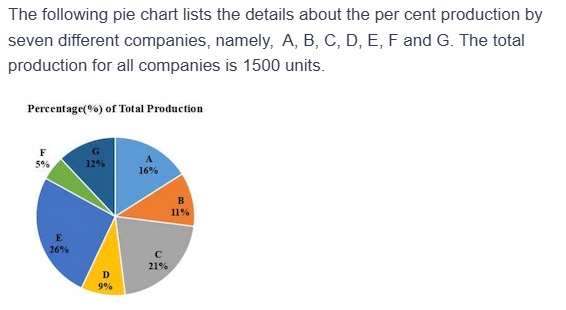
The following pie chart lists the details about the per cent production by seven different companies, namely, A, B, C, D, E, F and G. The total production for all companies is 1500 units.
Percentage(%) of Total Production: A 16%, B 11%, C 21%, D 9%, E 26%, F 5%, G 12%.
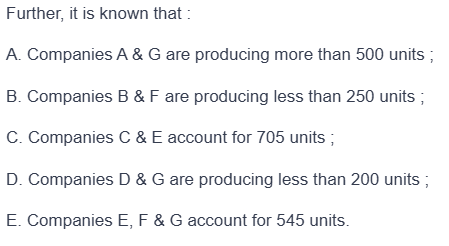
Further, it is known that
A. Companies A & G are producing more than 500 units ;
B. Companies B & F are producing less than 250 units ;
C. Companies C & E account for 705 units ;
D. Companies D & G are producing less than 200 units ;
E. Companies E, F & G account for 545 units.
Choose which of the following is correct
- AOnly A,D and E are true
- BOnly A and E are true
- COnly C and E are true
- DOnly B and C are true
- EOnly A and D are true
Show answerHide answer
Answer: D
Approach: 1% of 1500 = 15 units; add the percentages of each group and convert.
Solution:
Statement A: A + G = 16% + 12% = 28% = 420 → not more than 500 → false
Statement B: B + F = 11% + 5% = 16% = 240 → less than 250 → true
Statement C: C + E = 21% + 26% = 47% = 705 → true
Statement D: D + G = 9% + 12% = 21% = 315 → not less than 200 → false
Statement E: E + F + G = 26% + 5% + 12% = 43% = 645 ≠ 545 → false
Only B and C are true
Why the other options are wrong:
A, B, E: each includes statement A (420, not more than 500).
C: includes statement E (645, not 545).
Cetking shortcut: Convert thresholds to %: 500 = 33.3%, 250 = 16.7%, 705 = 47%, 200 = 13.3%, 545 = 36.3% — compare percentages directly.
Answer: D
Passage / data for this question
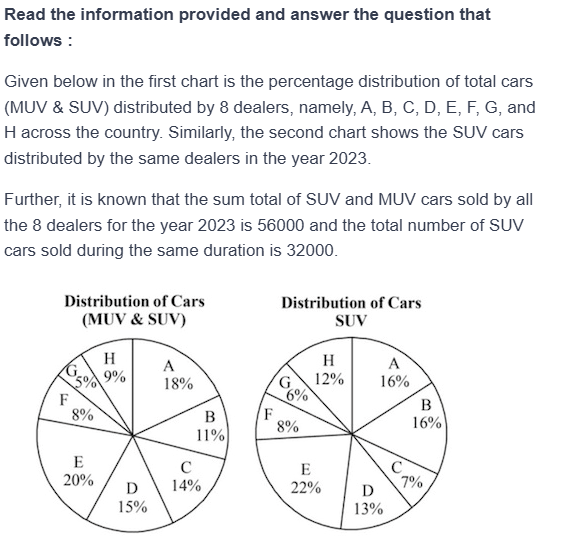
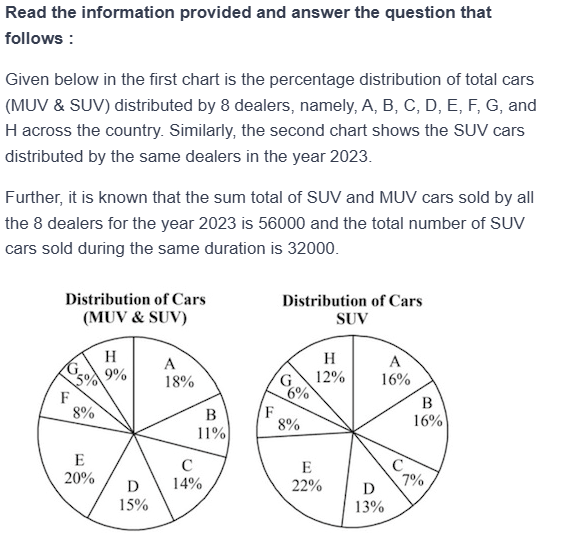
Read the information provided and answer the question that follows :
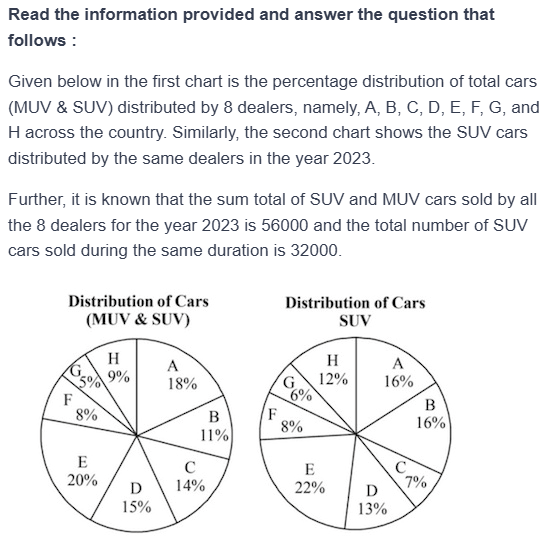
Given below in the first chart is the percentage distribution of total cars (MUV & SUV) distributed by 8 dealers, namely, A, B, C, D, E, F, G, and H across the country. Similarly, the second chart shows the SUV cars distributed by the same dealers in the year 2023.
Further, it is known that the sum total of SUV and MUV cars sold by all the 8 dealers for the year 2023 is 56000 and the total number of SUV cars sold during the same duration is 32000.
Distribution of Cars (MUV & SUV): A 18%, B 11%, C 14%, D 15%, E 20%, F 8%, G 5%, H 9%.
Distribution of Cars SUV: A 16%, B 16%, C 7%, D 13%, E 22%, F 8%, G 6%, H 12%.
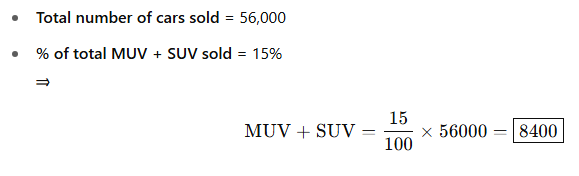
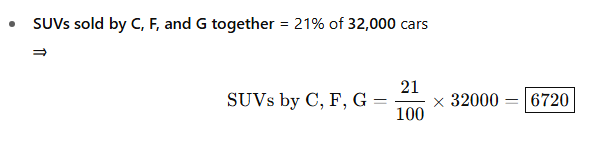
The total number of cars sold by the dealer D is by what percentage more than the total number of SUV cars sold by dealers C, F and G together ?
- A75%
- B50%
- C63%
- D33%
- E25%
Show answerHide answer
Answer: E
Approach: Convert each pie share to units with its own total.
Solution:
Dealer D total cars = 15% of 56000 = 8400
SUVs of C, F, G = (7 + 8 + 6)% = 21% of 32000 = 6720
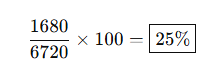
% more = (8400 − 6720)/6720 × 100 = 1680/6720 × 100 = 25%
Why the other options are wrong:
A, B, C, D: come from applying SUV percentages to 56000, or using the wrong base for 'percentage more'.
Cetking shortcut: 8400/6720 = 1.25 → 25% more.
Answer: E
Passage / data for this question
Read the information provided and answer the question that follows :
Given below in the first chart is the percentage distribution of total cars (MUV & SUV) distributed by 8 dealers, namely, A, B, C, D, E, F, G, and H across the country. Similarly, the second chart shows the SUV cars distributed by the same dealers in the year 2023.
Further, it is known that the sum total of SUV and MUV cars sold by all the 8 dealers for the year 2023 is 56000 and the total number of SUV cars sold during the same duration is 32000.
Distribution of Cars (MUV & SUV): A 18%, B 11%, C 14%, D 15%, E 20%, F 8%, G 5%, H 9%.
Distribution of Cars SUV: A 16%, B 16%, C 7%, D 13%, E 22%, F 8%, G 6%, H 12%.
Determine the ratio between the total number of SUV cars distributed by dealers A and B together and total number of SUV and MUV cars distributed by dealers C and F together ?
- A54:77
- B64:73
- C64:77
- D1:4.33
- E64:79
Show answerHide answer
Answer: C
Approach: Convert to units, then simplify.
Solution:
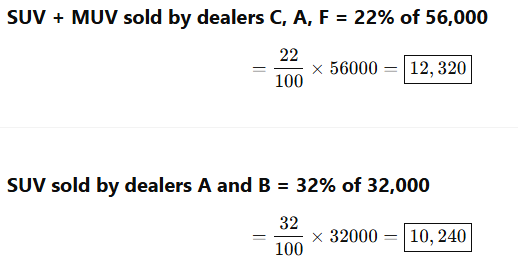
SUV of A + B = (16 + 16)% of 32000 = 10240
All cars of C + F = (14 + 8)% of 56000 = 12320
Ratio = 10240 : 12320 = 64 : 77 (divide by 160)
Why the other options are wrong:
A (54:77), B (64:73), E (64:79): one term altered.
D (1:4.33): no such relation between the groups.
Cetking shortcut: (32 × 32000) : (22 × 56000) = (32 × 4) : (22 × 7) = 128 : 154 = 64 : 77.
Answer: C
Passage / data for this question
Read the information provided and answer the question that follows :
Given below in the first chart is the percentage distribution of total cars (MUV & SUV) distributed by 8 dealers, namely, A, B, C, D, E, F, G, and H across the country. Similarly, the second chart shows the SUV cars distributed by the same dealers in the year 2023.
Further, it is known that the sum total of SUV and MUV cars sold by all the 8 dealers for the year 2023 is 56000 and the total number of SUV cars sold during the same duration is 32000.
Distribution of Cars (MUV & SUV): A 18%, B 11%, C 14%, D 15%, E 20%, F 8%, G 5%, H 9%.
Distribution of Cars SUV: A 16%, B 16%, C 7%, D 13%, E 22%, F 8%, G 6%, H 12%.
Determine the average number of MUV cars distributed by dealers A, D, E, F and H together ?
- A2892
- B3634
- C3326
- D3296
- E3354
Show answerHide answer
Answer: D
Approach: MUV per dealer = total cars − SUVs, then average.
Solution:
A: 18% × 56000 − 16% × 32000 = 10080 − 5120 = 4960
D: 8400 − 4160 = 4240
E: 11200 − 7040 = 4160
F: 4480 − 2560 = 1920
H: 5040 − 3840 = 1200
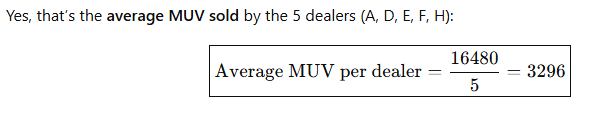
Sum = 16480; average = 16480/5 = 3296
Cetking shortcut: Sum directly: total share (18+15+20+8+9)% = 70% × 56000 = 39200; SUV share (16+13+22+8+12)% = 71% × 32000 = 22720; (39200 − 22720)/5 = 3296.
Answer: D