CET Pie Charts Questions with Solutions – Page 13
All 57 Pie Charts questions from MBA CET 2023 and 2024 and 2025 and 2026 papers. Tap Show answer, or open the detailed solution (free login). Page 13 of 13.
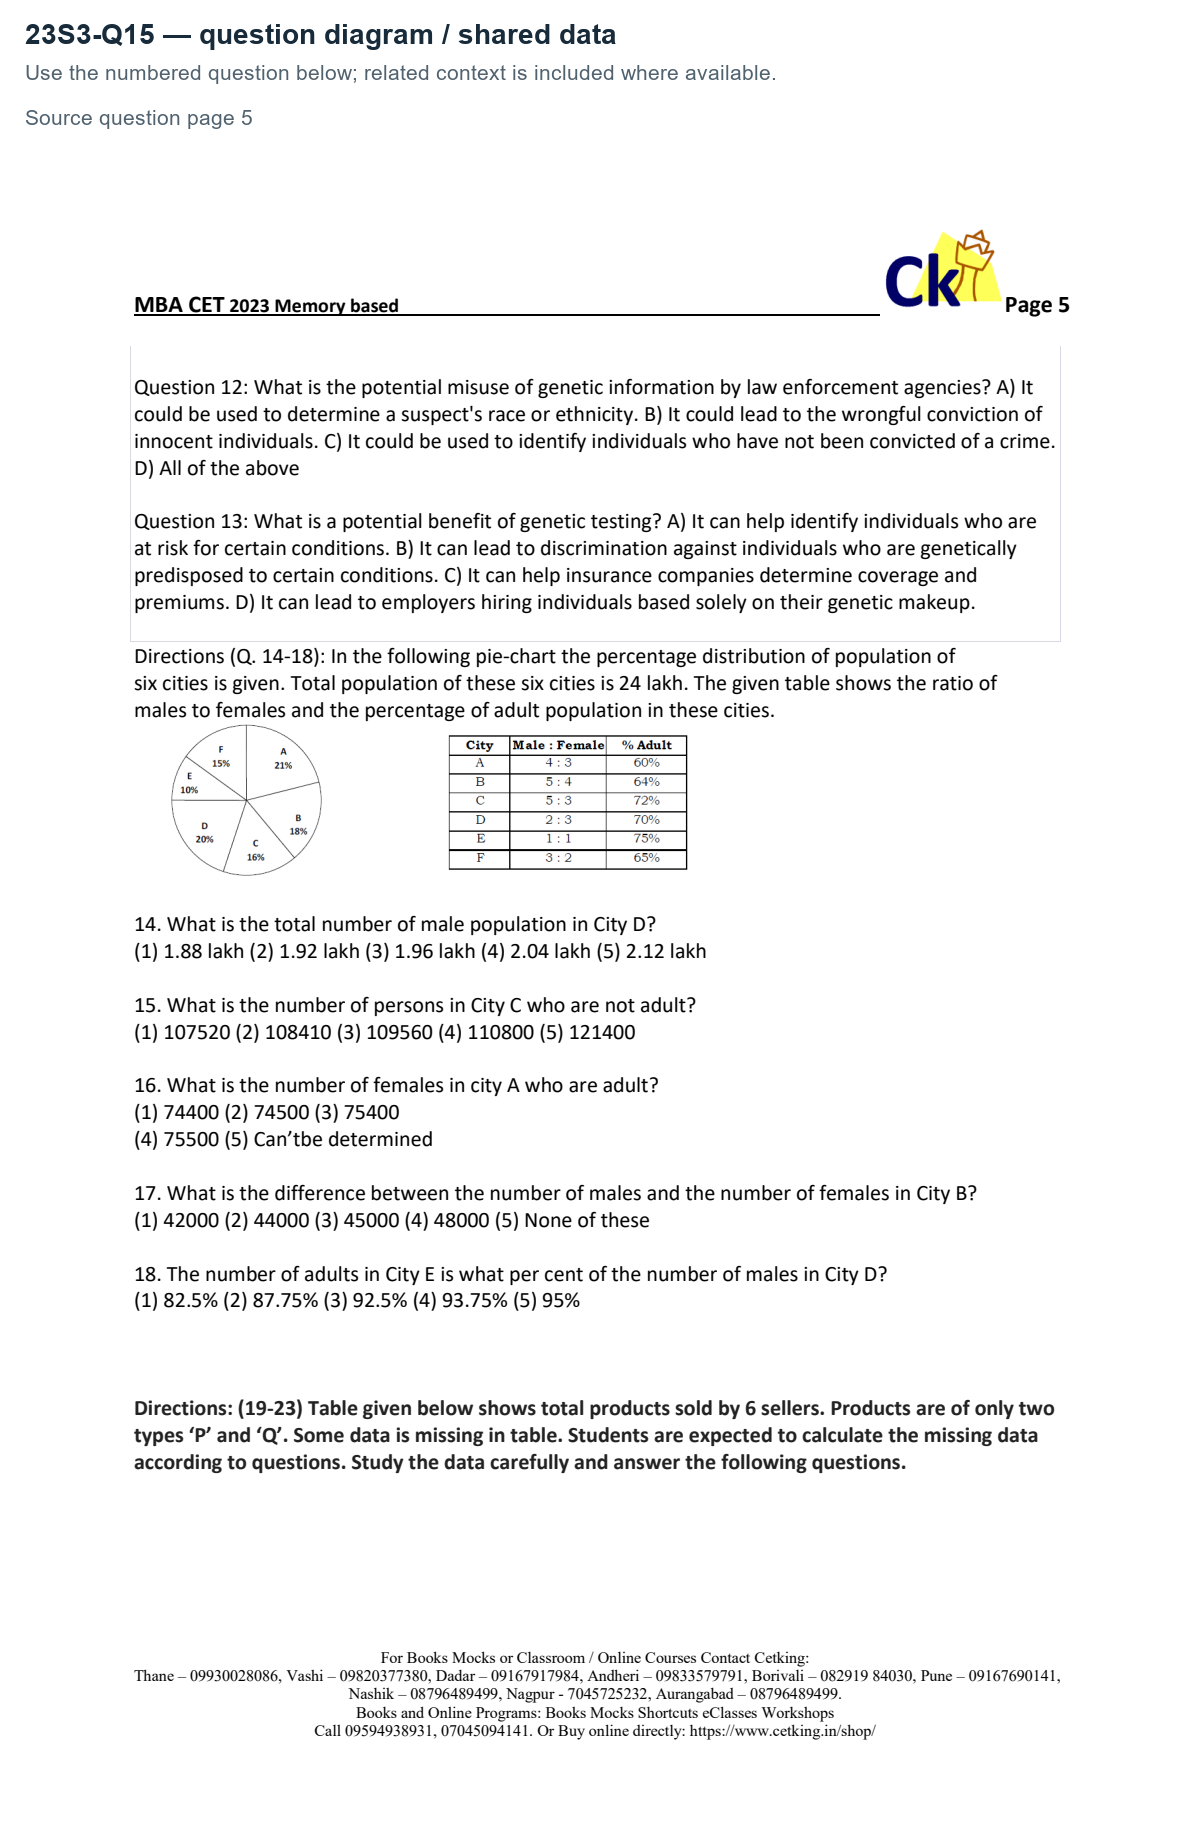
Directions (Q. 14-18): In the following pie-chart the percentage distribution of population of
six cities is given. Total population of these six cities is 24 lakh. The given table shows the ratio of
males to females and the percentage of adult population in these cities.
What is the number of persons in City C who are not adult?
(1) 107520 (2) 108410 (3) 109560 (4) 110800 (5) 121400
six cities is given. Total population of these six cities is 24 lakh. The given table shows the ratio of
males to females and the percentage of adult population in these cities.
What is the number of persons in City C who are not adult?
(1) 107520 (2) 108410 (3) 109560 (4) 110800 (5) 121400
Answer: A. 107520
Solution — first steps
CityC population=24,00,000×16%=3,84,000. Non-adults=28%×3,84,000=1,07,520.
The full step-by-step working opens with a free login.
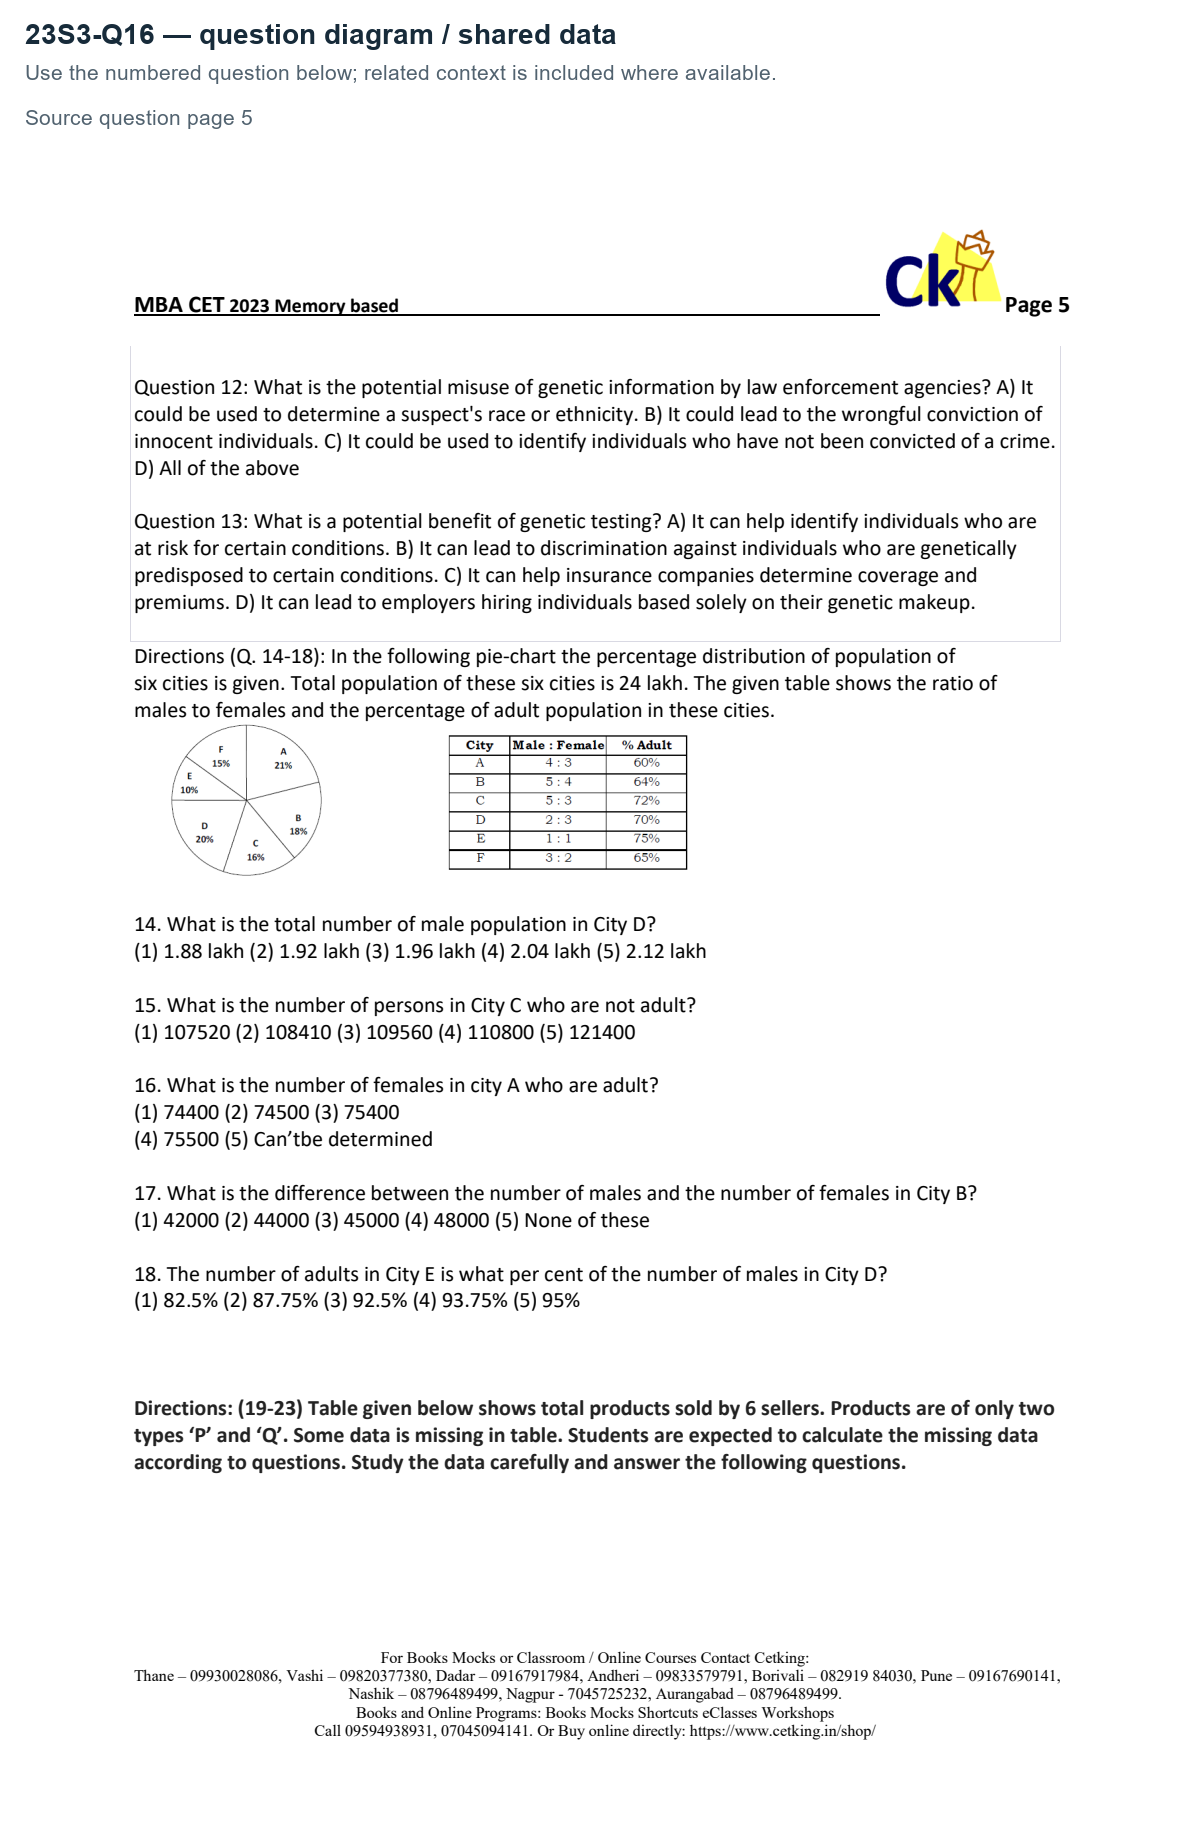
Directions (Q. 14-18): In the following pie-chart the percentage distribution of population of
six cities is given. Total population of these six cities is 24 lakh. The given table shows the ratio of
males to females and the percentage of adult population in these cities.
What is the number of females in city A who are adult?
(1) 74400 (2) 74500 (3) 75400
(4) 75500 (5) Can’tbe determined
six cities is given. Total population of these six cities is 24 lakh. The given table shows the ratio of
males to females and the percentage of adult population in these cities.
What is the number of females in city A who are adult?
(1) 74400 (2) 74500 (3) 75400
(4) 75500 (5) Can’tbe determined
Answer: E. Can’tbe determined
Solution — first steps
The table gives total adult percentage but no male/female breakdown of those adults. Total female population and total adult population do not determine their intersection.
The full step-by-step working opens with a free login.
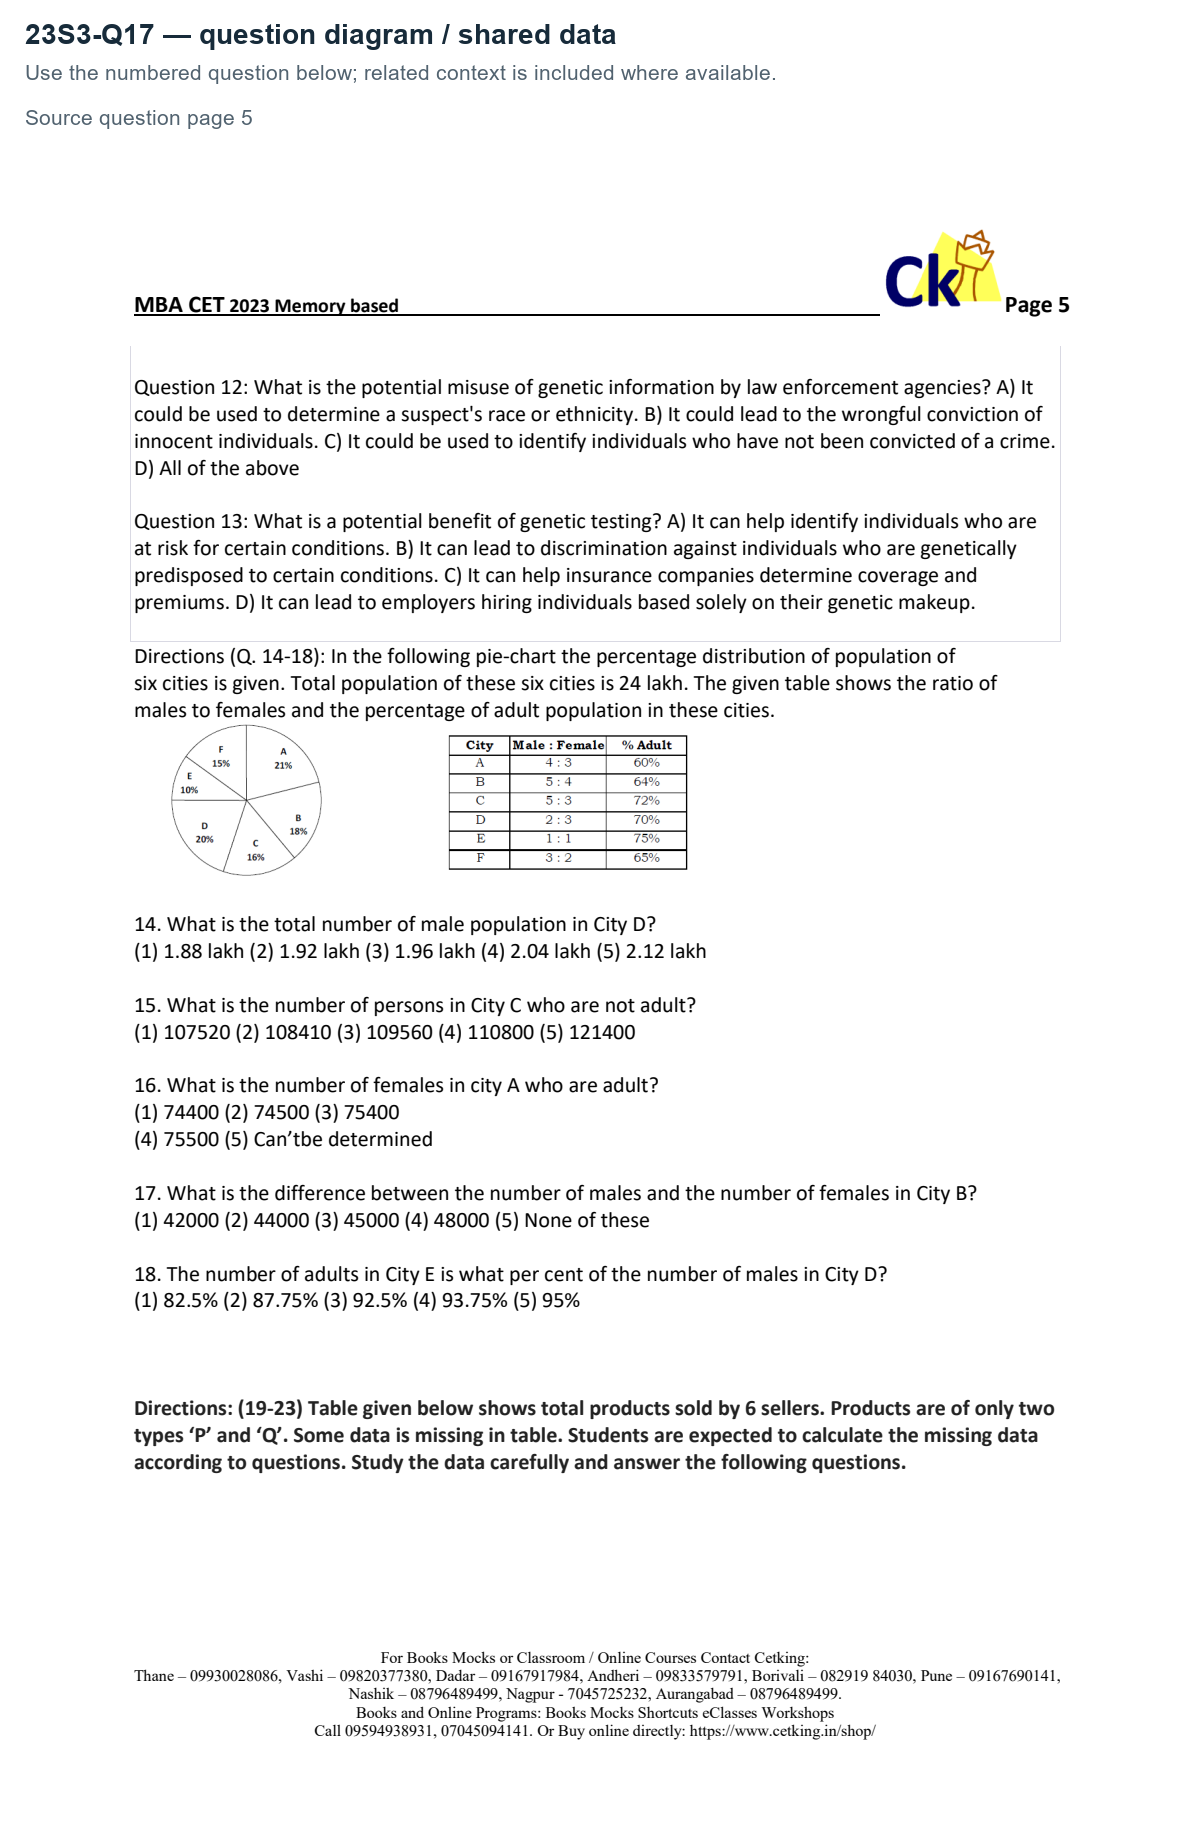
Directions (Q. 14-18): In the following pie-chart the percentage distribution of population of
six cities is given. Total population of these six cities is 24 lakh. The given table shows the ratio of
males to females and the percentage of adult population in these cities.
What is the difference between the number of males and the number of females in City B?
(1) 42000 (2) 44000 (3) 45000 (4) 48000 (5) None of these
six cities is given. Total population of these six cities is 24 lakh. The given table shows the ratio of
males to females and the percentage of adult population in these cities.
What is the difference between the number of males and the number of females in City B?
(1) 42000 (2) 44000 (3) 45000 (4) 48000 (5) None of these
Answer: D. 48000
Solution — first steps
CityB population=24,00,000×18%=4,32,000. Male:female5:4 implies difference1/9 of total=48,000.
The full step-by-step working opens with a free login.
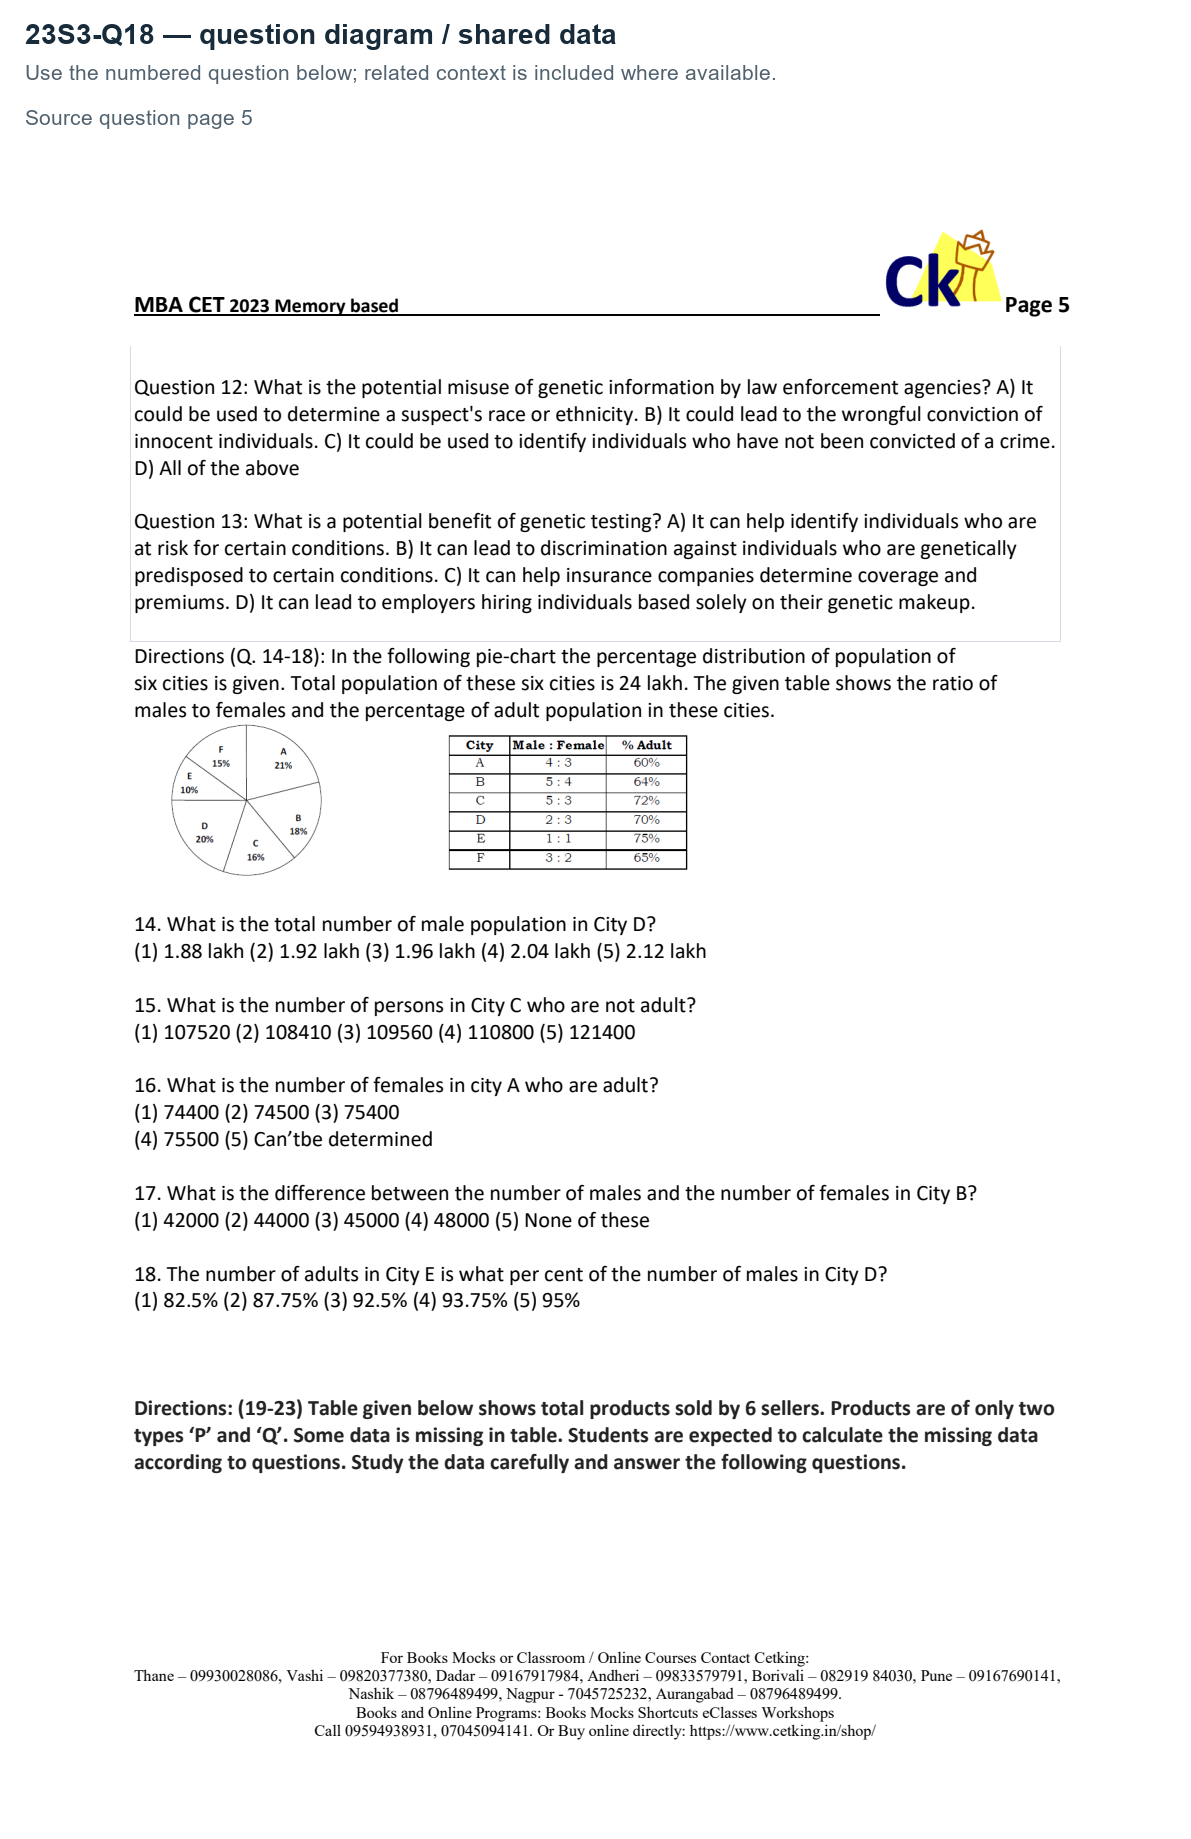
Directions (Q. 14-18): In the following pie-chart the percentage distribution of population of
six cities is given. Total population of these six cities is 24 lakh. The given table shows the ratio of
males to females and the percentage of adult population in these cities.
The number of adults in City E is what per cent of the number of males in City D?
(1) 82.5% (2) 87.75% (3) 92.5% (4) 93.75% (5) 95%
Directions:
six cities is given. Total population of these six cities is 24 lakh. The given table shows the ratio of
males to females and the percentage of adult population in these cities.
The number of adults in City E is what per cent of the number of males in City D?
(1) 82.5% (2) 87.75% (3) 92.5% (4) 93.75% (5) 95%
Directions:
Answer: D. 93.75%
Solution — first steps
Adults inE=24,00,000×10%×75%=1,80,000. Males inD=24,00,000×20%×2/5=1,92,000.
The full step-by-step working opens with a free login.