Let’s Crack CAT 2026

Your CAT check-up · tap a ring to see yours

CAT 2026Papers & G StrategyCaselets

CAT Caselets questions (2006–2025) — actual DILR sets with solutions

138 real CAT Caselets questions from CAT 2006 to CAT 2025, each with options, the verified answer and a step-by-step solution. Practice one topic at a time, the

138 real CAT questions · CAT 2006–2025 · 6 Easy · 9 Medium · 5 Hard

Q1CAT 2025 · Slot 3 · CAT Medium · TITA✓ Answer verified

Currency Expenditure | Caselet | CAT 2025 DILR Slot 3 | Medium

Aurevia, Brelosia, Cyrenia and Zerathania are four countries with their currencies being Aurels, Brins, Crowns, and Zentars, respectively. The currencies have different exchange values. Crown’s currency exchange rate with Zentars = 0.5, i.e., 1 Crown is worth 0.5 Zentars. Three travelers, Jano, Kira, and Lian set out from Zerathania visiting exactly two of the countries. Each country is visited by exactly two travelers. Each traveler has a unique Flight Cost, which represents the total cost of airfare in traveling to both the countries and back to Zerathania. The Flight Cost of Jano was 4000 Zentars, while that of the other two travelers were 5000 and 6000 Zentars, not necessarily in that order. When visiting a country, a traveler spent either 1000, 2000 or 3000 in the country’s local currency. Each traveler had different spends (in the country’s local currency) in the two countries he/she visited. Across all the visits, there were exactly two spends of 1000 and exactly one spend of 3000 (in the country’s local currency). The total “Travel Cost” for a traveler is the sum of his/her Flight Cost and the money spent in the countries visited. The citizens of the four countries with knowledge of these travels made a few observations, with spends measured in their respective local currencies: i. Aurevia citizen: Jano and Kira visited our country, and their Travel Costs were 3500 and 8000, respectively. ii. Brelosia citizen: Kira and Lian visited our country, spending 2000 and 3000, respectively. Kira’s Travel Cost was 4000. iii. Cyrenia citizen: Lian visited our country and her Travel Cost was 36000.

What is the sum of Travel Costs for all travelers in Zentars?

Q2CAT 2025 · Slot 3 · CAT Medium · TITA✓ Answer verified

Currency Expenditure | Caselet | CAT 2025 DILR Slot 3 | Medium

Aurevia, Brelosia, Cyrenia and Zerathania are four countries with their currencies being Aurels, Brins, Crowns, and Zentars, respectively. The currencies have different exchange values. Crown’s currency exchange rate with Zentars = 0.5, i.e., 1 Crown is worth 0.5 Zentars. Three travelers, Jano, Kira, and Lian set out from Zerathania visiting exactly two of the countries. Each country is visited by exactly two travelers. Each traveler has a unique Flight Cost, which represents the total cost of airfare in traveling to both the countries and back to Zerathania. The Flight Cost of Jano was 4000 Zentars, while that of the other two travelers were 5000 and 6000 Zentars, not necessarily in that order. When visiting a country, a traveler spent either 1000, 2000 or 3000 in the country’s local currency. Each traveler had different spends (in the country’s local currency) in the two countries he/she visited. Across all the visits, there were exactly two spends of 1000 and exactly one spend of 3000 (in the country’s local currency). The total “Travel Cost” for a traveler is the sum of his/her Flight Cost and the money spent in the countries visited. The citizens of the four countries with knowledge of these travels made a few observations, with spends measured in their respective local currencies: i. Aurevia citizen: Jano and Kira visited our country, and their Travel Costs were 3500 and 8000, respectively. ii. Brelosia citizen: Kira and Lian visited our country, spending 2000 and 3000, respectively. Kira’s Travel Cost was 4000. iii. Cyrenia citizen: Lian visited our country and her Travel Cost was 36000.

How many Zentars did Lian spend in the two countries he visited?

Q3CAT 2025 · Slot 3 · CAT Medium · TITA✓ Answer verified

Currency Expenditure | Caselet | CAT 2025 DILR Slot 3 | Medium

Aurevia, Brelosia, Cyrenia and Zerathania are four countries with their currencies being Aurels, Brins, Crowns, and Zentars, respectively. The currencies have different exchange values. Crown’s currency exchange rate with Zentars = 0.5, i.e., 1 Crown is worth 0.5 Zentars. Three travelers, Jano, Kira, and Lian set out from Zerathania visiting exactly two of the countries. Each country is visited by exactly two travelers. Each traveler has a unique Flight Cost, which represents the total cost of airfare in traveling to both the countries and back to Zerathania. The Flight Cost of Jano was 4000 Zentars, while that of the other two travelers were 5000 and 6000 Zentars, not necessarily in that order. When visiting a country, a traveler spent either 1000, 2000 or 3000 in the country’s local currency. Each traveler had different spends (in the country’s local currency) in the two countries he/she visited. Across all the visits, there were exactly two spends of 1000 and exactly one spend of 3000 (in the country’s local currency). The total “Travel Cost” for a traveler is the sum of his/her Flight Cost and the money spent in the countries visited. The citizens of the four countries with knowledge of these travels made a few observations, with spends measured in their respective local currencies: i. Aurevia citizen: Jano and Kira visited our country, and their Travel Costs were 3500 and 8000, respectively. ii. Brelosia citizen: Kira and Lian visited our country, spending 2000 and 3000, respectively. Kira’s Travel Cost was 4000. iii. Cyrenia citizen: Lian visited our country and her Travel Cost was 36000.

What was Jano’s total spend in the two countries he visited, in Aurels?

Q4CAT 2025 · Slot 3 · CAT Medium✓ Answer verified

Currency Expenditure | Caselet | CAT 2025 DILR Slot 3 | Medium

Aurevia, Brelosia, Cyrenia and Zerathania are four countries with their currencies being Aurels, Brins, Crowns, and Zentars, respectively. The currencies have different exchange values. Crown’s currency exchange rate with Zentars = 0.5, i.e., 1 Crown is worth 0.5 Zentars. Three travelers, Jano, Kira, and Lian set out from Zerathania visiting exactly two of the countries. Each country is visited by exactly two travelers. Each traveler has a unique Flight Cost, which represents the total cost of airfare in traveling to both the countries and back to Zerathania. The Flight Cost of Jano was 4000 Zentars, while that of the other two travelers were 5000 and 6000 Zentars, not necessarily in that order. When visiting a country, a traveler spent either 1000, 2000 or 3000 in the country’s local currency. Each traveler had different spends (in the country’s local currency) in the two countries he/she visited. Across all the visits, there were exactly two spends of 1000 and exactly one spend of 3000 (in the country’s local currency). The total “Travel Cost” for a traveler is the sum of his/her Flight Cost and the money spent in the countries visited. The citizens of the four countries with knowledge of these travels made a few observations, with spends measured in their respective local currencies: i. Aurevia citizen: Jano and Kira visited our country, and their Travel Costs were 3500 and 8000, respectively. ii. Brelosia citizen: Kira and Lian visited our country, spending 2000 and 3000, respectively. Kira’s Travel Cost was 4000. iii. Cyrenia citizen: Lian visited our country and her Travel Cost was 36000.

One Brin is equivalent to how many Crowns?

Q5CAT 2025 · Slot 3 · CAT Medium✓ Answer verified

Currency Expenditure | Caselet | CAT 2025 DILR Slot 3 | Medium

Aurevia, Brelosia, Cyrenia and Zerathania are four countries with their currencies being Aurels, Brins, Crowns, and Zentars, respectively. The currencies have different exchange values. Crown’s currency exchange rate with Zentars = 0.5, i.e., 1 Crown is worth 0.5 Zentars. Three travelers, Jano, Kira, and Lian set out from Zerathania visiting exactly two of the countries. Each country is visited by exactly two travelers. Each traveler has a unique Flight Cost, which represents the total cost of airfare in traveling to both the countries and back to Zerathania. The Flight Cost of Jano was 4000 Zentars, while that of the other two travelers were 5000 and 6000 Zentars, not necessarily in that order. When visiting a country, a traveler spent either 1000, 2000 or 3000 in the country’s local currency. Each traveler had different spends (in the country’s local currency) in the two countries he/she visited. Across all the visits, there were exactly two spends of 1000 and exactly one spend of 3000 (in the country’s local currency). The total “Travel Cost” for a traveler is the sum of his/her Flight Cost and the money spent in the countries visited. The citizens of the four countries with knowledge of these travels made a few observations, with spends measured in their respective local currencies: i. Aurevia citizen: Jano and Kira visited our country, and their Travel Costs were 3500 and 8000, respectively. ii. Brelosia citizen: Kira and Lian visited our country, spending 2000 and 3000, respectively. Kira’s Travel Cost was 4000. iii. Cyrenia citizen: Lian visited our country and her Travel Cost was 36000.

Which of the following statements is NOT true about money spent in the local currency?

Q6CAT 2025 · Slot 3 · CAT Medium · TITA✓ Answer verified

Mobile Calls | DILR CAT 2025 Slot 3 | Caselet | Moderate

Anu, Bijay, Chetan, Deepak, Eshan, and Faruq are six friends. Each of them uses a mobile number from exactly one of the two mobile operators − Xitel and Yocel. During the last month, the six friends made several calls to each other. Each call was made by one of these six friends to another. The table below summarizes the number of minutes of calls that each of the six made to (outgoing minutes) and received from (incoming minutes) these friends, grouped by the operators. Some of the entries are missing. Friend Operator Outgoing minutes to Operator Incoming minutes from Operator Xitel Yocel Xitel Yocel Anu Xitel 100 50 225 Bijay Xitel 200 125 Chetan Yocel 50 175 250 150 Deepak Yocel 100 150 275 100 Eshan Yocel 100 100 375 Faruq Yocel 0 100 150 It is known that the duration of calls from Faruq to Eshan was 200 minutes. Also, there were no calls from: i. Bijay to Eshan, ii. Chetan to Anu and Chetan to Deepak, iii. Deepak to Bijay and Deepak to Faruq, iv. Eshan to Chetan and Eshan to Deepak.

What was the duration of calls (in minutes) from Bijay to Anu?

Q7CAT 2025 · Slot 3 · CAT Medium · TITA✓ Answer verified

Mobile Calls | DILR CAT 2025 Slot 3 | Caselet | Moderate

Anu, Bijay, Chetan, Deepak, Eshan, and Faruq are six friends. Each of them uses a mobile number from exactly one of the two mobile operators − Xitel and Yocel. During the last month, the six friends made several calls to each other. Each call was made by one of these six friends to another. The table below summarizes the number of minutes of calls that each of the six made to (outgoing minutes) and received from (incoming minutes) these friends, grouped by the operators. Some of the entries are missing. Friend Operator Outgoing minutes to Operator Incoming minutes from Operator Xitel Yocel Xitel Yocel Anu Xitel 100 50 225 Bijay Xitel 200 125 Chetan Yocel 50 175 250 150 Deepak Yocel 100 150 275 100 Eshan Yocel 100 100 375 Faruq Yocel 0 100 150 It is known that the duration of calls from Faruq to Eshan was 200 minutes. Also, there were no calls from: i. Bijay to Eshan, ii. Chetan to Anu and Chetan to Deepak, iii. Deepak to Bijay and Deepak to Faruq, iv. Eshan to Chetan and Eshan to Deepak.

What was the total duration of calls (in minutes) made by Anu to friends having mobile numbers from

Q8CAT 2025 · Slot 3 · CAT Medium · TITA✓ Answer verified

Mobile Calls | DILR CAT 2025 Slot 3 | Caselet | Moderate

Anu, Bijay, Chetan, Deepak, Eshan, and Faruq are six friends. Each of them uses a mobile number from exactly one of the two mobile operators − Xitel and Yocel. During the last month, the six friends made several calls to each other. Each call was made by one of these six friends to another. The table below summarizes the number of minutes of calls that each of the six made to (outgoing minutes) and received from (incoming minutes) these friends, grouped by the operators. Some of the entries are missing. Friend Operator Outgoing minutes to Operator Incoming minutes from Operator Xitel Yocel Xitel Yocel Anu Xitel 100 50 225 Bijay Xitel 200 125 Chetan Yocel 50 175 250 150 Deepak Yocel 100 150 275 100 Eshan Yocel 100 100 375 Faruq Yocel 0 100 150 It is known that the duration of calls from Faruq to Eshan was 200 minutes. Also, there were no calls from: i. Bijay to Eshan, ii. Chetan to Anu and Chetan to Deepak, iii. Deepak to Bijay and Deepak to Faruq, iv. Eshan to Chetan and Eshan to Deepak.

What was the total duration of calls (in minutes) made by Faruq to friends having mobile numbers from Operator Yocel?

Q9CAT 2025 · Slot 3 · CAT Medium✓ Answer verified

Mobile Calls | DILR CAT 2025 Slot 3 | Caselet | Moderate

Anu, Bijay, Chetan, Deepak, Eshan, and Faruq are six friends. Each of them uses a mobile number from exactly one of the two mobile operators − Xitel and Yocel. During the last month, the six friends made several calls to each other. Each call was made by one of these six friends to another. The table below summarizes the number of minutes of calls that each of the six made to (outgoing minutes) and received from (incoming minutes) these friends, grouped by the operators. Some of the entries are missing. Friend Operator Outgoing minutes to Operator Incoming minutes from Operator Xitel Yocel Xitel Yocel Anu Xitel 100 50 225 Bijay Xitel 200 125 Chetan Yocel 50 175 250 150 Deepak Yocel 100 150 275 100 Eshan Yocel 100 100 375 Faruq Yocel 0 100 150 It is known that the duration of calls from Faruq to Eshan was 200 minutes. Also, there were no calls from: i. Bijay to Eshan, ii. Chetan to Anu and Chetan to Deepak, iii. Deepak to Bijay and Deepak to Faruq, iv. Eshan to Chetan and Eshan to Deepak.

What was the duration of calls (in minutes) from Deepak to Chetan?

Q10CAT 2025 · Slot 3 · CAT Hard · TITA✓ Answer verified

Trade Network | DILR CAT 2025 Slot 3 | Caselet | Hard

Three countries — Pumpland (P), Xiland (X) and Cheeseland (C) — trade among themselves and with the (other countries in) Rest of World (ROW). All trade volumes are given in IC (international currency). The following terminology is used: • Trade balance = Exports – Imports • Total trade = Exports + Imports • Normalized trade balance = Trade balance / Total trade, expressed in percentage terms The following information is known. 1. The normalized trade balances of P, X and C are 0%, 10%, and –20%, respectively. 2. 40% of exports of X are to P. 22% of imports of P are from X. 3. 90% of exports of C are to P; 4% are to ROW. 4. 12% of exports of ROW are to X, 40% are to P. 5. The export volumes of P, in IC, to X and C are 600 and 1200, respectively. P is the only country that exports to C.

How much is exported from C to X, in IC?

Q11CAT 2025 · Slot 3 · CAT Hard · TITA✓ Answer verified

Trade Network | DILR CAT 2025 Slot 3 | Caselet | Hard

Three countries — Pumpland (P), Xiland (X) and Cheeseland (C) — trade among themselves and with the (other countries in) Rest of World (ROW). All trade volumes are given in IC (international currency). The following terminology is used: • Trade balance = Exports – Imports • Total trade = Exports + Imports • Normalized trade balance = Trade balance / Total trade, expressed in percentage terms The following information is known. 1. The normalized trade balances of P, X and C are 0%, 10%, and –20%, respectively. 2. 40% of exports of X are to P. 22% of imports of P are from X. 3. 90% of exports of C are to P; 4% are to ROW. 4. 12% of exports of ROW are to X, 40% are to P. 5. The export volumes of P, in IC, to X and C are 600 and 1200, respectively. P is the only country that exports to C.

How much is exported from P to ROW, in IC?

Q12CAT 2025 · Slot 3 · CAT Hard · TITA✓ Answer verified

Trade Network | DILR CAT 2025 Slot 3 | Caselet | Hard

Three countries — Pumpland (P), Xiland (X) and Cheeseland (C) — trade among themselves and with the (other countries in) Rest of World (ROW). All trade volumes are given in IC (international currency). The following terminology is used: • Trade balance = Exports – Imports • Total trade = Exports + Imports • Normalized trade balance = Trade balance / Total trade, expressed in percentage terms The following information is known. 1. The normalized trade balances of P, X and C are 0%, 10%, and –20%, respectively. 2. 40% of exports of X are to P. 22% of imports of P are from X. 3. 90% of exports of C are to P; 4% are to ROW. 4. 12% of exports of ROW are to X, 40% are to P. 5. The export volumes of P, in IC, to X and C are 600 and 1200, respectively. P is the only country that exports to C.

How much is exported from ROW to ROW, in IC?

Q13CAT 2025 · Slot 3 · CAT Hard✓ Answer verified

Trade Network | DILR CAT 2025 Slot 3 | Caselet | Hard

Three countries — Pumpland (P), Xiland (X) and Cheeseland (C) — trade among themselves and with the (other countries in) Rest of World (ROW). All trade volumes are given in IC (international currency). The following terminology is used: • Trade balance = Exports – Imports • Total trade = Exports + Imports • Normalized trade balance = Trade balance / Total trade, expressed in percentage terms The following information is known. 1. The normalized trade balances of P, X and C are 0%, 10%, and –20%, respectively. 2. 40% of exports of X are to P. 22% of imports of P are from X. 3. 90% of exports of C are to P; 4% are to ROW. 4. 12% of exports of ROW are to X, 40% are to P. 5. The export volumes of P, in IC, to X and C are 600 and 1200, respectively. P is the only country that exports to C.

What is the trade balance of ROW?

Q14CAT 2025 · Slot 3 · CAT Hard✓ Answer verified

Trade Network | DILR CAT 2025 Slot 3 | Caselet | Hard

Three countries — Pumpland (P), Xiland (X) and Cheeseland (C) — trade among themselves and with the (other countries in) Rest of World (ROW). All trade volumes are given in IC (international currency). The following terminology is used: • Trade balance = Exports – Imports • Total trade = Exports + Imports • Normalized trade balance = Trade balance / Total trade, expressed in percentage terms The following information is known. 1. The normalized trade balances of P, X and C are 0%, 10%, and –20%, respectively. 2. 40% of exports of X are to P. 22% of imports of P are from X. 3. 90% of exports of C are to P; 4% are to ROW. 4. 12% of exports of ROW are to X, 40% are to P. 5. The export volumes of P, in IC, to X and C are 600 and 1200, respectively. P is the only country that exports to C.

Which among the countries P, X, and C has/have the least total trade?

Q15CAT 2024✓ Answer verified

Elections

Two students, Amiya and Ramya are the only candidates in an election for the position of class representative. Students will vote based on the intensity level of Amiya's and Ramya's campaigns and the type of campaigns they run. Each campaign is said to have a level of 1 if it is a staid campaign and a level of 2 if it is a vigorous campaign. Campaigns can be of two types, they can either focus on issues, or on attacking the other candidate. If Amiya and Ramya both run campaigns focusing on issues, then The percentage of students voting in the election will be 20 times the sum of the levels of campaigning of the two students. For example, if Amiya and Ramya both run vigorous campaigns, then 20 × (2 + 2)%, that is, 80% of the students will vote in the election. Among voting students, the percentage of votes for each candidate will be proportional to the levels of their campaigns. For example, if Amiya runs a staid (i.e., level 1) campaign while Ramya runs a vigorous (i.e., level 2) campaign, then Amiya will receive 1/3 of the votes cast, and Ramya will receive the other 2/3. The above-mentioned percentages change as follows if at least one of them runs a campaign attacking their opponent. If Amiya runs a campaign attacking Ramya and Ramya runs a campaign focusing on issues, then 10% of the students who would have otherwise voted for Amiya will vote for Ramya, and another 10% who would have otherwise voted for Amiya, will not vote at all. If Ramya runs a campaign attacking Amiya and Amiya runs a campaign focusing on issues, then 20% of the students who would have otherwise voted for Ramya will vote for Amiya, and another 5% who would have otherwise voted for Ramya, will not vote at all. If both run campaigns attacking each other, then 10% of the students who would have otherwise voted for them had they run campaigns focusing on issues, will not vote at all.

If both of them run staid campaigns attacking the other, then what percentage of students will vote in the election?

Q16CAT 2024✓ Answer verified

Elections

Two students, Amiya and Ramya are the only candidates in an election for the position of class representative. Students will vote based on the intensity level of Amiya's and Ramya's campaigns and the type of campaigns they run. Each campaign is said to have a level of 1 if it is a staid campaign and a level of 2 if it is a vigorous campaign. Campaigns can be of two types, they can either focus on issues, or on attacking the other candidate. If Amiya and Ramya both run campaigns focusing on issues, then The percentage of students voting in the election will be 20 times the sum of the levels of campaigning of the two students. For example, if Amiya and Ramya both run vigorous campaigns, then 20 × (2 + 2)%, that is, 80% of the students will vote in the election. Among voting students, the percentage of votes for each candidate will be proportional to the levels of their campaigns. For example, if Amiya runs a staid (i.e., level 1) campaign while Ramya runs a vigorous (i.e., level 2) campaign, then Amiya will receive 1/3 of the votes cast, and Ramya will receive the other 2/3. The above-mentioned percentages change as follows if at least one of them runs a campaign attacking their opponent. If Amiya runs a campaign attacking Ramya and Ramya runs a campaign focusing on issues, then 10% of the students who would have otherwise voted for Amiya will vote for Ramya, and another 10% who would have otherwise voted for Amiya, will not vote at all. If Ramya runs a campaign attacking Amiya and Amiya runs a campaign focusing on issues, then 20% of the students who would have otherwise voted for Ramya will vote for Amiya, and another 5% who would have otherwise voted for Ramya, will not vote at all. If both run campaigns attacking each other, then 10% of the students who would have otherwise voted for them had they run campaigns focusing on issues, will not vote at all.

What is the minimum percentage of students who will vote in the election?

Q17CAT 2024

Elections

Two students, Amiya and Ramya are the only candidates in an election for the position of class representative. Students will vote based on the intensity level of Amiya's and Ramya's campaigns and the type of campaigns they run. Each campaign is said to have a level of 1 if it is a staid campaign and a level of 2 if it is a vigorous campaign. Campaigns can be of two types, they can either focus on issues, or on attacking the other candidate. If Amiya and Ramya both run campaigns focusing on issues, then The percentage of students voting in the election will be 20 times the sum of the levels of campaigning of the two students. For example, if Amiya and Ramya both run vigorous campaigns, then 20 × (2 + 2)%, that is, 80% of the students will vote in the election. Among voting students, the percentage of votes for each candidate will be proportional to the levels of their campaigns. For example, if Amiya runs a staid (i.e., level 1) campaign while Ramya runs a vigorous (i.e., level 2) campaign, then Amiya will receive 1/3 of the votes cast, and Ramya will receive the other 2/3. The above-mentioned percentages change as follows if at least one of them runs a campaign attacking their opponent. If Amiya runs a campaign attacking Ramya and Ramya runs a campaign focusing on issues, then 10% of the students who would have otherwise voted for Amiya will vote for Ramya, and another 10% who would have otherwise voted for Amiya, will not vote at all. If Ramya runs a campaign attacking Amiya and Amiya runs a campaign focusing on issues, then 20% of the students who would have otherwise voted for Ramya will vote for Amiya, and another 5% who would have otherwise voted for Ramya, will not vote at all. If both run campaigns attacking each other, then 10% of the students who would have otherwise voted for them had they run campaigns focusing on issues, will not vote at all.

If Amiya runs a campaign focusing on issues, then what is the maximum percentage of votes that she can get?

Q18CAT 2024✓ Answer verified

Elections

Two students, Amiya and Ramya are the only candidates in an election for the position of class representative. Students will vote based on the intensity level of Amiya's and Ramya's campaigns and the type of campaigns they run. Each campaign is said to have a level of 1 if it is a staid campaign and a level of 2 if it is a vigorous campaign. Campaigns can be of two types, they can either focus on issues, or on attacking the other candidate. If Amiya and Ramya both run campaigns focusing on issues, then The percentage of students voting in the election will be 20 times the sum of the levels of campaigning of the two students. For example, if Amiya and Ramya both run vigorous campaigns, then 20 × (2 + 2)%, that is, 80% of the students will vote in the election. Among voting students, the percentage of votes for each candidate will be proportional to the levels of their campaigns. For example, if Amiya runs a staid (i.e., level 1) campaign while Ramya runs a vigorous (i.e., level 2) campaign, then Amiya will receive 1/3 of the votes cast, and Ramya will receive the other 2/3. The above-mentioned percentages change as follows if at least one of them runs a campaign attacking their opponent. If Amiya runs a campaign attacking Ramya and Ramya runs a campaign focusing on issues, then 10% of the students who would have otherwise voted for Amiya will vote for Ramya, and another 10% who would have otherwise voted for Amiya, will not vote at all. If Ramya runs a campaign attacking Amiya and Amiya runs a campaign focusing on issues, then 20% of the students who would have otherwise voted for Ramya will vote for Amiya, and another 5% who would have otherwise voted for Ramya, will not vote at all. If both run campaigns attacking each other, then 10% of the students who would have otherwise voted for them had they run campaigns focusing on issues, will not vote at all.

If Ramya runs a campaign attacking Amiya, then what is the minimum percentage of votes that she is guaranteed to get?

Q19CAT 2024✓ Answer verified

Elections

Two students, Amiya and Ramya are the only candidates in an election for the position of class representative. Students will vote based on the intensity level of Amiya's and Ramya's campaigns and the type of campaigns they run. Each campaign is said to have a level of 1 if it is a staid campaign and a level of 2 if it is a vigorous campaign. Campaigns can be of two types, they can either focus on issues, or on attacking the other candidate. If Amiya and Ramya both run campaigns focusing on issues, then The percentage of students voting in the election will be 20 times the sum of the levels of campaigning of the two students. For example, if Amiya and Ramya both run vigorous campaigns, then 20 × (2 + 2)%, that is, 80% of the students will vote in the election. Among voting students, the percentage of votes for each candidate will be proportional to the levels of their campaigns. For example, if Amiya runs a staid (i.e., level 1) campaign while Ramya runs a vigorous (i.e., level 2) campaign, then Amiya will receive 1/3 of the votes cast, and Ramya will receive the other 2/3. The above-mentioned percentages change as follows if at least one of them runs a campaign attacking their opponent. If Amiya runs a campaign attacking Ramya and Ramya runs a campaign focusing on issues, then 10% of the students who would have otherwise voted for Amiya will vote for Ramya, and another 10% who would have otherwise voted for Amiya, will not vote at all. If Ramya runs a campaign attacking Amiya and Amiya runs a campaign focusing on issues, then 20% of the students who would have otherwise voted for Ramya will vote for Amiya, and another 5% who would have otherwise voted for Ramya, will not vote at all. If both run campaigns attacking each other, then 10% of the students who would have otherwise voted for them had they run campaigns focusing on issues, will not vote at all.

What is the maximum possible voting margin with which one of the candidates can win?

Q20CAT 2024✓ Answer verified
The air-conditioner (AC) in a large room can be operated either in REGULAR mode or in POWER mode to reduce the temperature. If the AC operates in REGULAR mode, then it brings down the temperature inside the room (called inside temperature) at a constant rate to the set temperature in 1 hour. If it operates in POWER mode, then this is achieved in 30 minutes. If the AC is switched off, then the inside temperature rises at a constant rate so as to reach the temperature outside at the time of switching off in 1 hour. The temperature outside has been falling at a constant rate from 7 pm onward until 3 am on a particular night. The following graph shows the inside temperature between 11 pm (23:00) and 2 am (2:00) that night. The following facts are known about the AC operation that night. • The AC was turned on for the first time that night at 11 pm (23:00). • The AC setting was changed (including turning it on/off, and/or setting different temperatures) only at the beginning of the hour or at 30 minutes after the hour. • The AC was used in POWER mode for longer duration than in REGULAR mode during this 3-hour period.
Figure for this question

Q. 1 How many times the AC must have been turned off between 11:01 pm and 1:59 am?

Q21CAT 2024 · TITA✓ Answer verified
The air-conditioner (AC) in a large room can be operated either in REGULAR mode or in POWER mode to reduce the temperature. If the AC operates in REGULAR mode, then it brings down the temperature inside the room (called inside temperature) at a constant rate to the set temperature in 1 hour. If it operates in POWER mode, then this is achieved in 30 minutes. If the AC is switched off, then the inside temperature rises at a constant rate so as to reach the temperature outside at the time of switching off in 1 hour. The temperature outside has been falling at a constant rate from 7 pm onward until 3 am on a particular night. The following graph shows the inside temperature between 11 pm (23:00) and 2 am (2:00) that night. The following facts are known about the AC operation that night. • The AC was turned on for the first time that night at 11 pm (23:00). • The AC setting was changed (including turning it on/off, and/or setting different temperatures) only at the beginning of the hour or at 30 minutes after the hour. • The AC was used in POWER mode for longer duration than in REGULAR mode during this 3-hour period.
Figure for this question

Q. 2 What was the temperature outside, in degree Celsius, at 1 am?

Q22CAT 2024 · TITA✓ Answer verified
The air-conditioner (AC) in a large room can be operated either in REGULAR mode or in POWER mode to reduce the temperature. If the AC operates in REGULAR mode, then it brings down the temperature inside the room (called inside temperature) at a constant rate to the set temperature in 1 hour. If it operates in POWER mode, then this is achieved in 30 minutes. If the AC is switched off, then the inside temperature rises at a constant rate so as to reach the temperature outside at the time of switching off in 1 hour. The temperature outside has been falling at a constant rate from 7 pm onward until 3 am on a particular night. The following graph shows the inside temperature between 11 pm (23:00) and 2 am (2:00) that night. The following facts are known about the AC operation that night. • The AC was turned on for the first time that night at 11 pm (23:00). • The AC setting was changed (including turning it on/off, and/or setting different temperatures) only at the beginning of the hour or at 30 minutes after the hour. • The AC was used in POWER mode for longer duration than in REGULAR mode during this 3-hour period.
Figure for this question

Q. 3 What was the temperature outside, in degree Celsius, at 9 pm?

Q23CAT 2024✓ Answer verified
The air-conditioner (AC) in a large room can be operated either in REGULAR mode or in POWER mode to reduce the temperature. If the AC operates in REGULAR mode, then it brings down the temperature inside the room (called inside temperature) at a constant rate to the set temperature in 1 hour. If it operates in POWER mode, then this is achieved in 30 minutes. If the AC is switched off, then the inside temperature rises at a constant rate so as to reach the temperature outside at the time of switching off in 1 hour. The temperature outside has been falling at a constant rate from 7 pm onward until 3 am on a particular night. The following graph shows the inside temperature between 11 pm (23:00) and 2 am (2:00) that night. The following facts are known about the AC operation that night. • The AC was turned on for the first time that night at 11 pm (23:00). • The AC setting was changed (including turning it on/off, and/or setting different temperatures) only at the beginning of the hour or at 30 minutes after the hour. • The AC was used in POWER mode for longer duration than in REGULAR mode during this 3-hour period.
Figure for this question

Q. 4 What best can be concluded about the number of times the AC must have either been turned on or the AC temperature setting been altered between 11:01 pm and 1:59 am?

Q24CAT 2024 · TITA✓ Answer verified
The air-conditioner (AC) in a large room can be operated either in REGULAR mode or in POWER mode to reduce the temperature. If the AC operates in REGULAR mode, then it brings down the temperature inside the room (called inside temperature) at a constant rate to the set temperature in 1 hour. If it operates in POWER mode, then this is achieved in 30 minutes. If the AC is switched off, then the inside temperature rises at a constant rate so as to reach the temperature outside at the time of switching off in 1 hour. The temperature outside has been falling at a constant rate from 7 pm onward until 3 am on a particular night. The following graph shows the inside temperature between 11 pm (23:00) and 2 am (2:00) that night. The following facts are known about the AC operation that night. • The AC was turned on for the first time that night at 11 pm (23:00). • The AC setting was changed (including turning it on/off, and/or setting different temperatures) only at the beginning of the hour or at 30 minutes after the hour. • The AC was used in POWER mode for longer duration than in REGULAR mode during this 3-hour period.
Figure for this question

Q. 5 What was the maximum difference between temperature outside and inside temperature, in degree Celsius, between 11:01 pm and 1:59 am?

Q25CAT 2024 · TITA✓ Answer verified
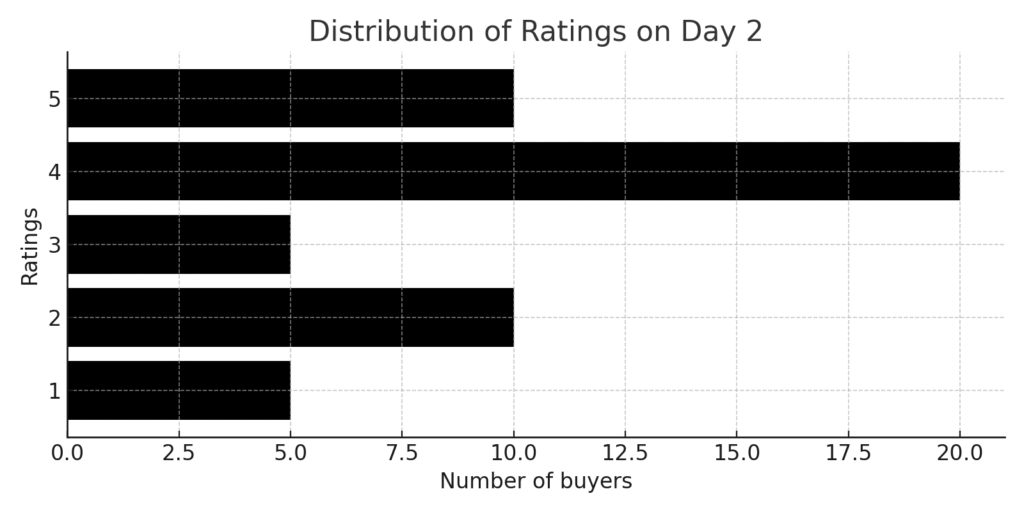
An online e-commerce firm receives daily integer product ratings from 1 through 5 given by buyers. The daily average is the average of the ratings given on that day. The cumulative average is the average of all ratings given on or before that day. The rating system began on Day 1, and the cumulative averages were 3 and 3.1 at the end of Day 1 and Day 2, respectively. The distribution of ratings on Day 2 is given in the figure below. The following information is known about ratings on Day 3. 100 buyers gave product ratings on Day 3. The modes of the product ratings were 4 and 5. The numbers of buyers giving each product rating are non-zero multiples of 10. The same number of buyers gave product ratings of 1 and 2, and that number is half the number of buyers who gave a rating of 3.
Figure for this question

Q. 1 How many buyers gave ratings on Day 1?

Q26CAT 2024✓ Answer verified
An online e-commerce firm receives daily integer product ratings from 1 through 5 given by buyers. The daily average is the average of the ratings given on that day. The cumulative average is the average of all ratings given on or before that day. The rating system began on Day 1, and the cumulative averages were 3 and 3.1 at the end of Day 1 and Day 2, respectively. The distribution of ratings on Day 2 is given in the figure below. The following information is known about ratings on Day 3. 100 buyers gave product ratings on Day 3. The modes of the product ratings were 4 and 5. The numbers of buyers giving each product rating are non-zero multiples of 10. The same number of buyers gave product ratings of 1 and 2, and that number is half the number of buyers who gave a rating of 3.
Figure for this question

Q. 2 What is the daily average rating of Day 3?

Q27CAT 2024 · TITA✓ Answer verified
An online e-commerce firm receives daily integer product ratings from 1 through 5 given by buyers. The daily average is the average of the ratings given on that day. The cumulative average is the average of all ratings given on or before that day. The rating system began on Day 1, and the cumulative averages were 3 and 3.1 at the end of Day 1 and Day 2, respectively. The distribution of ratings on Day 2 is given in the figure below. The following information is known about ratings on Day 3. 100 buyers gave product ratings on Day 3. The modes of the product ratings were 4 and 5. The numbers of buyers giving each product rating are non-zero multiples of 10. The same number of buyers gave product ratings of 1 and 2, and that number is half the number of buyers who gave a rating of 3.
Figure for this question

Q. 3 What is the median of all ratings given on Day 3?

Q28CAT 2024✓ Answer verified
An online e-commerce firm receives daily integer product ratings from 1 through 5 given by buyers. The daily average is the average of the ratings given on that day. The cumulative average is the average of all ratings given on or before that day. The rating system began on Day 1, and the cumulative averages were 3 and 3.1 at the end of Day 1 and Day 2, respectively. The distribution of ratings on Day 2 is given in the figure below. The following information is known about ratings on Day 3. 100 buyers gave product ratings on Day 3. The modes of the product ratings were 4 and 5. The numbers of buyers giving each product rating are non-zero multiples of 10. The same number of buyers gave product ratings of 1 and 2, and that number is half the number of buyers who gave a rating of 3.
Figure for this question

Q. 4 Which of the following is true about the cumulative average ratings of Day 2 and Day 3?

Q29CAT 2024✓ Answer verified

Subscribers

Answer the questions on the basis of the information given below. Over the top (OTT) subscribers of a platform are segregated into three categories: i) Kid, ii) Elder, and iii) Others. Some of the subscribers used one app and the others used multiple apps to access the platform. The figure below shows the percentage of the total number of subscribers in 2023 and 2024 who belong to the 'Kid' and 'Elder' categories. The following additional facts are known about the numbers of subscribers. The total number of subscribers increased by 10% from 2023 to 2024. In 2024, 1/2 of the subscribers from the 'Kid' category and 2/3 of the subscribers from the 'Elder' category subscribers use one app. In 2023, the number of subscribers from the 'Kid' category who used multiple apps was the same as the number of subscribers from the 'Elder' category who used one app. 10,000 subscribers from the 'Kid' category used one app and 15,000 subscribers from the 'Elder' category used multiple apps in 2023.
Figure for this question

How many subscribers belonged to the 'Others' category in 2024?

Q30CAT 2024✓ Answer verified

Subscribers

Answer the questions on the basis of the information given below. Over the top (OTT) subscribers of a platform are segregated into three categories: i) Kid, ii) Elder, and iii) Others. Some of the subscribers used one app and the others used multiple apps to access the platform. The figure below shows the percentage of the total number of subscribers in 2023 and 2024 who belong to the 'Kid' and 'Elder' categories. The following additional facts are known about the numbers of subscribers. The total number of subscribers increased by 10% from 2023 to 2024. In 2024, 1/2 of the subscribers from the 'Kid' category and 2/3 of the subscribers from the 'Elder' category subscribers use one app. In 2023, the number of subscribers from the 'Kid' category who used multiple apps was the same as the number of subscribers from the 'Elder' category who used one app. 10,000 subscribers from the 'Kid' category used one app and 15,000 subscribers from the 'Elder' category used multiple apps in 2023.
Figure for this question

What percentage of subscribers in the 'Kid' category used multiple apps in 2023?

Q31CAT 2024✓ Answer verified

Subscribers

Answer the questions on the basis of the information given below. Over the top (OTT) subscribers of a platform are segregated into three categories: i) Kid, ii) Elder, and iii) Others. Some of the subscribers used one app and the others used multiple apps to access the platform. The figure below shows the percentage of the total number of subscribers in 2023 and 2024 who belong to the 'Kid' and 'Elder' categories. The following additional facts are known about the numbers of subscribers. The total number of subscribers increased by 10% from 2023 to 2024. In 2024, 1/2 of the subscribers from the 'Kid' category and 2/3 of the subscribers from the 'Elder' category subscribers use one app. In 2023, the number of subscribers from the 'Kid' category who used multiple apps was the same as the number of subscribers from the 'Elder' category who used one app. 10,000 subscribers from the 'Kid' category used one app and 15,000 subscribers from the 'Elder' category used multiple apps in 2023.
Figure for this question

What was the percentage increase in the number of subscribers in the 'Elder' category from 2023 to 2024?

Q32CAT 2024✓ Answer verified

Subscribers

Answer the questions on the basis of the information given below. Over the top (OTT) subscribers of a platform are segregated into three categories: i) Kid, ii) Elder, and iii) Others. Some of the subscribers used one app and the others used multiple apps to access the platform. The figure below shows the percentage of the total number of subscribers in 2023 and 2024 who belong to the 'Kid' and 'Elder' categories. The following additional facts are known about the numbers of subscribers. The total number of subscribers increased by 10% from 2023 to 2024. In 2024, 1/2 of the subscribers from the 'Kid' category and 2/3 of the subscribers from the 'Elder' category subscribers use one app. In 2023, the number of subscribers from the 'Kid' category who used multiple apps was the same as the number of subscribers from the 'Elder' category who used one app. 10,000 subscribers from the 'Kid' category used one app and 15,000 subscribers from the 'Elder' category used multiple apps in 2023.
Figure for this question

What could be the minimum percentage of subscribers who used multiple apps in 2024?

Q33CAT 2023 · Slot 3 · TITA✓ Answer verified
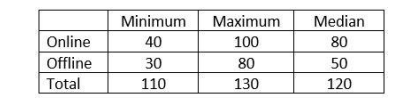
Comprehension: In a coaching class, some students register online, and some others register offline. No student registers both online and offline; hence the total registration number is the sum of online and offline registrations. The following facts and table pertain to these registration numbers for the five months – January to May of 2023. The table shows the minimum, maximum, median registration numbers of these five months, separately for online, offline and total number of registrations. The following additional facts are known. In every month, both online and offline registration numbers were multiples of 10. In January, the number of offline registrations was twice that of online registrations. In April, the number of online registrations was twice that of offline registrations. The number of online registrations in March was the same as the number of offline registrations in February. The number of online registrations was the largest in May
Figure for this question

Q.16 What was the total number of registrations in April?

Q34CAT 2023 · Slot 3 · TITA✓ Answer verified
Comprehension: In a coaching class, some students register online, and some others register offline. No student registers both online and offline; hence the total registration number is the sum of online and offline registrations. The following facts and table pertain to these registration numbers for the five months – January to May of 2023. The table shows the minimum, maximum, median registration numbers of these five months, separately for online, offline and total number of registrations. The following additional facts are known. In every month, both online and offline registration numbers were multiples of 10. In January, the number of offline registrations was twice that of online registrations. In April, the number of online registrations was twice that of offline registrations. The number of online registrations in March was the same as the number of offline registrations in February. The number of online registrations was the largest in May
Figure for this question

Q.17 What was the number of online registrations in January?

Q35CAT 2023 · Slot 3✓ Answer verified
Comprehension: In a coaching class, some students register online, and some others register offline. No student registers both online and offline; hence the total registration number is the sum of online and offline registrations. The following facts and table pertain to these registration numbers for the five months – January to May of 2023. The table shows the minimum, maximum, median registration numbers of these five months, separately for online, offline and total number of registrations. The following additional facts are known. In every month, both online and offline registration numbers were multiples of 10. In January, the number of offline registrations was twice that of online registrations. In April, the number of online registrations was twice that of offline registrations. The number of online registrations in March was the same as the number of offline registrations in February. The number of online registrations was the largest in May
Figure for this question

Q.18 Which of the following statements can be true? I. The number of offline registrations was the smallest in May. II. The total number of registrations was the smallest in February.

Q36CAT 2023 · Slot 3✓ Answer verified
Comprehension: In a coaching class, some students register online, and some others register offline. No student registers both online and offline; hence the total registration number is the sum of online and offline registrations. The following facts and table pertain to these registration numbers for the five months – January to May of 2023. The table shows the minimum, maximum, median registration numbers of these five months, separately for online, offline and total number of registrations. The following additional facts are known. In every month, both online and offline registration numbers were multiples of 10. In January, the number of offline registrations was twice that of online registrations. In April, the number of online registrations was twice that of offline registrations. The number of online registrations in March was the same as the number of offline registrations in February. The number of online registrations was the largest in May
Figure for this question

Q.19 What best can be concluded about the number of offline registrations in February?

Q37CAT 2023 · Slot 3✓ Answer verified
Comprehension: In a coaching class, some students register online, and some others register offline. No student registers both online and offline; hence the total registration number is the sum of online and offline registrations. The following facts and table pertain to these registration numbers for the five months – January to May of 2023. The table shows the minimum, maximum, median registration numbers of these five months, separately for online, offline and total number of registrations. The following additional facts are known. In every month, both online and offline registration numbers were multiples of 10. In January, the number of offline registrations was twice that of online registrations. In April, the number of online registrations was twice that of offline registrations. The number of online registrations in March was the same as the number of offline registrations in February. The number of online registrations was the largest in May
Figure for this question

Q.20 Which pair of months definitely had the same total number of registrations? I. January and April II. February and May

Q38CAT 2023 · Slot 2✓ Answer verified
1-5. Odsville has five firms – Alfloo, Bzygoo, Czechy, Drjbna and Elavalaki. Each of these firms was founded in some year and also closed down a few years later. Each firm raised Rs. 1 crore in its first and last year of existence. The amount each firm raised every year increased until it reached a maximum, and then decreased until the firm closed down. No firm raised the same amount of money in two consecutive years. Each annual increase and decrease was either by Rs. 1 crore or by Rs. 2 crores. The table below provides partial information about the five firms
Figure for this question

Q1. For which firm(s) can the amounts raised by them be concluded with certainty in each year?

Q39CAT 2023 · Slot 2✓ Answer verified
1-5. Odsville has five firms – Alfloo, Bzygoo, Czechy, Drjbna and Elavalaki. Each of these firms was founded in some year and also closed down a few years later. Each firm raised Rs. 1 crore in its first and last year of existence. The amount each firm raised every year increased until it reached a maximum, and then decreased until the firm closed down. No firm raised the same amount of money in two consecutive years. Each annual increase and decrease was either by Rs. 1 crore or by Rs. 2 crores. The table below provides partial information about the five firms
Figure for this question

Q2. What best can be concluded about the total amount of money raised in 2015?

Q40CAT 2023 · Slot 2 · TITA✓ Answer verified
1-5. Odsville has five firms – Alfloo, Bzygoo, Czechy, Drjbna and Elavalaki. Each of these firms was founded in some year and also closed down a few years later. Each firm raised Rs. 1 crore in its first and last year of existence. The amount each firm raised every year increased until it reached a maximum, and then decreased until the firm closed down. No firm raised the same amount of money in two consecutive years. Each annual increase and decrease was either by Rs. 1 crore or by Rs. 2 crores. The table below provides partial information about the five firms
Figure for this question

Q3. What is the largest possible total amount of money (in Rs. crores) that could have been raised in 2013?

Q41CAT 2023 · Slot 2✓ Answer verified
1-5. Odsville has five firms – Alfloo, Bzygoo, Czechy, Drjbna and Elavalaki. Each of these firms was founded in some year and also closed down a few years later. Each firm raised Rs. 1 crore in its first and last year of existence. The amount each firm raised every year increased until it reached a maximum, and then decreased until the firm closed down. No firm raised the same amount of money in two consecutive years. Each annual increase and decrease was either by Rs. 1 crore or by Rs. 2 crores. The table below provides partial information about the five firms
Figure for this question

Q4. If Elavalaki raised Rs. 3 crores in 2013, then what is the smallest possible total amount of money (in Rs. crores) that could have been raised by all the companies in 2012?

Q42CAT 2023 · Slot 2
1-5. Odsville has five firms – Alfloo, Bzygoo, Czechy, Drjbna and Elavalaki. Each of these firms was founded in some year and also closed down a few years later. Each firm raised Rs. 1 crore in its first and last year of existence. The amount each firm raised every year increased until it reached a maximum, and then decreased until the firm closed down. No firm raised the same amount of money in two consecutive years. Each annual increase and decrease was either by Rs. 1 crore or by Rs. 2 crores. The table below provides partial information about the five firms
Figure for this question

Q5 If the total amount of money raised in 2014 is Rs. 12 crores, then which of the following is not possible?

Q43CAT 2022 · Slot 3✓ Answer verified

Students

All the first-year students in the computer science (CS) department in a university take both the courses (i) AI and (ii) ML. Students from other departments (non-CS students) can also take one of these two courses, but not both. Students who fail in a course get an F grade; others pass and are awarded A or B or C grades depending on their performance. The following are some additional facts about the number of students who took these two courses this year and the grades they obtained. 1. The numbers of non-CS students who took AI and ML were in the ratio 2 : 5. 2. The number of non-CS students who took either AI or ML was equal to the number of CS students. 3. The numbers of non-CS students who failed in the two courses were the same and their total is equal to the number of CS students who got a C grade in ML. 4. In both the courses, 50% of the students who passed got a B grade. But, while the numbers of students who got A and C grades were the same for AI, they were in the ratio 3 : 2 for ML. 5. No CS student failed in AI, while no non-CS student got an A grade in AI. 6. The numbers of CS students who got A, B and C grades respectively in AI were in the ratio 3 : 5 : 2, while in ML the ratio was 4 : 5 : 2. 7. The ratio of the total number of non-CS students failing in one of the two courses to the number of CS students failing in one of the two courses was 3 : 1. 8. 30 students failed in ML.

How many students took AI?

Q44CAT 2022 · Slot 3 · TITA✓ Answer verified

Students

All the first-year students in the computer science (CS) department in a university take both the courses (i) AI and (ii) ML. Students from other departments (non-CS students) can also take one of these two courses, but not both. Students who fail in a course get an F grade; others pass and are awarded A or B or C grades depending on their performance. The following are some additional facts about the number of students who took these two courses this year and the grades they obtained. 1. The numbers of non-CS students who took AI and ML were in the ratio 2 : 5. 2. The number of non-CS students who took either AI or ML was equal to the number of CS students. 3. The numbers of non-CS students who failed in the two courses were the same and their total is equal to the number of CS students who got a C grade in ML. 4. In both the courses, 50% of the students who passed got a B grade. But, while the numbers of students who got A and C grades were the same for AI, they were in the ratio 3 : 2 for ML. 5. No CS student failed in AI, while no non-CS student got an A grade in AI. 6. The numbers of CS students who got A, B and C grades respectively in AI were in the ratio 3 : 5 : 2, while in ML the ratio was 4 : 5 : 2. 7. The ratio of the total number of non-CS students failing in one of the two courses to the number of CS students failing in one of the two courses was 3 : 1. 8. 30 students failed in ML.

How many CS students failed in ML? ___

Q45CAT 2022 · Slot 3 · TITA✓ Answer verified

Students

All the first-year students in the computer science (CS) department in a university take both the courses (i) AI and (ii) ML. Students from other departments (non-CS students) can also take one of these two courses, but not both. Students who fail in a course get an F grade; others pass and are awarded A or B or C grades depending on their performance. The following are some additional facts about the number of students who took these two courses this year and the grades they obtained. 1. The numbers of non-CS students who took AI and ML were in the ratio 2 : 5. 2. The number of non-CS students who took either AI or ML was equal to the number of CS students. 3. The numbers of non-CS students who failed in the two courses were the same and their total is equal to the number of CS students who got a C grade in ML. 4. In both the courses, 50% of the students who passed got a B grade. But, while the numbers of students who got A and C grades were the same for AI, they were in the ratio 3 : 2 for ML. 5. No CS student failed in AI, while no non-CS student got an A grade in AI. 6. The numbers of CS students who got A, B and C grades respectively in AI were in the ratio 3 : 5 : 2, while in ML the ratio was 4 : 5 : 2. 7. The ratio of the total number of non-CS students failing in one of the two courses to the number of CS students failing in one of the two courses was 3 : 1. 8. 30 students failed in ML.

How many non-CS students got A grade in ML? ___

Q46CAT 2022 · Slot 3✓ Answer verified

Students

All the first-year students in the computer science (CS) department in a university take both the courses (i) AI and (ii) ML. Students from other departments (non-CS students) can also take one of these two courses, but not both. Students who fail in a course get an F grade; others pass and are awarded A or B or C grades depending on their performance. The following are some additional facts about the number of students who took these two courses this year and the grades they obtained. 1. The numbers of non-CS students who took AI and ML were in the ratio 2 : 5. 2. The number of non-CS students who took either AI or ML was equal to the number of CS students. 3. The numbers of non-CS students who failed in the two courses were the same and their total is equal to the number of CS students who got a C grade in ML. 4. In both the courses, 50% of the students who passed got a B grade. But, while the numbers of students who got A and C grades were the same for AI, they were in the ratio 3 : 2 for ML. 5. No CS student failed in AI, while no non-CS student got an A grade in AI. 6. The numbers of CS students who got A, B and C grades respectively in AI were in the ratio 3 : 5 : 2, while in ML the ratio was 4 : 5 : 2. 7. The ratio of the total number of non-CS students failing in one of the two courses to the number of CS students failing in one of the two courses was 3 : 1. 8. 30 students failed in ML.

How many students got A grade in AI?

Q47CAT 2022 · Slot 3✓ Answer verified

Students

All the first-year students in the computer science (CS) department in a university take both the courses (i) AI and (ii) ML. Students from other departments (non-CS students) can also take one of these two courses, but not both. Students who fail in a course get an F grade; others pass and are awarded A or B or C grades depending on their performance. The following are some additional facts about the number of students who took these two courses this year and the grades they obtained. 1. The numbers of non-CS students who took AI and ML were in the ratio 2 : 5. 2. The number of non-CS students who took either AI or ML was equal to the number of CS students. 3. The numbers of non-CS students who failed in the two courses were the same and their total is equal to the number of CS students who got a C grade in ML. 4. In both the courses, 50% of the students who passed got a B grade. But, while the numbers of students who got A and C grades were the same for AI, they were in the ratio 3 : 2 for ML. 5. No CS student failed in AI, while no non-CS student got an A grade in AI. 6. The numbers of CS students who got A, B and C grades respectively in AI were in the ratio 3 : 5 : 2, while in ML the ratio was 4 : 5 : 2. 7. The ratio of the total number of non-CS students failing in one of the two courses to the number of CS students failing in one of the two courses was 3 : 1. 8. 30 students failed in ML.

How many non-CS students got B grade in ML?

Q48CAT 2022 · TITA✓ Answer verified
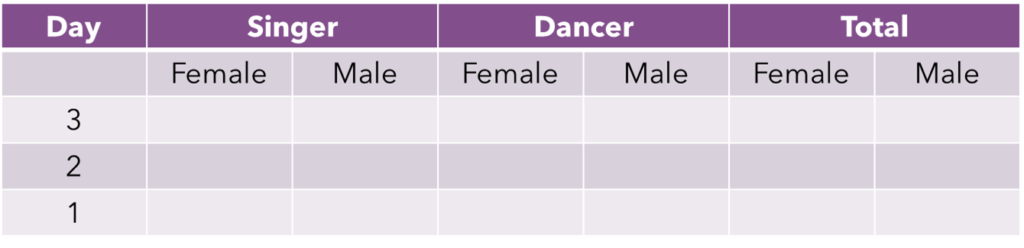
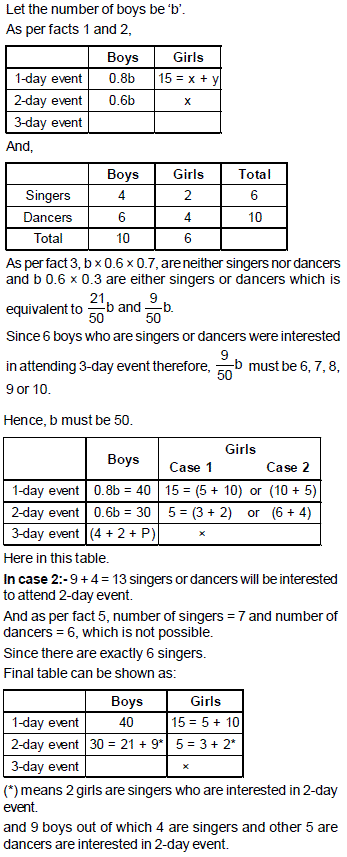
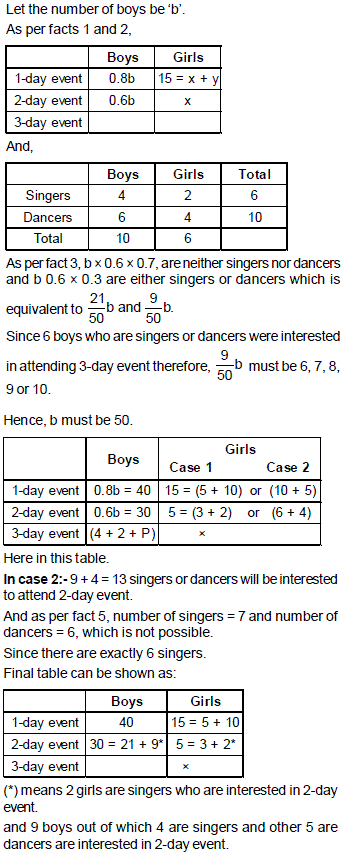
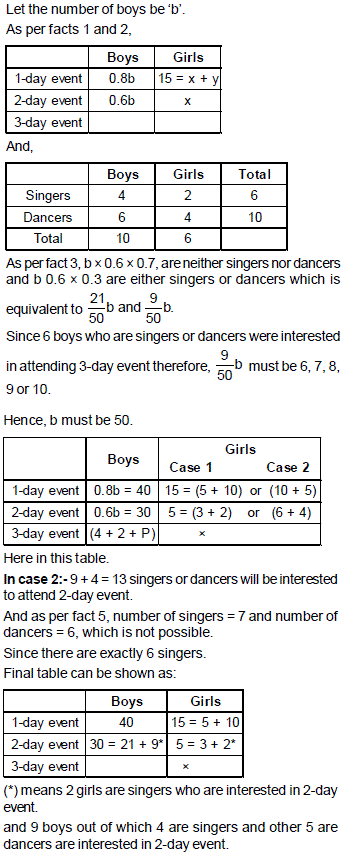
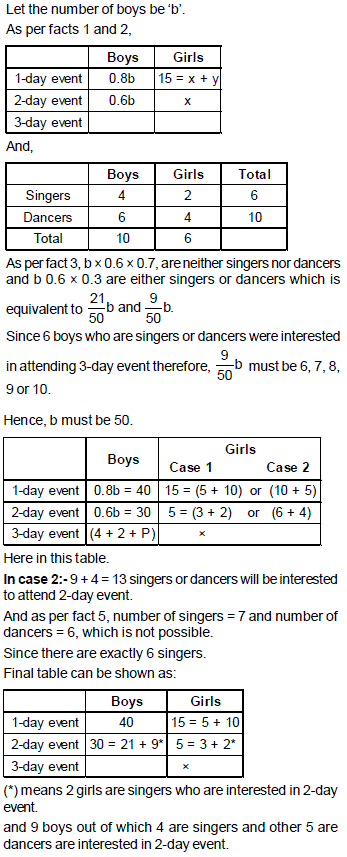
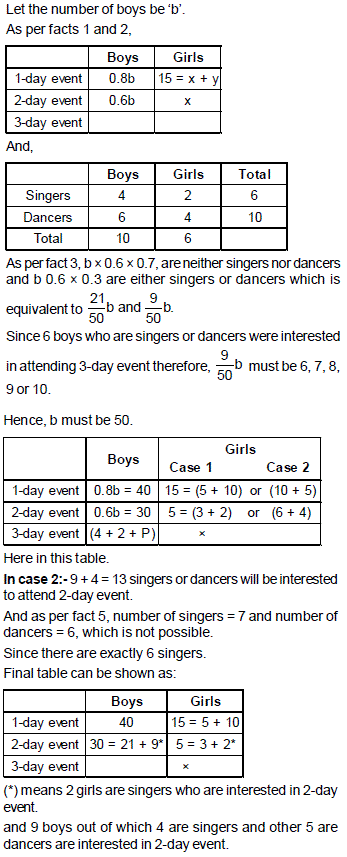
There are 15 girls and some boys among the graduating students in a class. They are planning a get-together, which can be either a 1-day event, or a 2-day event, or a 3-day event. There are 6 singers in the class, 4 of them are boys. There are 10 dancers in the class, 4 of them are girls. No dancer in the class is a singer. Some students are not interested in attending the gettogether. Those students who are interested in attending a 3-day event are also interested in attending a 2-day event; those who are interested in attending a 2-day event are also interested in attending a 1-day event. The following facts are also known: 1. All the girls and 80% of the boys are interested in attending a 1-day event. 60% of the boys are interested in attending a 2-day event. 2. Some of the girls are interested in attending a 1-day event, but not a 2-day event; some of the other girls are interested in attending both. 3. 70% of the boys who are interested in attending a 2-day event are neither singers nor dancers. 60% of the girls who are interested in attending a 2-day event are neither singers nor dancers. 4. No girl is interested in attending a 3-day event. All male singers and 2 of the dancers are interested in attending a 3-day event. 5. The number of singers interested in attending a 2-day event is one more than the number of dancers interested in attending a 2-day event.
Figure for this questionFigure for this questionFigure for this questionFigure for this questionFigure for this questionFigure for this question

Question 6- How many boys are there in the class?

Q49CAT 2022✓ Answer verified
There are 15 girls and some boys among the graduating students in a class. They are planning a get-together, which can be either a 1-day event, or a 2-day event, or a 3-day event. There are 6 singers in the class, 4 of them are boys. There are 10 dancers in the class, 4 of them are girls. No dancer in the class is a singer. Some students are not interested in attending the gettogether. Those students who are interested in attending a 3-day event are also interested in attending a 2-day event; those who are interested in attending a 2-day event are also interested in attending a 1-day event. The following facts are also known: 1. All the girls and 80% of the boys are interested in attending a 1-day event. 60% of the boys are interested in attending a 2-day event. 2. Some of the girls are interested in attending a 1-day event, but not a 2-day event; some of the other girls are interested in attending both. 3. 70% of the boys who are interested in attending a 2-day event are neither singers nor dancers. 60% of the girls who are interested in attending a 2-day event are neither singers nor dancers. 4. No girl is interested in attending a 3-day event. All male singers and 2 of the dancers are interested in attending a 3-day event. 5. The number of singers interested in attending a 2-day event is one more than the number of dancers interested in attending a 2-day event.
Figure for this questionFigure for this questionFigure for this questionFigure for this questionFigure for this questionFigure for this question

Which of the following can be determined from the given information? I. The number of boys who are interested in attending a 1-day event and are neither dancers nor singers. II. The number of female dancers who are interested in attending a 1-day event.

Q50CAT 2022✓ Answer verified
There are 15 girls and some boys among the graduating students in a class. They are planning a get-together, which can be either a 1-day event, or a 2-day event, or a 3-day event. There are 6 singers in the class, 4 of them are boys. There are 10 dancers in the class, 4 of them are girls. No dancer in the class is a singer. Some students are not interested in attending the gettogether. Those students who are interested in attending a 3-day event are also interested in attending a 2-day event; those who are interested in attending a 2-day event are also interested in attending a 1-day event. The following facts are also known: 1. All the girls and 80% of the boys are interested in attending a 1-day event. 60% of the boys are interested in attending a 2-day event. 2. Some of the girls are interested in attending a 1-day event, but not a 2-day event; some of the other girls are interested in attending both. 3. 70% of the boys who are interested in attending a 2-day event are neither singers nor dancers. 60% of the girls who are interested in attending a 2-day event are neither singers nor dancers. 4. No girl is interested in attending a 3-day event. All male singers and 2 of the dancers are interested in attending a 3-day event. 5. The number of singers interested in attending a 2-day event is one more than the number of dancers interested in attending a 2-day event.
Figure for this questionFigure for this questionFigure for this questionFigure for this questionFigure for this questionFigure for this question

What fraction of the class are interested in attending a 2-day event?

Q51CAT 2022✓ Answer verified
There are 15 girls and some boys among the graduating students in a class. They are planning a get-together, which can be either a 1-day event, or a 2-day event, or a 3-day event. There are 6 singers in the class, 4 of them are boys. There are 10 dancers in the class, 4 of them are girls. No dancer in the class is a singer. Some students are not interested in attending the gettogether. Those students who are interested in attending a 3-day event are also interested in attending a 2-day event; those who are interested in attending a 2-day event are also interested in attending a 1-day event. The following facts are also known: 1. All the girls and 80% of the boys are interested in attending a 1-day event. 60% of the boys are interested in attending a 2-day event. 2. Some of the girls are interested in attending a 1-day event, but not a 2-day event; some of the other girls are interested in attending both. 3. 70% of the boys who are interested in attending a 2-day event are neither singers nor dancers. 60% of the girls who are interested in attending a 2-day event are neither singers nor dancers. 4. No girl is interested in attending a 3-day event. All male singers and 2 of the dancers are interested in attending a 3-day event. 5. The number of singers interested in attending a 2-day event is one more than the number of dancers interested in attending a 2-day event.
Figure for this questionFigure for this questionFigure for this questionFigure for this questionFigure for this questionFigure for this question

What BEST can be concluded about the number of male dancers who are interested in attending a 1-day event?

Q52CAT 2022✓ Answer verified
There are 15 girls and some boys among the graduating students in a class. They are planning a get-together, which can be either a 1-day event, or a 2-day event, or a 3-day event. There are 6 singers in the class, 4 of them are boys. There are 10 dancers in the class, 4 of them are girls. No dancer in the class is a singer. Some students are not interested in attending the gettogether. Those students who are interested in attending a 3-day event are also interested in attending a 2-day event; those who are interested in attending a 2-day event are also interested in attending a 1-day event. The following facts are also known: 1. All the girls and 80% of the boys are interested in attending a 1-day event. 60% of the boys are interested in attending a 2-day event. 2. Some of the girls are interested in attending a 1-day event, but not a 2-day event; some of the other girls are interested in attending both. 3. 70% of the boys who are interested in attending a 2-day event are neither singers nor dancers. 60% of the girls who are interested in attending a 2-day event are neither singers nor dancers. 4. No girl is interested in attending a 3-day event. All male singers and 2 of the dancers are interested in attending a 3-day event. 5. The number of singers interested in attending a 2-day event is one more than the number of dancers interested in attending a 2-day event.
Figure for this questionFigure for this questionFigure for this questionFigure for this questionFigure for this questionFigure for this question

How many female dancers are interested in attending a 2-day event?

Q53CAT 2022✓ Answer verified
Directions for question (1 to 5): All the first-year students in the computer science (CS) department in a university take both the courses (i) AI and (ii) ML. Students from other departments (non-CS students) can also take one of these two courses, but not both. Students who fail in a course get an F grade; others pass and are awarded A or B or C grades depending on their performance. The following are some additional facts about the number of students who took these two courses this year and the grades they obtained. 1. The numbers of non-CS students who took AI and ML were in the ratio 2 : 5. 2. The number of non-CS students who took either AI or ML was equal to the number of CS students. 3. The numbers of non-CS students who failed in the two courses were the same and their total is equal to the number of CS students who got a C grade in ML. 4. In both the courses, 50% of the students who passed got a B grade. But, while the numbers of students who got A and C grades were the same for AI, they were in the ratio 3 : 2 for ML. 5. No CS student failed in AI, while no non-CS student got an A grade in AI. 6. The numbers of CS students who got A, B and C grades respectively in AI were in the ratio 3 : 5 : 2, while in ML the ratio was 4 : 5 : 2. 7. The ratio of the total number of non-CS students failing in one of the two courses to the number of CS students failing in one of the two courses was 3 : 1. 8. 30 students failed in ML.
Figure for this questionFigure for this questionFigure for this questionFigure for this questionFigure for this question

Q. 1 How many students took AI?

Q54CAT 2022 · TITA✓ Answer verified
Directions for question (1 to 5): All the first-year students in the computer science (CS) department in a university take both the courses (i) AI and (ii) ML. Students from other departments (non-CS students) can also take one of these two courses, but not both. Students who fail in a course get an F grade; others pass and are awarded A or B or C grades depending on their performance. The following are some additional facts about the number of students who took these two courses this year and the grades they obtained. 1. The numbers of non-CS students who took AI and ML were in the ratio 2 : 5. 2. The number of non-CS students who took either AI or ML was equal to the number of CS students. 3. The numbers of non-CS students who failed in the two courses were the same and their total is equal to the number of CS students who got a C grade in ML. 4. In both the courses, 50% of the students who passed got a B grade. But, while the numbers of students who got A and C grades were the same for AI, they were in the ratio 3 : 2 for ML. 5. No CS student failed in AI, while no non-CS student got an A grade in AI. 6. The numbers of CS students who got A, B and C grades respectively in AI were in the ratio 3 : 5 : 2, while in ML the ratio was 4 : 5 : 2. 7. The ratio of the total number of non-CS students failing in one of the two courses to the number of CS students failing in one of the two courses was 3 : 1. 8. 30 students failed in ML.
Figure for this questionFigure for this questionFigure for this questionFigure for this questionFigure for this question

Q. 2 How many CS students failed in ML?

Q55CAT 2022 · TITA✓ Answer verified
Directions for question (1 to 5): All the first-year students in the computer science (CS) department in a university take both the courses (i) AI and (ii) ML. Students from other departments (non-CS students) can also take one of these two courses, but not both. Students who fail in a course get an F grade; others pass and are awarded A or B or C grades depending on their performance. The following are some additional facts about the number of students who took these two courses this year and the grades they obtained. 1. The numbers of non-CS students who took AI and ML were in the ratio 2 : 5. 2. The number of non-CS students who took either AI or ML was equal to the number of CS students. 3. The numbers of non-CS students who failed in the two courses were the same and their total is equal to the number of CS students who got a C grade in ML. 4. In both the courses, 50% of the students who passed got a B grade. But, while the numbers of students who got A and C grades were the same for AI, they were in the ratio 3 : 2 for ML. 5. No CS student failed in AI, while no non-CS student got an A grade in AI. 6. The numbers of CS students who got A, B and C grades respectively in AI were in the ratio 3 : 5 : 2, while in ML the ratio was 4 : 5 : 2. 7. The ratio of the total number of non-CS students failing in one of the two courses to the number of CS students failing in one of the two courses was 3 : 1. 8. 30 students failed in ML.
Figure for this questionFigure for this questionFigure for this questionFigure for this questionFigure for this question

Q. 3 How many non-CS students got A grade in ML?

Q56CAT 2022✓ Answer verified
Directions for question (1 to 5): All the first-year students in the computer science (CS) department in a university take both the courses (i) AI and (ii) ML. Students from other departments (non-CS students) can also take one of these two courses, but not both. Students who fail in a course get an F grade; others pass and are awarded A or B or C grades depending on their performance. The following are some additional facts about the number of students who took these two courses this year and the grades they obtained. 1. The numbers of non-CS students who took AI and ML were in the ratio 2 : 5. 2. The number of non-CS students who took either AI or ML was equal to the number of CS students. 3. The numbers of non-CS students who failed in the two courses were the same and their total is equal to the number of CS students who got a C grade in ML. 4. In both the courses, 50% of the students who passed got a B grade. But, while the numbers of students who got A and C grades were the same for AI, they were in the ratio 3 : 2 for ML. 5. No CS student failed in AI, while no non-CS student got an A grade in AI. 6. The numbers of CS students who got A, B and C grades respectively in AI were in the ratio 3 : 5 : 2, while in ML the ratio was 4 : 5 : 2. 7. The ratio of the total number of non-CS students failing in one of the two courses to the number of CS students failing in one of the two courses was 3 : 1. 8. 30 students failed in ML.
Figure for this questionFigure for this questionFigure for this questionFigure for this questionFigure for this question

Q. 4 How many students got A grade in AI?

Q57CAT 2022✓ Answer verified
Directions for question (1 to 5): All the first-year students in the computer science (CS) department in a university take both the courses (i) AI and (ii) ML. Students from other departments (non-CS students) can also take one of these two courses, but not both. Students who fail in a course get an F grade; others pass and are awarded A or B or C grades depending on their performance. The following are some additional facts about the number of students who took these two courses this year and the grades they obtained. 1. The numbers of non-CS students who took AI and ML were in the ratio 2 : 5. 2. The number of non-CS students who took either AI or ML was equal to the number of CS students. 3. The numbers of non-CS students who failed in the two courses were the same and their total is equal to the number of CS students who got a C grade in ML. 4. In both the courses, 50% of the students who passed got a B grade. But, while the numbers of students who got A and C grades were the same for AI, they were in the ratio 3 : 2 for ML. 5. No CS student failed in AI, while no non-CS student got an A grade in AI. 6. The numbers of CS students who got A, B and C grades respectively in AI were in the ratio 3 : 5 : 2, while in ML the ratio was 4 : 5 : 2. 7. The ratio of the total number of non-CS students failing in one of the two courses to the number of CS students failing in one of the two courses was 3 : 1. 8. 30 students failed in ML.
Figure for this questionFigure for this questionFigure for this questionFigure for this questionFigure for this question

Q. 5 How many non-CS students got B grade in ML?

Q58CAT 2022 · TITA✓ Answer verified
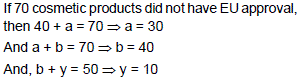
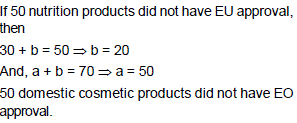
A speciality supermarket sells 320 products. Each of these products was either a cosmetic product or a nutrition product. Each of these products was also either a foreign product or a domestic product. Each of these products had at least one of the two approvals – FDA or EU. The following facts are also known: 1. There were equal numbers of domestic and foreign products. 2. Half of the domestic products were FDA approved cosmetic products. 3. None of the foreign products had both the approvals, while 60 domestic products had both the approvals. 4. There were 140 nutrition products, half of them were foreign products. 5. There were 200 FDA approved products. 70 of them were foreign products and 120 of them were cosmetic products.
Figure for this questionFigure for this question

How many foreign products were FDA approved cosmetic products?

Q59CAT 2022✓ Answer verified
A speciality supermarket sells 320 products. Each of these products was either a cosmetic product or a nutrition product. Each of these products was also either a foreign product or a domestic product. Each of these products had at least one of the two approvals – FDA or EU. The following facts are also known: 1. There were equal numbers of domestic and foreign products. 2. Half of the domestic products were FDA approved cosmetic products. 3. None of the foreign products had both the approvals, while 60 domestic products had both the approvals. 4. There were 140 nutrition products, half of them were foreign products. 5. There were 200 FDA approved products. 70 of them were foreign products and 120 of them were cosmetic products.
Figure for this questionFigure for this question

How many cosmetic products did not have FDA approval?

Q60CAT 2022✓ Answer verified
A speciality supermarket sells 320 products. Each of these products was either a cosmetic product or a nutrition product. Each of these products was also either a foreign product or a domestic product. Each of these products had at least one of the two approvals – FDA or EU. The following facts are also known: 1. There were equal numbers of domestic and foreign products. 2. Half of the domestic products were FDA approved cosmetic products. 3. None of the foreign products had both the approvals, while 60 domestic products had both the approvals. 4. There were 140 nutrition products, half of them were foreign products. 5. There were 200 FDA approved products. 70 of them were foreign products and 120 of them were cosmetic products.
Figure for this questionFigure for this question

Which among the following options best represents the number of domestic cosmetic products that had both the approvals?

Q61CAT 2022✓ Answer verified
A speciality supermarket sells 320 products. Each of these products was either a cosmetic product or a nutrition product. Each of these products was also either a foreign product or a domestic product. Each of these products had at least one of the two approvals – FDA or EU. The following facts are also known: 1. There were equal numbers of domestic and foreign products. 2. Half of the domestic products were FDA approved cosmetic products. 3. None of the foreign products had both the approvals, while 60 domestic products had both the approvals. 4. There were 140 nutrition products, half of them were foreign products. 5. There were 200 FDA approved products. 70 of them were foreign products and 120 of them were cosmetic products.
Figure for this questionFigure for this questionFigure for this question

If 70 cosmetic products did not have EU approval, then how many nutrition products had both the approvals?

Q62CAT 2022 · TITA✓ Answer verified
A speciality supermarket sells 320 products. Each of these products was either a cosmetic product or a nutrition product. Each of these products was also either a foreign product or a domestic product. Each of these products had at least one of the two approvals – FDA or EU. The following facts are also known: 1. There were equal numbers of domestic and foreign products. 2. Half of the domestic products were FDA approved cosmetic products. 3. None of the foreign products had both the approvals, while 60 domestic products had both the approvals. 4. There were 140 nutrition products, half of them were foreign products. 5. There were 200 FDA approved products. 70 of them were foreign products and 120 of them were cosmetic products.
Figure for this questionFigure for this questionFigure for this question

If 50 nutrition products did not have EU approval, then how many domestic cosmetic products did not have EU approval?

Q63CAT 2021 · TITA✓ Answer verified
Ravi works in an online food-delivery company. After each delivery, customers rate Ravi on each of four parameters – Behaviour, Packaging, Hygiene, and Timeliness, on a scale from 1 to 9. If the total of the four rating points is 25 or more, then Ravi gets a bonus of ₹20 for that delivery . Additionally, a customer may or may not give Ravi a tip. If the customer gives a tip, it is either ₹30 or ₹50. One day, Ravi made four deliveries − one to each of Atal, Bihari, Chirag and Deepak, andreceived a total of ₹120 in bonus and tips. He did not get both a bonus and a tip from thesame customer. The following additional facts are also known. 1. In Timeliness, Ravi received a total of 21 points, and three of the customers gave him the same rating points in this parameter. Atal gave higher rating points than Bihari and Chirag in this parameter. 2. Ravi received distinct rating points in Packaging from the four customers adding up to 29 points. Similarly, Ravi received distinct rating points in Hygiene from the four customers adding up to 26 points. 3. Chirag gave the same rating points for Packaging and Hygiene. 4. Among the four customers, Bihari gave the highest rating points in Packaging, and Chirag gave the highest rating points in Hygiene. 5. Everyone rated Ravi between 5 and 7 in Behaviour. Unique maximum and minimum ratings in this parameter were given by Atal and Deepak respectively. 6. If the customers are ranked based on ratings given by them in individual parameters,then Atal’s rank based on Packaging is the same as that based on Hygiene. This is also true for Deepak.
Figure for this questionFigure for this questionFigure for this questionFigure for this question

Q. 1 What was the minimum rating that Ravi received from any customer in any parameter?

Q64CAT 2021✓ Answer verified
Ravi works in an online food-delivery company. After each delivery, customers rate Ravi on each of four parameters – Behaviour, Packaging, Hygiene, and Timeliness, on a scale from 1 to 9. If the total of the four rating points is 25 or more, then Ravi gets a bonus of ₹20 for that delivery . Additionally, a customer may or may not give Ravi a tip. If the customer gives a tip, it is either ₹30 or ₹50. One day, Ravi made four deliveries − one to each of Atal, Bihari, Chirag and Deepak, andreceived a total of ₹120 in bonus and tips. He did not get both a bonus and a tip from thesame customer. The following additional facts are also known. 1. In Timeliness, Ravi received a total of 21 points, and three of the customers gave him the same rating points in this parameter. Atal gave higher rating points than Bihari and Chirag in this parameter. 2. Ravi received distinct rating points in Packaging from the four customers adding up to 29 points. Similarly, Ravi received distinct rating points in Hygiene from the four customers adding up to 26 points. 3. Chirag gave the same rating points for Packaging and Hygiene. 4. Among the four customers, Bihari gave the highest rating points in Packaging, and Chirag gave the highest rating points in Hygiene. 5. Everyone rated Ravi between 5 and 7 in Behaviour. Unique maximum and minimum ratings in this parameter were given by Atal and Deepak respectively. 6. If the customers are ranked based on ratings given by them in individual parameters,then Atal’s rank based on Packaging is the same as that based on Hygiene. This is also true for Deepak.
Figure for this questionFigure for this questionFigure for this questionFigure for this question

Q. 2 The COMPLETE list of customers who gave the maximum total rating points to Ravi is

Q65CAT 2021 · TITA✓ Answer verified
Ravi works in an online food-delivery company. After each delivery, customers rate Ravi on each of four parameters – Behaviour, Packaging, Hygiene, and Timeliness, on a scale from 1 to 9. If the total of the four rating points is 25 or more, then Ravi gets a bonus of ₹20 for that delivery . Additionally, a customer may or may not give Ravi a tip. If the customer gives a tip, it is either ₹30 or ₹50. One day, Ravi made four deliveries − one to each of Atal, Bihari, Chirag and Deepak, andreceived a total of ₹120 in bonus and tips. He did not get both a bonus and a tip from thesame customer. The following additional facts are also known. 1. In Timeliness, Ravi received a total of 21 points, and three of the customers gave him the same rating points in this parameter. Atal gave higher rating points than Bihari and Chirag in this parameter. 2. Ravi received distinct rating points in Packaging from the four customers adding up to 29 points. Similarly, Ravi received distinct rating points in Hygiene from the four customers adding up to 26 points. 3. Chirag gave the same rating points for Packaging and Hygiene. 4. Among the four customers, Bihari gave the highest rating points in Packaging, and Chirag gave the highest rating points in Hygiene. 5. Everyone rated Ravi between 5 and 7 in Behaviour. Unique maximum and minimum ratings in this parameter were given by Atal and Deepak respectively. 6. If the customers are ranked based on ratings given by them in individual parameters,then Atal’s rank based on Packaging is the same as that based on Hygiene. This is also true for Deepak.
Figure for this questionFigure for this questionFigure for this questionFigure for this question

Q. 3 What rating did Atal give on Timeliness? TITA

Q66CAT 2021✓ Answer verified
Ravi works in an online food-delivery company. After each delivery, customers rate Ravi on each of four parameters – Behaviour, Packaging, Hygiene, and Timeliness, on a scale from 1 to 9. If the total of the four rating points is 25 or more, then Ravi gets a bonus of ₹20 for that delivery . Additionally, a customer may or may not give Ravi a tip. If the customer gives a tip, it is either ₹30 or ₹50. One day, Ravi made four deliveries − one to each of Atal, Bihari, Chirag and Deepak, andreceived a total of ₹120 in bonus and tips. He did not get both a bonus and a tip from thesame customer. The following additional facts are also known. 1. In Timeliness, Ravi received a total of 21 points, and three of the customers gave him the same rating points in this parameter. Atal gave higher rating points than Bihari and Chirag in this parameter. 2. Ravi received distinct rating points in Packaging from the four customers adding up to 29 points. Similarly, Ravi received distinct rating points in Hygiene from the four customers adding up to 26 points. 3. Chirag gave the same rating points for Packaging and Hygiene. 4. Among the four customers, Bihari gave the highest rating points in Packaging, and Chirag gave the highest rating points in Hygiene. 5. Everyone rated Ravi between 5 and 7 in Behaviour. Unique maximum and minimum ratings in this parameter were given by Atal and Deepak respectively. 6. If the customers are ranked based on ratings given by them in individual parameters,then Atal’s rank based on Packaging is the same as that based on Hygiene. This is also true for Deepak.
Figure for this questionFigure for this questionFigure for this questionFigure for this question

Q. 4 What BEST can be concluded about the tip amount given by Deepak?

Q67CAT 2021✓ Answer verified
Each of the bottles mentioned in this question contains 50 ml of liquid. The liquid in any bottle can be 100% pure content (P) or can have certain amount of impurity (I). Visually it is not possible to distinguish between P and I. There is a testing device which detects impurity, as long as the percentage of impurity in the content tested is 10% or more. For example, suppose bottle 1 contains only P, and bottle 2 contains 80% P and 20% I. If content from bottle 1 is tested, it will be found out that it contains only P. If content of bottle 2 is tested, the test will reveal that it contains some amount of I. If 10 ml of content from bottle 1 is mixed with 20 ml content from bottle 2, the test will show that the mixture has impurity, and hence we can conclude that at least one of the two bottles has I. However, if 10 ml of content from bottle 1 is mixed with 5 ml of content from bottle 2. the test will not detect any impurity in the resultant mixture.
Figure for this questionFigure for this questionFigure for this questionFigure for this question

Q. 1 5 ml of content from bottle A is mixed with 5 ml of content from bottle B. The resultant mixture, when tested, detects the presence of I. If it is known that bottle A contains only P, what BEST can be concluded about the volume of I in bottle B?

Q68CAT 2021 · TITA✓ Answer verified
Each of the bottles mentioned in this question contains 50 ml of liquid. The liquid in any bottle can be 100% pure content (P) or can have certain amount of impurity (I). Visually it is not possible to distinguish between P and I. There is a testing device which detects impurity, as long as the percentage of impurity in the content tested is 10% or more. For example, suppose bottle 1 contains only P, and bottle 2 contains 80% P and 20% I. If content from bottle 1 is tested, it will be found out that it contains only P. If content of bottle 2 is tested, the test will reveal that it contains some amount of I. If 10 ml of content from bottle 1 is mixed with 20 ml content from bottle 2, the test will show that the mixture has impurity, and hence we can conclude that at least one of the two bottles has I. However, if 10 ml of content from bottle 1 is mixed with 5 ml of content from bottle 2. the test will not detect any impurity in the resultant mixture.
Figure for this questionFigure for this questionFigure for this questionFigure for this question

Q. 2 There are four bottles. Each bottle is known to contain only P or only I. They will be considered to be “collectively ready for dispatch” if all of them contain only P. In minimum how many tests, is it possible to ascertain whether these four bottles are “collectively ready for dispatch”?

Q69CAT 2021 · TITA✓ Answer verified
Each of the bottles mentioned in this question contains 50 ml of liquid. The liquid in any bottle can be 100% pure content (P) or can have certain amount of impurity (I). Visually it is not possible to distinguish between P and I. There is a testing device which detects impurity, as long as the percentage of impurity in the content tested is 10% or more. For example, suppose bottle 1 contains only P, and bottle 2 contains 80% P and 20% I. If content from bottle 1 is tested, it will be found out that it contains only P. If content of bottle 2 is tested, the test will reveal that it contains some amount of I. If 10 ml of content from bottle 1 is mixed with 20 ml content from bottle 2, the test will show that the mixture has impurity, and hence we can conclude that at least one of the two bottles has I. However, if 10 ml of content from bottle 1 is mixed with 5 ml of content from bottle 2. the test will not detect any impurity in the resultant mixture.
Figure for this questionFigure for this questionFigure for this questionFigure for this question

Q. 3 There are four bottles. It is known that three of these bottles contain only P, while the remaining one contains 80% P and 20% I. What is the minimum number of tests required to definitely identify the bottle containing some amount of I?

Q70CAT 2021✓ Answer verified
Each of the bottles mentioned in this question contains 50 ml of liquid. The liquid in any bottle can be 100% pure content (P) or can have certain amount of impurity (I). Visually it is not possible to distinguish between P and I. There is a testing device which detects impurity, as long as the percentage of impurity in the content tested is 10% or more. For example, suppose bottle 1 contains only P, and bottle 2 contains 80% P and 20% I. If content from bottle 1 is tested, it will be found out that it contains only P. If content of bottle 2 is tested, the test will reveal that it contains some amount of I. If 10 ml of content from bottle 1 is mixed with 20 ml content from bottle 2, the test will show that the mixture has impurity, and hence we can conclude that at least one of the two bottles has I. However, if 10 ml of content from bottle 1 is mixed with 5 ml of content from bottle 2. the test will not detect any impurity in the resultant mixture.
Figure for this questionFigure for this questionFigure for this questionFigure for this question

Q. 4 There are four bottles. It is known that either one or two of these bottles contain(s) only P, while the remaining ones contain 85% P and 15% I. What is the minimum number of tests required to ascertain the exact number of bottles containing only P?

Q71CAT 2020 · Slot 3✓ Answer verified

Groceries

XYZ organization got into the business of delivering groceries to home at the beginning of the last month. They have a two-day delivery promise. However, their deliveries are unreliable. An order booked on a particular day may be delivered the next day or the day after. If the order is not delivered at the end of two days, then the order is declared as lost at the end of the second day. XYZ then does not deliver the order, but informs the customer, marks the order as lost, returns the payment and pays a penalty for non-delivery. The following table provides details about the operations of XYZ for a week of the last month. The first column gives the date, the second gives the cumulative number of orders that were booked up to and including that day. The third column represents the number of orders delivered on that day. The last column gives the cumulative number of orders that were lost up to and including that day. It is known that the numbers of orders that were booked on the 11th, 12th, and 13th of the last month that took two days to deliver were 4, 6, and 8 respectively.
Figure for this question

Among the following days, the largest fraction of orders booked on which day was lost?

Q72CAT 2020 · Slot 3✓ Answer verified

Groceries

XYZ organization got into the business of delivering groceries to home at the beginning of the last month. They have a two-day delivery promise. However, their deliveries are unreliable. An order booked on a particular day may be delivered the next day or the day after. If the order is not delivered at the end of two days, then the order is declared as lost at the end of the second day. XYZ then does not deliver the order, but informs the customer, marks the order as lost, returns the payment and pays a penalty for non-delivery. The following table provides details about the operations of XYZ for a week of the last month. The first column gives the date, the second gives the cumulative number of orders that were booked up to and including that day. The third column represents the number of orders delivered on that day. The last column gives the cumulative number of orders that were lost up to and including that day. It is known that the numbers of orders that were booked on the 11th, 12th, and 13th of the last month that took two days to deliver were 4, 6, and 8 respectively.
Figure for this question

On which of the following days was the number of orders booked the highest?

Q73CAT 2020 · Slot 3✓ Answer verified

Groceries

XYZ organization got into the business of delivering groceries to home at the beginning of the last month. They have a two-day delivery promise. However, their deliveries are unreliable. An order booked on a particular day may be delivered the next day or the day after. If the order is not delivered at the end of two days, then the order is declared as lost at the end of the second day. XYZ then does not deliver the order, but informs the customer, marks the order as lost, returns the payment and pays a penalty for non-delivery. The following table provides details about the operations of XYZ for a week of the last month. The first column gives the date, the second gives the cumulative number of orders that were booked up to and including that day. The third column represents the number of orders delivered on that day. The last column gives the cumulative number of orders that were lost up to and including that day. It is known that the numbers of orders that were booked on the 11th, 12th, and 13th of the last month that took two days to deliver were 4, 6, and 8 respectively.
Figure for this question

The delivery ratio for a given day is defined as the ratio of the number of orders booked on that day which are delivered on the next day to the number of orders booked on that day which are delivered on the second day after booking. On which of the following days, was the delivery ratio the highest?

Q74CAT 2020 · Slot 3✓ Answer verified

Groceries

XYZ organization got into the business of delivering groceries to home at the beginning of the last month. They have a two-day delivery promise. However, their deliveries are unreliable. An order booked on a particular day may be delivered the next day or the day after. If the order is not delivered at the end of two days, then the order is declared as lost at the end of the second day. XYZ then does not deliver the order, but informs the customer, marks the order as lost, returns the payment and pays a penalty for non-delivery. The following table provides details about the operations of XYZ for a week of the last month. The first column gives the date, the second gives the cumulative number of orders that were booked up to and including that day. The third column represents the number of orders delivered on that day. The last column gives the cumulative number of orders that were lost up to and including that day. It is known that the numbers of orders that were booked on the 11th, 12th, and 13th of the last month that took two days to deliver were 4, 6, and 8 respectively.
Figure for this question

The average time taken to deliver orders booked on a particular day is computed as follows. Let the number of orders delivered the next day be x and the number of orders delivered the day after be y. Then the average time to deliver order is (x+2y)/(x+y). On which of the following days was the average time taken to deliver orders booked the least?

Q75CAT 2020 · TITA✓ Answer verified
1000 patients currently suffering from a disease were selected to study the effectiveness of treatment of four types of medicines — A, B, C and D. These patients were first randomly assigned into two groups of equal size, called treatment group and control group. The patients in the control group were not treated with any of these medicines; instead they were given a dummy medicine, called placebo, containing only sugar and starch. The following information is known about the patients in the treatment group. . A total of 250 patients were treated with type A medicine and a total of 210 patients were treated with type C medicine. 25 patients were treated with type A medicine only. 20 patients were treated with type C medicine only. 10 patients were treated with type D medicine only. 35 patients were treated with type A and type D medicines only. 20 patients were treated with type A and type B medicines only. 30 patients were treated with type A and type C medicines only. 20 patients were treated with type C and type D medicines only. 100 patients were treated with exactly three types of medicines. 40 patients were treated with medicines of types A, B and C, but not with medicines of type D. 20 patients were treated with medicines of types A, C and D, but not with medicines of type B. 50 patients were given all the four types of medicines. 75 patients were treated with exactly one type of medicine.
Figure for this questionFigure for this questionFigure for this questionFigure for this question

Q. 1 How many patients were treated with medicine type B?

Q76CAT 2020 · TITA✓ Answer verified
1000 patients currently suffering from a disease were selected to study the effectiveness of treatment of four types of medicines — A, B, C and D. These patients were first randomly assigned into two groups of equal size, called treatment group and control group. The patients in the control group were not treated with any of these medicines; instead they were given a dummy medicine, called placebo, containing only sugar and starch. The following information is known about the patients in the treatment group. . A total of 250 patients were treated with type A medicine and a total of 210 patients were treated with type C medicine. 25 patients were treated with type A medicine only. 20 patients were treated with type C medicine only. 10 patients were treated with type D medicine only. 35 patients were treated with type A and type D medicines only. 20 patients were treated with type A and type B medicines only. 30 patients were treated with type A and type C medicines only. 20 patients were treated with type C and type D medicines only. 100 patients were treated with exactly three types of medicines. 40 patients were treated with medicines of types A, B and C, but not with medicines of type D. 20 patients were treated with medicines of types A, C and D, but not with medicines of type B. 50 patients were given all the four types of medicines. 75 patients were treated with exactly one type of medicine.
Figure for this questionFigure for this questionFigure for this questionFigure for this question

Q. 2 The number of patients who were treated with medicine types B, C and D, but not type A was:

Q77CAT 2020 · TITA✓ Answer verified
1000 patients currently suffering from a disease were selected to study the effectiveness of treatment of four types of medicines — A, B, C and D. These patients were first randomly assigned into two groups of equal size, called treatment group and control group. The patients in the control group were not treated with any of these medicines; instead they were given a dummy medicine, called placebo, containing only sugar and starch. The following information is known about the patients in the treatment group. . A total of 250 patients were treated with type A medicine and a total of 210 patients were treated with type C medicine. 25 patients were treated with type A medicine only. 20 patients were treated with type C medicine only. 10 patients were treated with type D medicine only. 35 patients were treated with type A and type D medicines only. 20 patients were treated with type A and type B medicines only. 30 patients were treated with type A and type C medicines only. 20 patients were treated with type C and type D medicines only. 100 patients were treated with exactly three types of medicines. 40 patients were treated with medicines of types A, B and C, but not with medicines of type D. 20 patients were treated with medicines of types A, C and D, but not with medicines of type B. 50 patients were given all the four types of medicines. 75 patients were treated with exactly one type of medicine.
Figure for this questionFigure for this questionFigure for this questionFigure for this question

Q. 3 How many patients were treated with medicine types B and D only?

Q78CAT 2020 · TITA✓ Answer verified
1000 patients currently suffering from a disease were selected to study the effectiveness of treatment of four types of medicines — A, B, C and D. These patients were first randomly assigned into two groups of equal size, called treatment group and control group. The patients in the control group were not treated with any of these medicines; instead they were given a dummy medicine, called placebo, containing only sugar and starch. The following information is known about the patients in the treatment group. . A total of 250 patients were treated with type A medicine and a total of 210 patients were treated with type C medicine. 25 patients were treated with type A medicine only. 20 patients were treated with type C medicine only. 10 patients were treated with type D medicine only. 35 patients were treated with type A and type D medicines only. 20 patients were treated with type A and type B medicines only. 30 patients were treated with type A and type C medicines only. 20 patients were treated with type C and type D medicines only. 100 patients were treated with exactly three types of medicines. 40 patients were treated with medicines of types A, B and C, but not with medicines of type D. 20 patients were treated with medicines of types A, C and D, but not with medicines of type B. 50 patients were given all the four types of medicines. 75 patients were treated with exactly one type of medicine.
Figure for this questionFigure for this questionFigure for this questionFigure for this question

Q. 4 The number of patients who were treated with medicine type D was:

Q79CAT 2020

Accounts Summary CAT 2020 DILR Caselet Set

A chain of departmental stores has outlets in Delhi, Mumbai, Bengaluru and Kolkata. The sales are categorized by its three departments – ‘Apparel’, ‘Electronics’, and ‘Home Decor’. An Accountant has been asked to prepare a summary of the 2018 and 2019 sales amounts for an internal report. He has collated partial information and prepared the following table. The following additional information is known. 1. The sales amounts in the Apparel departments were the same for Delhi and Kolkata in 2018. 2. The sales amounts in the Apparel departments were the same for Mumbai and Bengaluru in 2018. This sales amount matched the sales amount in the Apparel department for Delhi in 2019. 3. The sales amounts in the Home Decor departments were the same for Mumbai and Kolkata in 2018. 4. The sum of the sales amounts of four Electronics departments increased by the same amount as the sum of the sales amounts of four Apparel departments from 2018 to 2019. 5. The total sales amounts of the four Home Decor departments increased by Rs 70 Crores from 2018 to 2019. 6. The sales amounts in the Home Decor departments of Delhi and Bengaluru each increased by Rs 20 Crores from 2018 to 2019. 7. The sales amounts in the Apparel departments of Delhi and Bengaluru each increased by the same amount in 2019 from 2018. The sales amounts in the Apparel departments of Mumbai and Kolkata also each increased by the same amount in 2019 from 2018. 8. The sales amounts in the Apparel departments of Delhi, Kolkata and Bengaluru in 2019 followed an Arithmetic Progressio
Figure for this questionFigure for this question

Which one of the following statements is true?

Q80CAT 2020

Accounts Summary CAT 2020 DILR Caselet Set

A chain of departmental stores has outlets in Delhi, Mumbai, Bengaluru and Kolkata. The sales are categorized by its three departments – ‘Apparel’, ‘Electronics’, and ‘Home Decor’. An Accountant has been asked to prepare a summary of the 2018 and 2019 sales amounts for an internal report. He has collated partial information and prepared the following table. The following additional information is known. 1. The sales amounts in the Apparel departments were the same for Delhi and Kolkata in 2018. 2. The sales amounts in the Apparel departments were the same for Mumbai and Bengaluru in 2018. This sales amount matched the sales amount in the Apparel department for Delhi in 2019. 3. The sales amounts in the Home Decor departments were the same for Mumbai and Kolkata in 2018. 4. The sum of the sales amounts of four Electronics departments increased by the same amount as the sum of the sales amounts of four Apparel departments from 2018 to 2019. 5. The total sales amounts of the four Home Decor departments increased by Rs 70 Crores from 2018 to 2019. 6. The sales amounts in the Home Decor departments of Delhi and Bengaluru each increased by Rs 20 Crores from 2018 to 2019. 7. The sales amounts in the Apparel departments of Delhi and Bengaluru each increased by the same amount in 2019 from 2018. The sales amounts in the Apparel departments of Mumbai and Kolkata also each increased by the same amount in 2019 from 2018. 8. The sales amounts in the Apparel departments of Delhi, Kolkata and Bengaluru in 2019 followed an Arithmetic Progressio
Figure for this questionFigure for this question

Who all are NOT guiding any Economics students?

Q81CAT 2020

Accounts Summary CAT 2020 DILR Caselet Set

A chain of departmental stores has outlets in Delhi, Mumbai, Bengaluru and Kolkata. The sales are categorized by its three departments – ‘Apparel’, ‘Electronics’, and ‘Home Decor’. An Accountant has been asked to prepare a summary of the 2018 and 2019 sales amounts for an internal report. He has collated partial information and prepared the following table. The following additional information is known. 1. The sales amounts in the Apparel departments were the same for Delhi and Kolkata in 2018. 2. The sales amounts in the Apparel departments were the same for Mumbai and Bengaluru in 2018. This sales amount matched the sales amount in the Apparel department for Delhi in 2019. 3. The sales amounts in the Home Decor departments were the same for Mumbai and Kolkata in 2018. 4. The sum of the sales amounts of four Electronics departments increased by the same amount as the sum of the sales amounts of four Apparel departments from 2018 to 2019. 5. The total sales amounts of the four Home Decor departments increased by Rs 70 Crores from 2018 to 2019. 6. The sales amounts in the Home Decor departments of Delhi and Bengaluru each increased by Rs 20 Crores from 2018 to 2019. 7. The sales amounts in the Apparel departments of Delhi and Bengaluru each increased by the same amount in 2019 from 2018. The sales amounts in the Apparel departments of Mumbai and Kolkata also each increased by the same amount in 2019 from 2018. 8. The sales amounts in the Apparel departments of Delhi, Kolkata and Bengaluru in 2019 followed an Arithmetic Progressio
Figure for this questionFigure for this question

Which of the following statements is necessarily true?

Q82CAT 2020

Accounts Summary CAT 2020 DILR Caselet Set

A chain of departmental stores has outlets in Delhi, Mumbai, Bengaluru and Kolkata. The sales are categorized by its three departments – ‘Apparel’, ‘Electronics’, and ‘Home Decor’. An Accountant has been asked to prepare a summary of the 2018 and 2019 sales amounts for an internal report. He has collated partial information and prepared the following table. The following additional information is known. 1. The sales amounts in the Apparel departments were the same for Delhi and Kolkata in 2018. 2. The sales amounts in the Apparel departments were the same for Mumbai and Bengaluru in 2018. This sales amount matched the sales amount in the Apparel department for Delhi in 2019. 3. The sales amounts in the Home Decor departments were the same for Mumbai and Kolkata in 2018. 4. The sum of the sales amounts of four Electronics departments increased by the same amount as the sum of the sales amounts of four Apparel departments from 2018 to 2019. 5. The total sales amounts of the four Home Decor departments increased by Rs 70 Crores from 2018 to 2019. 6. The sales amounts in the Home Decor departments of Delhi and Bengaluru each increased by Rs 20 Crores from 2018 to 2019. 7. The sales amounts in the Apparel departments of Delhi and Bengaluru each increased by the same amount in 2019 from 2018. The sales amounts in the Apparel departments of Mumbai and Kolkata also each increased by the same amount in 2019 from 2018. 8. The sales amounts in the Apparel departments of Delhi, Kolkata and Bengaluru in 2019 followed an Arithmetic Progressio
Figure for this questionFigure for this question

If D is scheduled in a slot later than Q's, then which of the following two statement(s) is(are) true? (i) E and H are guided by T. (ii) G is guided by Q.

Q83CAT 2020

Accounts Summary CAT 2020 DILR Caselet Set

A chain of departmental stores has outlets in Delhi, Mumbai, Bengaluru and Kolkata. The sales are categorized by its three departments – ‘Apparel’, ‘Electronics’, and ‘Home Decor’. An Accountant has been asked to prepare a summary of the 2018 and 2019 sales amounts for an internal report. He has collated partial information and prepared the following table. The following additional information is known. 1. The sales amounts in the Apparel departments were the same for Delhi and Kolkata in 2018. 2. The sales amounts in the Apparel departments were the same for Mumbai and Bengaluru in 2018. This sales amount matched the sales amount in the Apparel department for Delhi in 2019. 3. The sales amounts in the Home Decor departments were the same for Mumbai and Kolkata in 2018. 4. The sum of the sales amounts of four Electronics departments increased by the same amount as the sum of the sales amounts of four Apparel departments from 2018 to 2019. 5. The total sales amounts of the four Home Decor departments increased by Rs 70 Crores from 2018 to 2019. 6. The sales amounts in the Home Decor departments of Delhi and Bengaluru each increased by Rs 20 Crores from 2018 to 2019. 7. The sales amounts in the Apparel departments of Delhi and Bengaluru each increased by the same amount in 2019 from 2018. The sales amounts in the Apparel departments of Mumbai and Kolkata also each increased by the same amount in 2019 from 2018. 8. The sales amounts in the Apparel departments of Delhi, Kolkata and Bengaluru in 2019 followed an Arithmetic Progressio
Figure for this questionFigure for this question

If E and Q are both scheduled in the same slot, then which of the following statements BEST describes the relationship between D, H, and T?

Q84CAT 2020

Accounts Summary CAT 2020 DILR Caselet Set

A chain of departmental stores has outlets in Delhi, Mumbai, Bengaluru and Kolkata. The sales are categorized by its three departments – ‘Apparel’, ‘Electronics’, and ‘Home Decor’. An Accountant has been asked to prepare a summary of the 2018 and 2019 sales amounts for an internal report. He has collated partial information and prepared the following table. The following additional information is known. 1. The sales amounts in the Apparel departments were the same for Delhi and Kolkata in 2018. 2. The sales amounts in the Apparel departments were the same for Mumbai and Bengaluru in 2018. This sales amount matched the sales amount in the Apparel department for Delhi in 2019. 3. The sales amounts in the Home Decor departments were the same for Mumbai and Kolkata in 2018. 4. The sum of the sales amounts of four Electronics departments increased by the same amount as the sum of the sales amounts of four Apparel departments from 2018 to 2019. 5. The total sales amounts of the four Home Decor departments increased by Rs 70 Crores from 2018 to 2019. 6. The sales amounts in the Home Decor departments of Delhi and Bengaluru each increased by Rs 20 Crores from 2018 to 2019. 7. The sales amounts in the Apparel departments of Delhi and Bengaluru each increased by the same amount in 2019 from 2018. The sales amounts in the Apparel departments of Mumbai and Kolkata also each increased by the same amount in 2019 from 2018. 8. The sales amounts in the Apparel departments of Delhi, Kolkata and Bengaluru in 2019 followed an Arithmetic Progressio
Figure for this questionFigure for this question

If D is scheduled in the slot immediately before Q’s, then which of the following is NOT necessarily true?

Q85CAT 2020 · TITA✓ Answer verified
In an election several candidates contested for a constituency. In any constituency, the winning candidate was the one who polled the highest number of votes, the first runner up was the one who polled the second highest number of votes, the second runner up was the one who polled the third highest number of votes, and so on. There were no ties (in terms of number of votes polled by the candidates) in any of the constituencies in this election. In an electoral system, a security deposit is the sum of money that a candidate is required to pay to the election commission before he or she is permitted to contest. Only the defeated candidates (i.e., one who is not the winning candidate) who fail to secure more than one sixth of the valid votes polled in the constituency, lose their security deposits. The following table provides some incomplete information about votes polled in four constituencies: A, B, C and D, in this election. | A | B | C | D No. of candidates contesting | 10 | 12 | 5 | 8 Total No. of valid votes polled | 5,00,000 | 3,25,000 | 6,00,030 | No. of votes polled by the winning candidate | 2,75,000 | 48,750 | | No. of votes polled by the first runner up | 95,000 | | | 37,500 No. of votes polled by the second runner up | | | | 30,000 % of valid votes polled by the third runner up | | | | 10% The following additional facts are known: 1. The first runner up polled 10,000 more votes than the second runner up in constituency A. 2. None of the candidates who contested in constituency C lost their security deposit. The difference in votes polled by any pair of candidates in this constituency was at least 10,000. 3. The winning candidate in constituency D polled 5% of valid votes more than that of the first runner up. All the candidates who lost their security deposits while contesting for this constituency, put together, polled 35% of the valid votes.
Figure for this question

What is the percentage of votes polled in total by all the candidates who lost their security deposits while contesting for constituency A?

Q86CAT 2020 · TITA✓ Answer verified
In an election several candidates contested for a constituency. In any constituency, the winning candidate was the one who polled the highest number of votes, the first runner up was the one who polled the second highest number of votes, the second runner up was the one who polled the third highest number of votes, and so on. There were no ties (in terms of number of votes polled by the candidates) in any of the constituencies in this election. In an electoral system, a security deposit is the sum of money that a candidate is required to pay to the election commission before he or she is permitted to contest. Only the defeated candidates (i.e., one who is not the winning candidate) who fail to secure more than one sixth of the valid votes polled in the constituency, lose their security deposits. The following table provides some incomplete information about votes polled in four constituencies: A, B, C and D, in this election. | A | B | C | D No. of candidates contesting | 10 | 12 | 5 | 8 Total No. of valid votes polled | 5,00,000 | 3,25,000 | 6,00,030 | No. of votes polled by the winning candidate | 2,75,000 | 48,750 | | No. of votes polled by the first runner up | 95,000 | | | 37,500 No. of votes polled by the second runner up | | | | 30,000 % of valid votes polled by the third runner up | | | | 10% The following additional facts are known: 1. The first runner up polled 10,000 more votes than the second runner up in constituency A. 2. None of the candidates who contested in constituency C lost their security deposit. The difference in votes polled by any pair of candidates in this constituency was at least 10,000. 3. The winning candidate in constituency D polled 5% of valid votes more than that of the first runner up. All the candidates who lost their security deposits while contesting for this constituency, put together, polled 35% of the valid votes.

How many candidates who contested in constituency B lost their security deposit?

Q87CAT 2020
In an election several candidates contested for a constituency. In any constituency, the winning candidate was the one who polled the highest number of votes, the first runner up was the one who polled the second highest number of votes, the second runner up was the one who polled the third highest number of votes, and so on. There were no ties (in terms of number of votes polled by the candidates) in any of the constituencies in this election. In an electoral system, a security deposit is the sum of money that a candidate is required to pay to the election commission before he or she is permitted to contest. Only the defeated candidates (i.e., one who is not the winning candidate) who fail to secure more than one sixth of the valid votes polled in the constituency, lose their security deposits. The following table provides some incomplete information about votes polled in four constituencies: A, B, C and D, in this election. | A | B | C | D No. of candidates contesting | 10 | 12 | 5 | 8 Total No. of valid votes polled | 5,00,000 | 3,25,000 | 6,00,030 | No. of votes polled by the winning candidate | 2,75,000 | 48,750 | | No. of votes polled by the first runner up | 95,000 | | | 37,500 No. of votes polled by the second runner up | | | | 30,000 % of valid votes polled by the third runner up | | | | 10% The following additional facts are known: 1. The first runner up polled 10,000 more votes than the second runner up in constituency A. 2. None of the candidates who contested in constituency C lost their security deposit. The difference in votes polled by any pair of candidates in this constituency was at least 10,000. 3. The winning candidate in constituency D polled 5% of valid votes more than that of the first runner up. All the candidates who lost their security deposits while contesting for this constituency, put together, polled 35% of the valid votes.
Figure for this question

What BEST can be concluded about the number of votes polled by the winning candidate in constituency C?

Q88CAT 2020✓ Answer verified
In an election several candidates contested for a constituency. In any constituency, the winning candidate was the one who polled the highest number of votes, the first runner up was the one who polled the second highest number of votes, the second runner up was the one who polled the third highest number of votes, and so on. There were no ties (in terms of number of votes polled by the candidates) in any of the constituencies in this election. In an electoral system, a security deposit is the sum of money that a candidate is required to pay to the election commission before he or she is permitted to contest. Only the defeated candidates (i.e., one who is not the winning candidate) who fail to secure more than one sixth of the valid votes polled in the constituency, lose their security deposits. The following table provides some incomplete information about votes polled in four constituencies: A, B, C and D, in this election. | A | B | C | D No. of candidates contesting | 10 | 12 | 5 | 8 Total No. of valid votes polled | 5,00,000 | 3,25,000 | 6,00,030 | No. of votes polled by the winning candidate | 2,75,000 | 48,750 | | No. of votes polled by the first runner up | 95,000 | | | 37,500 No. of votes polled by the second runner up | | | | 30,000 % of valid votes polled by the third runner up | | | | 10% The following additional facts are known: 1. The first runner up polled 10,000 more votes than the second runner up in constituency A. 2. None of the candidates who contested in constituency C lost their security deposit. The difference in votes polled by any pair of candidates in this constituency was at least 10,000. 3. The winning candidate in constituency D polled 5% of valid votes more than that of the first runner up. All the candidates who lost their security deposits while contesting for this constituency, put together, polled 35% of the valid votes.
Figure for this questionFigure for this question

What was the number of valid votes polled in constituency D?

Q89CAT 2020✓ Answer verified
In an election several candidates contested for a constituency. In any constituency, the winning candidate was the one who polled the highest number of votes, the first runner up was the one who polled the second highest number of votes, the second runner up was the one who polled the third highest number of votes, and so on. There were no ties (in terms of number of votes polled by the candidates) in any of the constituencies in this election. In an electoral system, a security deposit is the sum of money that a candidate is required to pay to the election commission before he or she is permitted to contest. Only the defeated candidates (i.e., one who is not the winning candidate) who fail to secure more than one sixth of the valid votes polled in the constituency, lose their security deposits. The following table provides some incomplete information about votes polled in four constituencies: A, B, C and D, in this election. | A | B | C | D No. of candidates contesting | 10 | 12 | 5 | 8 Total No. of valid votes polled | 5,00,000 | 3,25,000 | 6,00,030 | No. of votes polled by the winning candidate | 2,75,000 | 48,750 | | No. of votes polled by the first runner up | 95,000 | | | 37,500 No. of votes polled by the second runner up | | | | 30,000 % of valid votes polled by the third runner up | | | | 10% The following additional facts are known: 1. The first runner up polled 10,000 more votes than the second runner up in constituency A. 2. None of the candidates who contested in constituency C lost their security deposit. The difference in votes polled by any pair of candidates in this constituency was at least 10,000. 3. The winning candidate in constituency D polled 5% of valid votes more than that of the first runner up. All the candidates who lost their security deposits while contesting for this constituency, put together, polled 35% of the valid votes.

The winning margin of a constituency is defined as the difference of votes polled by the winner and that of the first runner up. Which of the following CANNOT be the list of constituencies, in increasing order of winning margin?

Q90CAT 2020✓ Answer verified
In an election several candidates contested for a constituency. In any constituency, the winning candidate was the one who polled the highest number of votes, the first runner up was the one who polled the second highest number of votes, the second runner up was the one who polled the third highest number of votes, and so on. There were no ties (in terms of number of votes polled by the candidates) in any of the constituencies in this election. In an electoral system, a security deposit is the sum of money that a candidate is required to pay to the election commission before he or she is permitted to contest. Only the defeated candidates (i.e., one who is not the winning candidate) who fail to secure more than one sixth of the valid votes polled in the constituency, lose their security deposits. The following table provides some incomplete information about votes polled in four constituencies: A, B, C and D, in this election. | A | B | C | D No. of candidates contesting | 10 | 12 | 5 | 8 Total No. of valid votes polled | 5,00,000 | 3,25,000 | 6,00,030 | No. of votes polled by the winning candidate | 2,75,000 | 48,750 | | No. of votes polled by the first runner up | 95,000 | | | 37,500 No. of votes polled by the second runner up | | | | 30,000 % of valid votes polled by the third runner up | | | | 10% The following additional facts are known: 1. The first runner up polled 10,000 more votes than the second runner up in constituency A. 2. None of the candidates who contested in constituency C lost their security deposit. The difference in votes polled by any pair of candidates in this constituency was at least 10,000. 3. The winning candidate in constituency D polled 5% of valid votes more than that of the first runner up. All the candidates who lost their security deposits while contesting for this constituency, put together, polled 35% of the valid votes.

For all the four constituencies taken together, what was the approximate number of votes polled by all the candidates who lost their security deposit expressed as a percentage of the total valid votes from these four constituencies?

Q91CAT 2020✓ Answer verified

Board Exam

In a certain board examination, students were to appear for examination in five subjects: English, Hindi, Mathematics, Science and Social Science. Due to a certain emergency situation, a few of the examinations could not be conducted for some students. Hence, some students missed one examination and some others missed two examinations. Nobody missed more than two examinations.The board adopted the following policy for awarding marks to students. If a student appeared in all five examinations, then the marks awarded in each of the examinations were on the basis of the scores obtained by them in those examinations. If a student missed only one examination, then the marks awarded in that examination was the average of the best three among the four scores in the examinations they appeared for. If a student missed two examinations, then the marks awarded in each of these examinations was the average of the best two among the three scores in the examinations they appeared for. The marks obtained by six students in the examination are given in the table below. Each of them missed either one or two examinations. | English | Hindi | Mathematics | Science | Social Science Alva | 80 | 75 | 70 | 75 | 60 Bithi | 90 | 80 | 55 | 85 | 85 Carl | 75 | 80 | 90 | 100 | 90 Deep | 70 | 90 | 100 | 90 | 80 Esha | 80 | 85 | 95 | 60 | 55 Foni | 83 | 72 | 78 | 88 | 83 The following facts are also known. Four of these students appeared in each of the English, Hindi, Science, and Social Science examinations. The student who missed the Mathematics examination did not miss any other examination. One of the students who missed the Hindi examination did not miss any other examination. The other student who missed the Hindi examination also missed the Science examination.

Who among the following did not appear for the Mathematics examination?

Q92CAT 2020✓ Answer verified

Board Exam

In a certain board examination, students were to appear for examination in five subjects: English, Hindi, Mathematics, Science and Social Science. Due to a certain emergency situation, a few of the examinations could not be conducted for some students. Hence, some students missed one examination and some others missed two examinations. Nobody missed more than two examinations.The board adopted the following policy for awarding marks to students. If a student appeared in all five examinations, then the marks awarded in each of the examinations were on the basis of the scores obtained by them in those examinations. If a student missed only one examination, then the marks awarded in that examination was the average of the best three among the four scores in the examinations they appeared for. If a student missed two examinations, then the marks awarded in each of these examinations was the average of the best two among the three scores in the examinations they appeared for. The marks obtained by six students in the examination are given in the table below. Each of them missed either one or two examinations. | English | Hindi | Mathematics | Science | Social Science Alva | 80 | 75 | 70 | 75 | 60 Bithi | 90 | 80 | 55 | 85 | 85 Carl | 75 | 80 | 90 | 100 | 90 Deep | 70 | 90 | 100 | 90 | 80 Esha | 80 | 85 | 95 | 60 | 55 Foni | 83 | 72 | 78 | 88 | 83 The following facts are also known. Four of these students appeared in each of the English, Hindi, Science, and Social Science examinations. The student who missed the Mathematics examination did not miss any other examination. One of the students who missed the Hindi examination did not miss any other examination. The other student who missed the Hindi examination also missed the Science examination.

Which students did not appear for the English examination?

Q93CAT 2020

Board Exam

In a certain board examination, students were to appear for examination in five subjects: English, Hindi, Mathematics, Science and Social Science. Due to a certain emergency situation, a few of the examinations could not be conducted for some students. Hence, some students missed one examination and some others missed two examinations. Nobody missed more than two examinations.The board adopted the following policy for awarding marks to students. If a student appeared in all five examinations, then the marks awarded in each of the examinations were on the basis of the scores obtained by them in those examinations. If a student missed only one examination, then the marks awarded in that examination was the average of the best three among the four scores in the examinations they appeared for. If a student missed two examinations, then the marks awarded in each of these examinations was the average of the best two among the three scores in the examinations they appeared for. The marks obtained by six students in the examination are given in the table below. Each of them missed either one or two examinations. | English | Hindi | Mathematics | Science | Social Science Alva | 80 | 75 | 70 | 75 | 60 Bithi | 90 | 80 | 55 | 85 | 85 Carl | 75 | 80 | 90 | 100 | 90 Deep | 70 | 90 | 100 | 90 | 80 Esha | 80 | 85 | 95 | 60 | 55 Foni | 83 | 72 | 78 | 88 | 83 The following facts are also known. Four of these students appeared in each of the English, Hindi, Science, and Social Science examinations. The student who missed the Mathematics examination did not miss any other examination. One of the students who missed the Hindi examination did not miss any other examination. The other student who missed the Hindi examination also missed the Science examination.

What BEST can be concluded about the students who did not appear for the Hindi examination?

Q94CAT 2020

Board Exam

In a certain board examination, students were to appear for examination in five subjects: English, Hindi, Mathematics, Science and Social Science. Due to a certain emergency situation, a few of the examinations could not be conducted for some students. Hence, some students missed one examination and some others missed two examinations. Nobody missed more than two examinations.The board adopted the following policy for awarding marks to students. If a student appeared in all five examinations, then the marks awarded in each of the examinations were on the basis of the scores obtained by them in those examinations. If a student missed only one examination, then the marks awarded in that examination was the average of the best three among the four scores in the examinations they appeared for. If a student missed two examinations, then the marks awarded in each of these examinations was the average of the best two among the three scores in the examinations they appeared for. The marks obtained by six students in the examination are given in the table below. Each of them missed either one or two examinations. | English | Hindi | Mathematics | Science | Social Science Alva | 80 | 75 | 70 | 75 | 60 Bithi | 90 | 80 | 55 | 85 | 85 Carl | 75 | 80 | 90 | 100 | 90 Deep | 70 | 90 | 100 | 90 | 80 Esha | 80 | 85 | 95 | 60 | 55 Foni | 83 | 72 | 78 | 88 | 83 The following facts are also known. Four of these students appeared in each of the English, Hindi, Science, and Social Science examinations. The student who missed the Mathematics examination did not miss any other examination. One of the students who missed the Hindi examination did not miss any other examination. The other student who missed the Hindi examination also missed the Science examination.

What BEST can be concluded about the students who missed the Science examination?

Q95CAT 2020 · TITA✓ Answer verified

Board Exam

In a certain board examination, students were to appear for examination in five subjects: English, Hindi, Mathematics, Science and Social Science. Due to a certain emergency situation, a few of the examinations could not be conducted for some students. Hence, some students missed one examination and some others missed two examinations. Nobody missed more than two examinations.The board adopted the following policy for awarding marks to students. If a student appeared in all five examinations, then the marks awarded in each of the examinations were on the basis of the scores obtained by them in those examinations. If a student missed only one examination, then the marks awarded in that examination was the average of the best three among the four scores in the examinations they appeared for. If a student missed two examinations, then the marks awarded in each of these examinations was the average of the best two among the three scores in the examinations they appeared for. The marks obtained by six students in the examination are given in the table below. Each of them missed either one or two examinations. | English | Hindi | Mathematics | Science | Social Science Alva | 80 | 75 | 70 | 75 | 60 Bithi | 90 | 80 | 55 | 85 | 85 Carl | 75 | 80 | 90 | 100 | 90 Deep | 70 | 90 | 100 | 90 | 80 Esha | 80 | 85 | 95 | 60 | 55 Foni | 83 | 72 | 78 | 88 | 83 The following facts are also known. Four of these students appeared in each of the English, Hindi, Science, and Social Science examinations. The student who missed the Mathematics examination did not miss any other examination. One of the students who missed the Hindi examination did not miss any other examination. The other student who missed the Hindi examination also missed the Science examination.

How many out of these six students missed exactly one examination?

Q96CAT 2020 · TITA✓ Answer verified

Board Exam

In a certain board examination, students were to appear for examination in five subjects: English, Hindi, Mathematics, Science and Social Science. Due to a certain emergency situation, a few of the examinations could not be conducted for some students. Hence, some students missed one examination and some others missed two examinations. Nobody missed more than two examinations.The board adopted the following policy for awarding marks to students. If a student appeared in all five examinations, then the marks awarded in each of the examinations were on the basis of the scores obtained by them in those examinations. If a student missed only one examination, then the marks awarded in that examination was the average of the best three among the four scores in the examinations they appeared for. If a student missed two examinations, then the marks awarded in each of these examinations was the average of the best two among the three scores in the examinations they appeared for. The marks obtained by six students in the examination are given in the table below. Each of them missed either one or two examinations. | English | Hindi | Mathematics | Science | Social Science Alva | 80 | 75 | 70 | 75 | 60 Bithi | 90 | 80 | 55 | 85 | 85 Carl | 75 | 80 | 90 | 100 | 90 Deep | 70 | 90 | 100 | 90 | 80 Esha | 80 | 85 | 95 | 60 | 55 Foni | 83 | 72 | 78 | 88 | 83 The following facts are also known. Four of these students appeared in each of the English, Hindi, Science, and Social Science examinations. The student who missed the Mathematics examination did not miss any other examination. One of the students who missed the Hindi examination did not miss any other examination. The other student who missed the Hindi examination also missed the Science examination.

For how many students can we be definite about which examinations they missed?

Q97CAT 2020✓ Answer verified

Trees Caselet CAT 2020 DILR Set

A farmer had a rectangular land containing 205 trees. He distributed that land among his four daughters – Abha, Bina, Chitra and Dipti by dividing the land into twelve plots along three rows (X,Y,Z) and four Columns (1,2,3,4) as shown in the figure below: The plots in rows X, Y, Z contained mango, teak and pine trees respectively. Each plot had trees in non-zero multiples of 3 or 4 and none of the plots had the same number of trees. Each daughter got an even number of plots. In the figure, the number mentioned in top left corner of a plot is the number of trees in that plot, while the letter in the bottom right corner is the first letter of the name of the daughter who got that plot (For example, Abha got the plot in row Y and column 1 containing 21 trees). Some information in the figure got erased, but the following is known: 1. Abha got 20 trees more than Chitra but 6 trees less than Dipti. 2. The largest number of trees in a plot was 32, but it was not with Abha. 3. The number of teak trees in Column 3 was double of that in Column 2 but was half of that in Column 4. 4. Both Abha and Bina got a higher number of plots than Dipti. 5. Only Bina, Chitra and Dipti got corner plots. 6. Dipti got two adjoining plots in the same row. 7. Bina was the only one who got a plot in each row and each column. 8. Chitra and Dipti did not get plots which were adjacent to each other (either in row / column / diagonal). 9. The number of mango trees was double the number of teak trees.
Figure for this question

How many mango trees were there in total?

Q98CAT 2020✓ Answer verified

Trees Caselet CAT 2020 DILR Set

A farmer had a rectangular land containing 205 trees. He distributed that land among his four daughters – Abha, Bina, Chitra and Dipti by dividing the land into twelve plots along three rows (X,Y,Z) and four Columns (1,2,3,4) as shown in the figure below: The plots in rows X, Y, Z contained mango, teak and pine trees respectively. Each plot had trees in non-zero multiples of 3 or 4 and none of the plots had the same number of trees. Each daughter got an even number of plots. In the figure, the number mentioned in top left corner of a plot is the number of trees in that plot, while the letter in the bottom right corner is the first letter of the name of the daughter who got that plot (For example, Abha got the plot in row Y and column 1 containing 21 trees). Some information in the figure got erased, but the following is known: 1. Abha got 20 trees more than Chitra but 6 trees less than Dipti. 2. The largest number of trees in a plot was 32, but it was not with Abha. 3. The number of teak trees in Column 3 was double of that in Column 2 but was half of that in Column 4. 4. Both Abha and Bina got a higher number of plots than Dipti. 5. Only Bina, Chitra and Dipti got corner plots. 6. Dipti got two adjoining plots in the same row. 7. Bina was the only one who got a plot in each row and each column. 8. Chitra and Dipti did not get plots which were adjacent to each other (either in row / column / diagonal). 9. The number of mango trees was double the number of teak trees.
Figure for this questionFigure for this question

Which of the following is the correct sequence of trees received by Abha, Bina, Chitra and Dipti in that order?

Q99CAT 2020✓ Answer verified

Trees Caselet CAT 2020 DILR Set

A farmer had a rectangular land containing 205 trees. He distributed that land among his four daughters – Abha, Bina, Chitra and Dipti by dividing the land into twelve plots along three rows (X,Y,Z) and four Columns (1,2,3,4) as shown in the figure below: The plots in rows X, Y, Z contained mango, teak and pine trees respectively. Each plot had trees in non-zero multiples of 3 or 4 and none of the plots had the same number of trees. Each daughter got an even number of plots. In the figure, the number mentioned in top left corner of a plot is the number of trees in that plot, while the letter in the bottom right corner is the first letter of the name of the daughter who got that plot (For example, Abha got the plot in row Y and column 1 containing 21 trees). Some information in the figure got erased, but the following is known: 1. Abha got 20 trees more than Chitra but 6 trees less than Dipti. 2. The largest number of trees in a plot was 32, but it was not with Abha. 3. The number of teak trees in Column 3 was double of that in Column 2 but was half of that in Column 4. 4. Both Abha and Bina got a higher number of plots than Dipti. 5. Only Bina, Chitra and Dipti got corner plots. 6. Dipti got two adjoining plots in the same row. 7. Bina was the only one who got a plot in each row and each column. 8. Chitra and Dipti did not get plots which were adjacent to each other (either in row / column / diagonal). 9. The number of mango trees was double the number of teak trees.
Figure for this questionFigure for this question

How many pine trees did Chitra receive?

Q100CAT 2020

Trees Caselet CAT 2020 DILR Set

A farmer had a rectangular land containing 205 trees. He distributed that land among his four daughters – Abha, Bina, Chitra and Dipti by dividing the land into twelve plots along three rows (X,Y,Z) and four Columns (1,2,3,4) as shown in the figure below: The plots in rows X, Y, Z contained mango, teak and pine trees respectively. Each plot had trees in non-zero multiples of 3 or 4 and none of the plots had the same number of trees. Each daughter got an even number of plots. In the figure, the number mentioned in top left corner of a plot is the number of trees in that plot, while the letter in the bottom right corner is the first letter of the name of the daughter who got that plot (For example, Abha got the plot in row Y and column 1 containing 21 trees). Some information in the figure got erased, but the following is known: 1. Abha got 20 trees more than Chitra but 6 trees less than Dipti. 2. The largest number of trees in a plot was 32, but it was not with Abha. 3. The number of teak trees in Column 3 was double of that in Column 2 but was half of that in Column 4. 4. Both Abha and Bina got a higher number of plots than Dipti. 5. Only Bina, Chitra and Dipti got corner plots. 6. Dipti got two adjoining plots in the same row. 7. Bina was the only one who got a plot in each row and each column. 8. Chitra and Dipti did not get plots which were adjacent to each other (either in row / column / diagonal). 9. The number of mango trees was double the number of teak trees.
Figure for this questionFigure for this question

Who got the plot with the smallest number of trees and how many trees did that plot have?

Q101CAT 2020✓ Answer verified

Trees Caselet CAT 2020 DILR Set

A farmer had a rectangular land containing 205 trees. He distributed that land among his four daughters – Abha, Bina, Chitra and Dipti by dividing the land into twelve plots along three rows (X,Y,Z) and four Columns (1,2,3,4) as shown in the figure below: The plots in rows X, Y, Z contained mango, teak and pine trees respectively. Each plot had trees in non-zero multiples of 3 or 4 and none of the plots had the same number of trees. Each daughter got an even number of plots. In the figure, the number mentioned in top left corner of a plot is the number of trees in that plot, while the letter in the bottom right corner is the first letter of the name of the daughter who got that plot (For example, Abha got the plot in row Y and column 1 containing 21 trees). Some information in the figure got erased, but the following is known: 1. Abha got 20 trees more than Chitra but 6 trees less than Dipti. 2. The largest number of trees in a plot was 32, but it was not with Abha. 3. The number of teak trees in Column 3 was double of that in Column 2 but was half of that in Column 4. 4. Both Abha and Bina got a higher number of plots than Dipti. 5. Only Bina, Chitra and Dipti got corner plots. 6. Dipti got two adjoining plots in the same row. 7. Bina was the only one who got a plot in each row and each column. 8. Chitra and Dipti did not get plots which were adjacent to each other (either in row / column / diagonal). 9. The number of mango trees was double the number of teak trees.
Figure for this questionFigure for this question

Which of the following statements is NOT true?

Q102CAT 2020✓ Answer verified

Trees Caselet CAT 2020 DILR Set

A farmer had a rectangular land containing 205 trees. He distributed that land among his four daughters – Abha, Bina, Chitra and Dipti by dividing the land into twelve plots along three rows (X,Y,Z) and four Columns (1,2,3,4) as shown in the figure below: The plots in rows X, Y, Z contained mango, teak and pine trees respectively. Each plot had trees in non-zero multiples of 3 or 4 and none of the plots had the same number of trees. Each daughter got an even number of plots. In the figure, the number mentioned in top left corner of a plot is the number of trees in that plot, while the letter in the bottom right corner is the first letter of the name of the daughter who got that plot (For example, Abha got the plot in row Y and column 1 containing 21 trees). Some information in the figure got erased, but the following is known: 1. Abha got 20 trees more than Chitra but 6 trees less than Dipti. 2. The largest number of trees in a plot was 32, but it was not with Abha. 3. The number of teak trees in Column 3 was double of that in Column 2 but was half of that in Column 4. 4. Both Abha and Bina got a higher number of plots than Dipti. 5. Only Bina, Chitra and Dipti got corner plots. 6. Dipti got two adjoining plots in the same row. 7. Bina was the only one who got a plot in each row and each column. 8. Chitra and Dipti did not get plots which were adjacent to each other (either in row / column / diagonal). 9. The number of mango trees was double the number of teak trees.
Figure for this questionFigure for this question

Which column had the highest number of trees?

Q103CAT 2019 · TITA✓ Answer verified

Game Show

A new game show on TV has 100 boxes numbered 1, 2, . . . , 100 in a row, each containing a mystery prize. The prizes are items of different types, a, b, c, . . . , in decreasing order of value. The most expensive item is of type a, a diamond ring, and there is exactly one of these. You are told that the number of items at least doubles as you move to the next type. For example, there would be at least twice as many items of type b as of type a, at least twice as many items of type c as of type b and so on. There is no particular order in which the prizes are placed in the boxes.

What is the minimum possible number of different types of prizes?

Q104CAT 2019 · TITA✓ Answer verified

Game Show

A new game show on TV has 100 boxes numbered 1, 2, . . . , 100 in a row, each containing a mystery prize. The prizes are items of different types, a, b, c, . . . , in decreasing order of value. The most expensive item is of type a, a diamond ring, and there is exactly one of these. You are told that the number of items at least doubles as you move to the next type. For example, there would be at least twice as many items of type b as of type a, at least twice as many items of type c as of type b and so on. There is no particular order in which the prizes are placed in the boxes.

What is the maximum possible number of different types of prizes?

Q105CAT 2019✓ Answer verified

Game Show

A new game show on TV has 100 boxes numbered 1, 2, . . . , 100 in a row, each containing a mystery prize. The prizes are items of different types, a, b, c, . . . , in decreasing order of value. The most expensive item is of type a, a diamond ring, and there is exactly one of these. You are told that the number of items at least doubles as you move to the next type. For example, there would be at least twice as many items of type b as of type a, at least twice as many items of type c as of type b and so on. There is no particular order in which the prizes are placed in the boxes.

Which of the following is not possible?

Q106CAT 2019✓ Answer verified

Game Show

A new game show on TV has 100 boxes numbered 1, 2, . . . , 100 in a row, each containing a mystery prize. The prizes are items of different types, a, b, c, . . . , in decreasing order of value. The most expensive item is of type a, a diamond ring, and there is exactly one of these. You are told that the number of items at least doubles as you move to the next type. For example, there would be at least twice as many items of type b as of type a, at least twice as many items of type c as of type b and so on. There is no particular order in which the prizes are placed in the boxes.

You ask for the type of item in box 45. Instead of being given a direct answer, you are told that there are 31 items of the same type as box 45 in boxes 1 to 44 and 43 items of the same type as box 45 in boxes 46 to 100. What is the maximum possible number of different types of item

Q107CAT 2019✓ Answer verified
Five vendors are being considered for a service. The evaluation committee evaluated each vendor on six aspects – Cost, Customer Service, Features, Quality, Reach, and Reliability. Each of these evaluations are on a scale of 0 (worst) to 100 (perfect). The evaluation scores on these aspects are shown in the radar chart. For example, Vendor 1 obtains a score of 52 on Reliability, Vendor 2 obtains a score of 45 on Features and Vendor 3 obtains a score of 90 on Cost.
Figure for this question

Q.1 On which aspect is the median score of the five vendors the least?

Q108CAT 2019✓ Answer verified
Five vendors are being considered for a service. The evaluation committee evaluated each vendor on six aspects – Cost, Customer Service, Features, Quality, Reach, and Reliability. Each of these evaluations are on a scale of 0 (worst) to 100 (perfect). The evaluation scores on these aspects are shown in the radar chart. For example, Vendor 1 obtains a score of 52 on Reliability, Vendor 2 obtains a score of 45 on Features and Vendor 3 obtains a score of 90 on Cost.
Figure for this question

Q.2 A vendor’s final score is the average of their scores on all six aspects. Which vendor has the highest final score?

Q109CAT 2019✓ Answer verified
Five vendors are being considered for a service. The evaluation committee evaluated each vendor on six aspects – Cost, Customer Service, Features, Quality, Reach, and Reliability. Each of these evaluations are on a scale of 0 (worst) to 100 (perfect). The evaluation scores on these aspects are shown in the radar chart. For example, Vendor 1 obtains a score of 52 on Reliability, Vendor 2 obtains a score of 45 on Features and Vendor 3 obtains a score of 90 on Cost.
Figure for this question

Q.3 List of all the vendors who are among the top two scorers on the maximum number of aspects is:

Q110CAT 2019✓ Answer verified
Five vendors are being considered for a service. The evaluation committee evaluated each vendor on six aspects – Cost, Customer Service, Features, Quality, Reach, and Reliability. Each of these evaluations are on a scale of 0 (worst) to 100 (perfect). The evaluation scores on these aspects are shown in the radar chart. For example, Vendor 1 obtains a score of 52 on Reliability, Vendor 2 obtains a score of 45 on Features and Vendor 3 obtains a score of 90 on Cost.
Figure for this question

Q.4 List of all the vendors who are among the top three vendors on all six aspects is:

Q111CAT 2018 · Slot 1✓ Answer verified

Set 1: Written Test

A company administers a written test comprising of three sections of 20 marks each – Data Interpretation (DI), Written English (WE) and General Awareness (GA), for recruitment. A composite score for a candidate (out of 80) is calculated by doubling her marks in DI and adding it to the sum of her marks in the other two sections. Candidates who score less than 70% marks in two or more sections are disqualified. From among the rest, the four with the highest composite scores are recruited. If four or less candidates qualify, all who qualify are recruited. Ten candidates appeared for the written test. Their marks in the test are given in the table below: Some marks in the table are missing, but the following facts are known: 1. No two candidates had the same composite score. 2. Ajay was the unique highest scorer in WE. 3. Among the four recruited, Geeta had the lowest composite score. 4. Indu was recruited. 5. Danish, Harini, and Indu had scored the same marks the in GA. 6. Indu and Jatin both scored 100% in exactly one section and Jatin’s composite score was 10 more than Indu’s.
Figure for this questionFigure for this questionFigure for this questionFigure for this questionFigure for this questionFigure for this question

Which of the following statements MUST be true? a. Jatin's composite score was more than that of Danish. b. Indu scored less than Chetna in DI. c. Jatin scored more than Indu in GA.

Q112CAT 2018 · Slot 1✓ Answer verified

Set 1: Written Test

A company administers a written test comprising of three sections of 20 marks each – Data Interpretation (DI), Written English (WE) and General Awareness (GA), for recruitment. A composite score for a candidate (out of 80) is calculated by doubling her marks in DI and adding it to the sum of her marks in the other two sections. Candidates who score less than 70% marks in two or more sections are disqualified. From among the rest, the four with the highest composite scores are recruited. If four or less candidates qualify, all who qualify are recruited. Ten candidates appeared for the written test. Their marks in the test are given in the table below: Some marks in the table are missing, but the following facts are known: 1. No two candidates had the same composite score. 2. Ajay was the unique highest scorer in WE. 3. Among the four recruited, Geeta had the lowest composite score. 4. Indu was recruited. 5. Danish, Harini, and Indu had scored the same marks the in GA. 6. Indu and Jatin both scored 100% in exactly one section and Jatin’s composite score was 10 more than Indu’s.
Figure for this questionFigure for this questionFigure for this questionFigure for this questionFigure for this questionFigure for this question

Which of the following statements MUST be FALSE?

Q113CAT 2018 · Slot 1 · TITA✓ Answer verified

Set 1: Written Test

A company administers a written test comprising of three sections of 20 marks each – Data Interpretation (DI), Written English (WE) and General Awareness (GA), for recruitment. A composite score for a candidate (out of 80) is calculated by doubling her marks in DI and adding it to the sum of her marks in the other two sections. Candidates who score less than 70% marks in two or more sections are disqualified. From among the rest, the four with the highest composite scores are recruited. If four or less candidates qualify, all who qualify are recruited. Ten candidates appeared for the written test. Their marks in the test are given in the table below: Some marks in the table are missing, but the following facts are known: 1. No two candidates had the same composite score. 2. Ajay was the unique highest scorer in WE. 3. Among the four recruited, Geeta had the lowest composite score. 4. Indu was recruited. 5. Danish, Harini, and Indu had scored the same marks the in GA. 6. Indu and Jatin both scored 100% in exactly one section and Jatin’s composite score was 10 more than Indu’s.
Figure for this questionFigure for this questionFigure for this questionFigure for this questionFigure for this questionFigure for this question

If all the candidates except Ajay and Danish had different marks in DI, and Bala's composite score was less than Chetna's composite score, then what is the maximum marks that Bala could have scored in DI? (TITA)

Q114CAT 2018 · Slot 1 · TITA✓ Answer verified

Set 1: Written Test

A company administers a written test comprising of three sections of 20 marks each – Data Interpretation (DI), Written English (WE) and General Awareness (GA), for recruitment. A composite score for a candidate (out of 80) is calculated by doubling her marks in DI and adding it to the sum of her marks in the other two sections. Candidates who score less than 70% marks in two or more sections are disqualified. From among the rest, the four with the highest composite scores are recruited. If four or less candidates qualify, all who qualify are recruited. Ten candidates appeared for the written test. Their marks in the test are given in the table below: Some marks in the table are missing, but the following facts are known: 1. No two candidates had the same composite score. 2. Ajay was the unique highest scorer in WE. 3. Among the four recruited, Geeta had the lowest composite score. 4. Indu was recruited. 5. Danish, Harini, and Indu had scored the same marks the in GA. 6. Indu and Jatin both scored 100% in exactly one section and Jatin’s composite score was 10 more than Indu’s.
Figure for this questionFigure for this questionFigure for this questionFigure for this questionFigure for this questionFigure for this question

If all the candidates scored different marks in WE then what is the maximum marks that Harini could have scored in WE? (TITA)

Q115CAT 2018 · Slot 1 · TITA✓ Answer verified

Set 5 : ATM

An ATM dispenses exactly Rs. 5000 per withdrawal using 100, 200 and 500 rupee notes. The ATM requires every customer to give her preference for one of the three denominations of notes. It then dispenses notes such that the number of notes of the customer’s preferred denomination exceeds the total number of notes of other denominations dispensed to her.
Figure for this questionFigure for this questionFigure for this question

In how many different ways can the ATM serve a customer who gives 500 rupee notes as her preference? (TITA)

Q116CAT 2018 · Slot 1 · TITA✓ Answer verified

Set 5 : ATM

An ATM dispenses exactly Rs. 5000 per withdrawal using 100, 200 and 500 rupee notes. The ATM requires every customer to give her preference for one of the three denominations of notes. It then dispenses notes such that the number of notes of the customer’s preferred denomination exceeds the total number of notes of other denominations dispensed to her.
Figure for this question

If the ATM could serve only 10 customers with a stock of fifty 500 rupee notes and a sufficient number of notes of other denominations, what is the maximum number of customers among these 10 who could have given 500 rupee notes as their preferences? (TITA)

Q117CAT 2018 · Slot 1✓ Answer verified

Set 5 : ATM

An ATM dispenses exactly Rs. 5000 per withdrawal using 100, 200 and 500 rupee notes. The ATM requires every customer to give her preference for one of the three denominations of notes. It then dispenses notes such that the number of notes of the customer’s preferred denomination exceeds the total number of notes of other denominations dispensed to her.
Figure for this questionFigure for this question

What is the maximum number of customers that the ATM can serve with a stock of fifty 500 rupee notes and a sufficient number of notes of other denominations, if all the customers are to be served with at most 20 notes per withdrawal?

Q118CAT 2018 · Slot 1✓ Answer verified

Set 5 : ATM

An ATM dispenses exactly Rs. 5000 per withdrawal using 100, 200 and 500 rupee notes. The ATM requires every customer to give her preference for one of the three denominations of notes. It then dispenses notes such that the number of notes of the customer’s preferred denomination exceeds the total number of notes of other denominations dispensed to her.
Figure for this questionFigure for this question

What is the number of 500 rupee notes required to serve 50 customers with 500 rupee notes as their preferences and another 50 customers with 100 rupee notes as their preferences, if the total number of notes to be dispensed is the smallest possible?

Q119CAT 2018 · Slot 1✓ Answer verified

Set 6 : Petrol Pumps

Fuel contamination levels at each of 20 petrol pumps P1, P2, …, P20 were recorded as either high, medium, or low. 1. Contamination levels at three pumps among P1 – P5 were recorded as high. 2. P6 was the only pump among P1 – P10 where the contamination level was recorded as low. 3. P7 and P8 were the only two consecutively numbered pumps where the same levels of contamination were recorded. 4. High contamination levels were not recorded at any of the pumps P16 – P20. 5. The number of pumps where high contamination levels were recorded was twice the number of pumps where low contamination levels were recorded.
Figure for this questionFigure for this questionFigure for this questionFigure for this questionFigure for this questionFigure for this question

Which of the following MUST be true?

Q120CAT 2018 · Slot 1✓ Answer verified

Set 6 : Petrol Pumps

Fuel contamination levels at each of 20 petrol pumps P1, P2, …, P20 were recorded as either high, medium, or low. 1. Contamination levels at three pumps among P1 – P5 were recorded as high. 2. P6 was the only pump among P1 – P10 where the contamination level was recorded as low. 3. P7 and P8 were the only two consecutively numbered pumps where the same levels of contamination were recorded. 4. High contamination levels were not recorded at any of the pumps P16 – P20. 5. The number of pumps where high contamination levels were recorded was twice the number of pumps where low contamination levels were recorded.
Figure for this questionFigure for this questionFigure for this questionFigure for this questionFigure for this questionFigure for this question

What best can be said about the number of pumps at which the contamination levels were recorded as medium?

Q121CAT 2018 · Slot 1✓ Answer verified

Set 6 : Petrol Pumps

Fuel contamination levels at each of 20 petrol pumps P1, P2, …, P20 were recorded as either high, medium, or low. 1. Contamination levels at three pumps among P1 – P5 were recorded as high. 2. P6 was the only pump among P1 – P10 where the contamination level was recorded as low. 3. P7 and P8 were the only two consecutively numbered pumps where the same levels of contamination were recorded. 4. High contamination levels were not recorded at any of the pumps P16 – P20. 5. The number of pumps where high contamination levels were recorded was twice the number of pumps where low contamination levels were recorded.
Figure for this questionFigure for this questionFigure for this questionFigure for this questionFigure for this questionFigure for this question

If the contamination level at P11 was recorded as low, then which of the following MUST be true?

Q122CAT 2018 · Slot 1✓ Answer verified

Set 6 : Petrol Pumps

Fuel contamination levels at each of 20 petrol pumps P1, P2, …, P20 were recorded as either high, medium, or low. 1. Contamination levels at three pumps among P1 – P5 were recorded as high. 2. P6 was the only pump among P1 – P10 where the contamination level was recorded as low. 3. P7 and P8 were the only two consecutively numbered pumps where the same levels of contamination were recorded. 4. High contamination levels were not recorded at any of the pumps P16 – P20. 5. The number of pumps where high contamination levels were recorded was twice the number of pumps where low contamination levels were recorded.
Figure for this questionFigure for this questionFigure for this questionFigure for this questionFigure for this questionFigure for this question

If contamination level at P15 was recorded as medium, then which of the following MUST be FALSE?

Q123CAT 2017 · Slot 1✓ Answer verified

Common Entrance Test

Applicants for the doctoral programmes of Ambi Institute of Engineering (AIE) and Bambi Institute of Engineering (BIE) have to appear for a Common Entrance Test (CET). The test has three sections: Physics (P), Chemistry (C), and Maths (M). Among those appearing for CET, those at or above the 80th percentile in at least two sections, and at or above the 90th percentile overall, are selected for Advanced Entrance Test (AET) conducted by AIE. AET is used by AIE for final selection. For the 200 candidates who are at or above the 90th percentile overall based on CET, the following are known about their performance in CET: 1.No one is below the 80th percentile in all 3 sections. 2.150 are at or above the 80th percentile in exactly two sections. 3.The number of candidates at or above the 80th percentile only in P is the same as the number of candidates at or above the 80th percentile only in C. The same is the number of candidates at or above the 80th percentile only in M. 4.Number of candidates below 80th percentile in P: Number of candidates below 80th percentile in C: Number of candidates below 80th percentile in M = 4:2:1. BIE uses a different process for selection. If any candidate is appearing in the AET by AIE, BIE considers their AET score for final selection provided the candidate is at or above the 80th percentile in P. Any other candidate at or above the 80th percentile in P in CET, but who is not eligible for the AET, is required to appear in a separate test to be conducted by BIE for being considered for final selection. Altogether, there are 400 candidates this year who are at or above the 80th percentile in P.
Figure for this questionFigure for this questionFigure for this questionFigure for this question

What best can be concluded about the number of candidates sitting for the separate test for BIE who were at or above the 90th percentile overall in CET?

Q124CAT 2017 · Slot 1 · TITA✓ Answer verified

Common Entrance Test

Applicants for the doctoral programmes of Ambi Institute of Engineering (AIE) and Bambi Institute of Engineering (BIE) have to appear for a Common Entrance Test (CET). The test has three sections: Physics (P), Chemistry (C), and Maths (M). Among those appearing for CET, those at or above the 80th percentile in at least two sections, and at or above the 90th percentile overall, are selected for Advanced Entrance Test (AET) conducted by AIE. AET is used by AIE for final selection. For the 200 candidates who are at or above the 90th percentile overall based on CET, the following are known about their performance in CET: 1.No one is below the 80th percentile in all 3 sections. 2.150 are at or above the 80th percentile in exactly two sections. 3.The number of candidates at or above the 80th percentile only in P is the same as the number of candidates at or above the 80th percentile only in C. The same is the number of candidates at or above the 80th percentile only in M. 4.Number of candidates below 80th percentile in P: Number of candidates below 80th percentile in C: Number of candidates below 80th percentile in M = 4:2:1. BIE uses a different process for selection. If any candidate is appearing in the AET by AIE, BIE considers their AET score for final selection provided the candidate is at or above the 80th percentile in P. Any other candidate at or above the 80th percentile in P in CET, but who is not eligible for the AET, is required to appear in a separate test to be conducted by BIE for being considered for final selection. Altogether, there are 400 candidates this year who are at or above the 80th percentile in P.
Figure for this questionFigure for this questionFigure for this question

If the number of candidates who are at or above the 90th percentile overall and also at or above the 80th percentile in all three sections in CET is actually a multiple of 5, what is the number of candidates who are at or above the 90th percentile overall and at or above the 80th percentile in both P and M in CET? (TITA)

Q125CAT 2017 · Slot 1✓ Answer verified

Rural Kids Survey

A study to look at the early learning of rural kids was carried out in a number of village spanning three states, chosen from the North East (NE), the West (W) and the South (S). 50 four-year old kids each were sampled from each of the 150 villages from NE, 250 villages from W and 200 villages from S. It was found that of the 30000 surveyed kids 55% studied in primary schools run by government (G), 37% in private schools (P) while the remaining 8% did not go to school (O). The kids surveyed were further divided into two groups based on whether their mothers dropped out of school before completing primary education or not. The table below gives the number of kids in different type of schools for mothers who dropped out of school before completing primary education: It is also known that: 1. In S, 60% of the surveyed kids were in G. Moreover, in S, all surveyed kids whose mothers had completed primary education were in school. 2. In NE, among the O kids, 50% had mothers who had dropped out before completing primary education. 3. The number of kids in G in NE was the same as the number of kids in G in W.
Figure for this questionFigure for this questionFigure for this questionFigure for this questionFigure for this questionFigure for this question

What percentage of kids from S were studying in P?

Q126CAT 2017 · Slot 1✓ Answer verified

Rural Kids Survey

A study to look at the early learning of rural kids was carried out in a number of village spanning three states, chosen from the North East (NE), the West (W) and the South (S). 50 four-year old kids each were sampled from each of the 150 villages from NE, 250 villages from W and 200 villages from S. It was found that of the 30000 surveyed kids 55% studied in primary schools run by government (G), 37% in private schools (P) while the remaining 8% did not go to school (O). The kids surveyed were further divided into two groups based on whether their mothers dropped out of school before completing primary education or not. The table below gives the number of kids in different type of schools for mothers who dropped out of school before completing primary education: It is also known that: 1. In S, 60% of the surveyed kids were in G. Moreover, in S, all surveyed kids whose mothers had completed primary education were in school. 2. In NE, among the O kids, 50% had mothers who had dropped out before completing primary education. 3. The number of kids in G in NE was the same as the number of kids in G in W.
Figure for this questionFigure for this questionFigure for this questionFigure for this questionFigure for this questionFigure for this question

Among the kids in W whose mothers had completed primary education, how many were not in school?

Q127CAT 2017 · Slot 1✓ Answer verified

Rural Kids Survey

A study to look at the early learning of rural kids was carried out in a number of village spanning three states, chosen from the North East (NE), the West (W) and the South (S). 50 four-year old kids each were sampled from each of the 150 villages from NE, 250 villages from W and 200 villages from S. It was found that of the 30000 surveyed kids 55% studied in primary schools run by government (G), 37% in private schools (P) while the remaining 8% did not go to school (O). The kids surveyed were further divided into two groups based on whether their mothers dropped out of school before completing primary education or not. The table below gives the number of kids in different type of schools for mothers who dropped out of school before completing primary education: It is also known that: 1. In S, 60% of the surveyed kids were in G. Moreover, in S, all surveyed kids whose mothers had completed primary education were in school. 2. In NE, among the O kids, 50% had mothers who had dropped out before completing primary education. 3. The number of kids in G in NE was the same as the number of kids in G in W.
Figure for this questionFigure for this questionFigure for this questionFigure for this questionFigure for this questionFigure for this question

In a follow up survey of the same kids two years later, it was found that all the kids were now in school. Of the kids who were not in school earlier, in one region, 25% were in G now, whereas the rest were enrolled in P; in the second region, all such kids were in G now; while in the third region, 50% of such kids had now joined G while the rest had joined P. As a result, in all three regions put together, 50% of the kids who were earlier out of school had joined G. It was also seen that no surveyed kid had changed schools. What number of the surveyed kids now were in G in W?

Q128CAT 2006 · CAT Easy

Erdős number

Mathematicians are assigned a number called the Erdős number (named after the famous mathematician Paul Erdős). Only Paul Erdős himself has an Erdős number of 0. Any mathematician who has written a research paper with Erdős has an Erdős number of 1. For other mathematicians: Suppose mathematician X has co-authored papers with several others. Among them, mathematician Y has the smallest Erdős number (y). Then, X's Erdős number is y + 1. If no co-authorship chain connects to Erdős, the Erdős number is ∞ (∞). Conference Scenario: A seven-day mini-conference was organized in memory of Paul Erdős, with eight mathematicians: A, B, C, D, E, F, G, H. Initial Conditions: At the start of the conference: A was the only participant with an infinite (∞) Erdős number. Nobody had an Erdős number less than F's (i.e., F had the smallest). Key Events: Day 3: F co-authored a paper with A and C. This reduced the average Erdős number of the group to 3. The Erdős numbers of B, D, E, G, H remained unchanged. No other co-authorship among any three members could have reduced the average to 3. At the end of Day 3: Five members had identical Erdős numbers. The other three had distinct Erdős numbers. Day 5: E co-authored a paper with F. This reduced the group’s average Erdős number by 0.5. The Erdős numbers of the other six remained unchanged. No other papers were written during the conference.

Who had an Erdös number of ∞ at the beginning of the conference?

Q129CAT 2006 · CAT Easy

Erdős number

Mathematicians are assigned a number called the Erdős number (named after the famous mathematician Paul Erdős). Only Paul Erdős himself has an Erdős number of 0. Any mathematician who has written a research paper with Erdős has an Erdős number of 1. For other mathematicians: Suppose mathematician X has co-authored papers with several others. Among them, mathematician Y has the smallest Erdős number (y). Then, X's Erdős number is y + 1. If no co-authorship chain connects to Erdős, the Erdős number is ∞ (∞). Conference Scenario: A seven-day mini-conference was organized in memory of Paul Erdős, with eight mathematicians: A, B, C, D, E, F, G, H. Initial Conditions: At the start of the conference: A was the only participant with an infinite (∞) Erdős number. Nobody had an Erdős number less than F's (i.e., F had the smallest). Key Events: Day 3: F co-authored a paper with A and C. This reduced the average Erdős number of the group to 3. The Erdős numbers of B, D, E, G, H remained unchanged. No other co-authorship among any three members could have reduced the average to 3. At the end of Day 3: Five members had identical Erdős numbers. The other three had distinct Erdős numbers. Day 5: E co-authored a paper with F. This reduced the group’s average Erdős number by 0.5. The Erdős numbers of the other six remained unchanged. No other papers were written during the conference.

What can be said about the Erdös number of F at the start of the conference?

Q130CAT 2006 · CAT Easy

Erdős number

Mathematicians are assigned a number called the Erdős number (named after the famous mathematician Paul Erdős). Only Paul Erdős himself has an Erdős number of 0. Any mathematician who has written a research paper with Erdős has an Erdős number of 1. For other mathematicians: Suppose mathematician X has co-authored papers with several others. Among them, mathematician Y has the smallest Erdős number (y). Then, X's Erdős number is y + 1. If no co-authorship chain connects to Erdős, the Erdős number is ∞ (∞). Conference Scenario: A seven-day mini-conference was organized in memory of Paul Erdős, with eight mathematicians: A, B, C, D, E, F, G, H. Initial Conditions: At the start of the conference: A was the only participant with an infinite (∞) Erdős number. Nobody had an Erdős number less than F's (i.e., F had the smallest). Key Events: Day 3: F co-authored a paper with A and C. This reduced the average Erdős number of the group to 3. The Erdős numbers of B, D, E, G, H remained unchanged. No other co-authorship among any three members could have reduced the average to 3. At the end of Day 3: Five members had identical Erdős numbers. The other three had distinct Erdős numbers. Day 5: E co-authored a paper with F. This reduced the group’s average Erdős number by 0.5. The Erdős numbers of the other six remained unchanged. No other papers were written during the conference.

If F’s Erdös number is denoted by y, then after co-authoring a paper with F, what will be A’s new Erdös number?

Q131CAT 2006 · CAT Easy

Erdős number

Mathematicians are assigned a number called the Erdős number (named after the famous mathematician Paul Erdős). Only Paul Erdős himself has an Erdős number of 0. Any mathematician who has written a research paper with Erdős has an Erdős number of 1. For other mathematicians: Suppose mathematician X has co-authored papers with several others. Among them, mathematician Y has the smallest Erdős number (y). Then, X's Erdős number is y + 1. If no co-authorship chain connects to Erdős, the Erdős number is ∞ (∞). Conference Scenario: A seven-day mini-conference was organized in memory of Paul Erdős, with eight mathematicians: A, B, C, D, E, F, G, H. Initial Conditions: At the start of the conference: A was the only participant with an infinite (∞) Erdős number. Nobody had an Erdős number less than F's (i.e., F had the smallest). Key Events: Day 3: F co-authored a paper with A and C. This reduced the average Erdős number of the group to 3. The Erdős numbers of B, D, E, G, H remained unchanged. No other co-authorship among any three members could have reduced the average to 3. At the end of Day 3: Five members had identical Erdős numbers. The other three had distinct Erdős numbers. Day 5: E co-authored a paper with F. This reduced the group’s average Erdős number by 0.5. The Erdős numbers of the other six remained unchanged. No other papers were written during the conference.

What was the total sum of Erdös numbers of all 8 participants at the end of Day 3?

Q132CAT 2006 · CAT Easy

Erdős number

Mathematicians are assigned a number called the Erdős number (named after the famous mathematician Paul Erdős). Only Paul Erdős himself has an Erdős number of 0. Any mathematician who has written a research paper with Erdős has an Erdős number of 1. For other mathematicians: Suppose mathematician X has co-authored papers with several others. Among them, mathematician Y has the smallest Erdős number (y). Then, X's Erdős number is y + 1. If no co-authorship chain connects to Erdős, the Erdős number is ∞ (∞). Conference Scenario: A seven-day mini-conference was organized in memory of Paul Erdős, with eight mathematicians: A, B, C, D, E, F, G, H. Initial Conditions: At the start of the conference: A was the only participant with an infinite (∞) Erdős number. Nobody had an Erdős number less than F's (i.e., F had the smallest). Key Events: Day 3: F co-authored a paper with A and C. This reduced the average Erdős number of the group to 3. The Erdős numbers of B, D, E, G, H remained unchanged. No other co-authorship among any three members could have reduced the average to 3. At the end of Day 3: Five members had identical Erdős numbers. The other three had distinct Erdős numbers. Day 5: E co-authored a paper with F. This reduced the group’s average Erdős number by 0.5. The Erdős numbers of the other six remained unchanged. No other papers were written during the conference.

At the end of Day 3, how many participants had the same Erdös number?

Q133CAT 2006 · CAT Easy

Erdős number

Mathematicians are assigned a number called the Erdős number (named after the famous mathematician Paul Erdős). Only Paul Erdős himself has an Erdős number of 0. Any mathematician who has written a research paper with Erdős has an Erdős number of 1. For other mathematicians: Suppose mathematician X has co-authored papers with several others. Among them, mathematician Y has the smallest Erdős number (y). Then, X's Erdős number is y + 1. If no co-authorship chain connects to Erdős, the Erdős number is ∞ (∞). Conference Scenario: A seven-day mini-conference was organized in memory of Paul Erdős, with eight mathematicians: A, B, C, D, E, F, G, H. Initial Conditions: At the start of the conference: A was the only participant with an infinite (∞) Erdős number. Nobody had an Erdős number less than F's (i.e., F had the smallest). Key Events: Day 3: F co-authored a paper with A and C. This reduced the average Erdős number of the group to 3. The Erdős numbers of B, D, E, G, H remained unchanged. No other co-authorship among any three members could have reduced the average to 3. At the end of Day 3: Five members had identical Erdős numbers. The other three had distinct Erdős numbers. Day 5: E co-authored a paper with F. This reduced the group’s average Erdős number by 0.5. The Erdős numbers of the other six remained unchanged. No other papers were written during the conference.

Who were the three participants whose Erdös numbers remained distinct from the rest after Day 3?

Q134CAT 2006

Erdős number

Mathematicians are assigned a number called the Erdős number (named after the famous mathematician Paul Erdős). Only Paul Erdős himself has an Erdős number of 0. Any mathematician who has written a research paper with Erdős has an Erdős number of 1. For other mathematicians: Suppose mathematician X has co-authored papers with several others. Among them, mathematician Y has the smallest Erdős number (y). Then, X's Erdős number is y + 1. If no co-authorship chain connects to Erdős, the Erdős number is ∞ (∞). Conference Scenario: A seven-day mini-conference was organized in memory of Paul Erdős, with eight mathematicians: A, B, C, D, E, F, G, H. Initial Conditions: At the start of the conference: A was the only participant with an infinite (∞) Erdős number. Nobody had an Erdős number less than F's (i.e., F had the smallest). Key Events: Day 3: F co-authored a paper with A and C. This reduced the average Erdős number of the group to 3. The Erdős numbers of B, D, E, G, H remained unchanged. No other co-authorship among any three members could have reduced the average to 3. At the end of Day 3: Five members had identical Erdős numbers. The other three had distinct Erdős numbers. Day 5: E co-authored a paper with F. This reduced the group’s average Erdős number by 0.5. The Erdős numbers of the other six remained unchanged. No other papers were written during the conference.

How many participants did not change their Erdős number during the conference?

Q135CAT 2006

Erdős number

Mathematicians are assigned a number called the Erdős number (named after the famous mathematician Paul Erdős). Only Paul Erdős himself has an Erdős number of 0. Any mathematician who has written a research paper with Erdős has an Erdős number of 1. For other mathematicians: Suppose mathematician X has co-authored papers with several others. Among them, mathematician Y has the smallest Erdős number (y). Then, X's Erdős number is y + 1. If no co-authorship chain connects to Erdős, the Erdős number is ∞ (∞). Conference Scenario: A seven-day mini-conference was organized in memory of Paul Erdős, with eight mathematicians: A, B, C, D, E, F, G, H. Initial Conditions: At the start of the conference: A was the only participant with an infinite (∞) Erdős number. Nobody had an Erdős number less than F's (i.e., F had the smallest). Key Events: Day 3: F co-authored a paper with A and C. This reduced the average Erdős number of the group to 3. The Erdős numbers of B, D, E, G, H remained unchanged. No other co-authorship among any three members could have reduced the average to 3. At the end of Day 3: Five members had identical Erdős numbers. The other three had distinct Erdős numbers. Day 5: E co-authored a paper with F. This reduced the group’s average Erdős number by 0.5. The Erdős numbers of the other six remained unchanged. No other papers were written during the conference.

The person with the largest Erdős number at the end must have had:

Q136CAT 2006

Erdős number

Mathematicians are assigned a number called the Erdős number (named after the famous mathematician Paul Erdős). Only Paul Erdős himself has an Erdős number of 0. Any mathematician who has written a research paper with Erdős has an Erdős number of 1. For other mathematicians: Suppose mathematician X has co-authored papers with several others. Among them, mathematician Y has the smallest Erdős number (y). Then, X's Erdős number is y + 1. If no co-authorship chain connects to Erdős, the Erdős number is ∞ (∞). Conference Scenario: A seven-day mini-conference was organized in memory of Paul Erdős, with eight mathematicians: A, B, C, D, E, F, G, H. Initial Conditions: At the start of the conference: A was the only participant with an infinite (∞) Erdős number. Nobody had an Erdős number less than F's (i.e., F had the smallest). Key Events: Day 3: F co-authored a paper with A and C. This reduced the average Erdős number of the group to 3. The Erdős numbers of B, D, E, G, H remained unchanged. No other co-authorship among any three members could have reduced the average to 3. At the end of Day 3: Five members had identical Erdős numbers. The other three had distinct Erdős numbers. Day 5: E co-authored a paper with F. This reduced the group’s average Erdős number by 0.5. The Erdős numbers of the other six remained unchanged. No other papers were written during the conference.

How many participants had the same Erdős number at the beginning?

Q137CAT 2006

Erdős number

Mathematicians are assigned a number called the Erdős number (named after the famous mathematician Paul Erdős). Only Paul Erdős himself has an Erdős number of 0. Any mathematician who has written a research paper with Erdős has an Erdős number of 1. For other mathematicians: Suppose mathematician X has co-authored papers with several others. Among them, mathematician Y has the smallest Erdős number (y). Then, X's Erdős number is y + 1. If no co-authorship chain connects to Erdős, the Erdős number is ∞ (∞). Conference Scenario: A seven-day mini-conference was organized in memory of Paul Erdős, with eight mathematicians: A, B, C, D, E, F, G, H. Initial Conditions: At the start of the conference: A was the only participant with an infinite (∞) Erdős number. Nobody had an Erdős number less than F's (i.e., F had the smallest). Key Events: Day 3: F co-authored a paper with A and C. This reduced the average Erdős number of the group to 3. The Erdős numbers of B, D, E, G, H remained unchanged. No other co-authorship among any three members could have reduced the average to 3. At the end of Day 3: Five members had identical Erdős numbers. The other three had distinct Erdős numbers. Day 5: E co-authored a paper with F. This reduced the group’s average Erdős number by 0.5. The Erdős numbers of the other six remained unchanged. No other papers were written during the conference.

The Erdős number of C at the end was:

Q138CAT 2006

Erdős number

Mathematicians are assigned a number called the Erdős number (named after the famous mathematician Paul Erdős). Only Paul Erdős himself has an Erdős number of 0. Any mathematician who has written a research paper with Erdős has an Erdős number of 1. For other mathematicians: Suppose mathematician X has co-authored papers with several others. Among them, mathematician Y has the smallest Erdős number (y). Then, X's Erdős number is y + 1. If no co-authorship chain connects to Erdős, the Erdős number is ∞ (∞). Conference Scenario: A seven-day mini-conference was organized in memory of Paul Erdős, with eight mathematicians: A, B, C, D, E, F, G, H. Initial Conditions: At the start of the conference: A was the only participant with an infinite (∞) Erdős number. Nobody had an Erdős number less than F's (i.e., F had the smallest). Key Events: Day 3: F co-authored a paper with A and C. This reduced the average Erdős number of the group to 3. The Erdős numbers of B, D, E, G, H remained unchanged. No other co-authorship among any three members could have reduced the average to 3. At the end of Day 3: Five members had identical Erdős numbers. The other three had distinct Erdős numbers. Day 5: E co-authored a paper with F. This reduced the group’s average Erdős number by 0.5. The Erdős numbers of the other six remained unchanged. No other papers were written during the conference.

The Erdős number of E at the beginning was:

0/138 tried · 0 right

Every question here appeared in an actual CAT paper. For the full paper, open its page from the question's year and slot, or browse another topic from the list. Also on IIMking.com.