CAT Venn Diagrams questions (2018–2024) — actual DILR sets with solutions
47 real CAT Venn Diagrams questions from CAT 2018 to CAT 2024, each with options, the verified answer and a step-by-step solution. Practice one topic at a time,
47 real CAT questions · CAT 2018–2024
Q1CAT 2024 · TITA
Countries
The chart below provides complete information about the number of countries visited by Dheeraj, Samantha and Nitesh, in Asia, Europe and the rest of the world (ROW). The following additional facts are known about the countries visited by them. 32 countries were visited by at least one of them. USA (in ROW) is the only country that was visited by all three of them. China (in Asia) is the only country that was visited by both Dheeraj and Nitesh, but not by Samantha. France (in Europe) is the only country outside Asia, which was visited by both Dheeraj and Samantha, but not by Nitesh. Half of the countries visited by both Samantha and Nitesh are in Europe.
How many countries in Asia were visited by at least one of Dheeraj, Samantha and Nitesh?
Q2CAT 2024 · TITA
Countries
The chart below provides complete information about the number of countries visited by Dheeraj, Samantha and Nitesh, in Asia, Europe and the rest of the world (ROW). The following additional facts are known about the countries visited by them. 32 countries were visited by at least one of them. USA (in ROW) is the only country that was visited by all three of them. China (in Asia) is the only country that was visited by both Dheeraj and Nitesh, but not by Samantha. France (in Europe) is the only country outside Asia, which was visited by both Dheeraj and Samantha, but not by Nitesh. Half of the countries visited by both Samantha and Nitesh are in Europe.
How many countries in Europe were visited only by Nitesh?
Q3CAT 2024 · TITA
Countries
The chart below provides complete information about the number of countries visited by Dheeraj, Samantha and Nitesh, in Asia, Europe and the rest of the world (ROW). The following additional facts are known about the countries visited by them. 32 countries were visited by at least one of them. USA (in ROW) is the only country that was visited by all three of them. China (in Asia) is the only country that was visited by both Dheeraj and Nitesh, but not by Samantha. France (in Europe) is the only country outside Asia, which was visited by both Dheeraj and Samantha, but not by Nitesh. Half of the countries visited by both Samantha and Nitesh are in Europe.
How many countries in the ROW were visited by both Nitesh and Samantha?
Q4CAT 2024
Countries
The chart below provides complete information about the number of countries visited by Dheeraj, Samantha and Nitesh, in Asia, Europe and the rest of the world (ROW). The following additional facts are known about the countries visited by them. 32 countries were visited by at least one of them. USA (in ROW) is the only country that was visited by all three of them. China (in Asia) is the only country that was visited by both Dheeraj and Nitesh, but not by Samantha. France (in Europe) is the only country outside Asia, which was visited by both Dheeraj and Samantha, but not by Nitesh. Half of the countries visited by both Samantha and Nitesh are in Europe.
How many countries in Europe were visited by exactly one of Dheeraj, Samantha and Nitesh?
Q5CAT 2022 · Slot 3✓ Answer verified
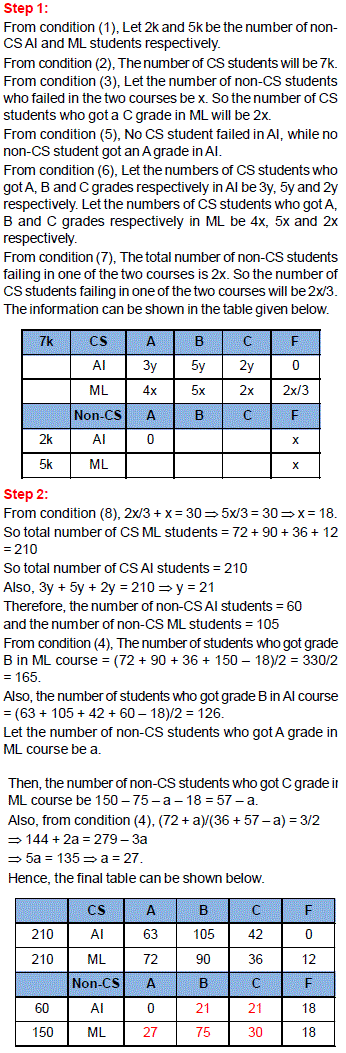
All the first-year students in the computer science (CS) department in a university take both the courses (i) AI and (ii) ML. Students from other departments (non-CS students) can also take one of these two courses, but not both. Students who fail in a course get an F grade; others pass and are awarded A or B or C grades depending on their performance. The following are some additional facts about the number of students who took these two courses this year and the grades they obtained. 1. The numbers of non-CS students who took AI and ML were in the ratio 2 : 5. 2. The number of non-CS students who took either AI or ML was equal to the number of CS students. 3. The numbers of non-CS students who failed in the two courses were the same and their total is equal to the number of CS students who got a C grade in ML. 4. In both the courses, 50% of the students who passed got a B grade. But, while the numbers of students who got A and C grades were the same for AI, they were in the ratio 3 : 2 for ML. 5. No CS student failed in AI, while no non-CS student got an A grade in AI. 6. The numbers of CS students who got A, B and C grades respectively in AI were in the ratio 3 : 5 : 2, while in ML the ratio was 4 : 5 : 2. 7. The ratio of the total number of non-CS students failing in one of the two courses to the number of CS students failing in one of the two courses was 3 : 1. 8. 30 students failed in ML.
How many students took AI?
Q6CAT 2022 · Slot 3 · TITA✓ Answer verified
All the first-year students in the computer science (CS) department in a university take both the courses (i) AI and (ii) ML. Students from other departments (non-CS students) can also take one of these two courses, but not both. Students who fail in a course get an F grade; others pass and are awarded A or B or C grades depending on their performance. The following are some additional facts about the number of students who took these two courses this year and the grades they obtained. 1. The numbers of non-CS students who took AI and ML were in the ratio 2 : 5. 2. The number of non-CS students who took either AI or ML was equal to the number of CS students. 3. The numbers of non-CS students who failed in the two courses were the same and their total is equal to the number of CS students who got a C grade in ML. 4. In both the courses, 50% of the students who passed got a B grade. But, while the numbers of students who got A and C grades were the same for AI, they were in the ratio 3 : 2 for ML. 5. No CS student failed in AI, while no non-CS student got an A grade in AI. 6. The numbers of CS students who got A, B and C grades respectively in AI were in the ratio 3 : 5 : 2, while in ML the ratio was 4 : 5 : 2. 7. The ratio of the total number of non-CS students failing in one of the two courses to the number of CS students failing in one of the two courses was 3 : 1. 8. 30 students failed in ML.
How many CS students failed in ML?
Q7CAT 2022 · Slot 3 · TITA✓ Answer verified
All the first-year students in the computer science (CS) department in a university take both the courses (i) AI and (ii) ML. Students from other departments (non-CS students) can also take one of these two courses, but not both. Students who fail in a course get an F grade; others pass and are awarded A or B or C grades depending on their performance. The following are some additional facts about the number of students who took these two courses this year and the grades they obtained. 1. The numbers of non-CS students who took AI and ML were in the ratio 2 : 5. 2. The number of non-CS students who took either AI or ML was equal to the number of CS students. 3. The numbers of non-CS students who failed in the two courses were the same and their total is equal to the number of CS students who got a C grade in ML. 4. In both the courses, 50% of the students who passed got a B grade. But, while the numbers of students who got A and C grades were the same for AI, they were in the ratio 3 : 2 for ML. 5. No CS student failed in AI, while no non-CS student got an A grade in AI. 6. The numbers of CS students who got A, B and C grades respectively in AI were in the ratio 3 : 5 : 2, while in ML the ratio was 4 : 5 : 2. 7. The ratio of the total number of non-CS students failing in one of the two courses to the number of CS students failing in one of the two courses was 3 : 1. 8. 30 students failed in ML.
How many non-CS students got A grade in ML?
Q8CAT 2022 · Slot 3✓ Answer verified
All the first-year students in the computer science (CS) department in a university take both the courses (i) AI and (ii) ML. Students from other departments (non-CS students) can also take one of these two courses, but not both. Students who fail in a course get an F grade; others pass and are awarded A or B or C grades depending on their performance. The following are some additional facts about the number of students who took these two courses this year and the grades they obtained. 1. The numbers of non-CS students who took AI and ML were in the ratio 2 : 5. 2. The number of non-CS students who took either AI or ML was equal to the number of CS students. 3. The numbers of non-CS students who failed in the two courses were the same and their total is equal to the number of CS students who got a C grade in ML. 4. In both the courses, 50% of the students who passed got a B grade. But, while the numbers of students who got A and C grades were the same for AI, they were in the ratio 3 : 2 for ML. 5. No CS student failed in AI, while no non-CS student got an A grade in AI. 6. The numbers of CS students who got A, B and C grades respectively in AI were in the ratio 3 : 5 : 2, while in ML the ratio was 4 : 5 : 2. 7. The ratio of the total number of non-CS students failing in one of the two courses to the number of CS students failing in one of the two courses was 3 : 1. 8. 30 students failed in ML.
How many students got A grade in AI?
Q9CAT 2022 · Slot 3✓ Answer verified
All the first-year students in the computer science (CS) department in a university take both the courses (i) AI and (ii) ML. Students from other departments (non-CS students) can also take one of these two courses, but not both. Students who fail in a course get an F grade; others pass and are awarded A or B or C grades depending on their performance. The following are some additional facts about the number of students who took these two courses this year and the grades they obtained. 1. The numbers of non-CS students who took AI and ML were in the ratio 2 : 5. 2. The number of non-CS students who took either AI or ML was equal to the number of CS students. 3. The numbers of non-CS students who failed in the two courses were the same and their total is equal to the number of CS students who got a C grade in ML. 4. In both the courses, 50% of the students who passed got a B grade. But, while the numbers of students who got A and C grades were the same for AI, they were in the ratio 3 : 2 for ML. 5. No CS student failed in AI, while no non-CS student got an A grade in AI. 6. The numbers of CS students who got A, B and C grades respectively in AI were in the ratio 3 : 5 : 2, while in ML the ratio was 4 : 5 : 2. 7. The ratio of the total number of non-CS students failing in one of the two courses to the number of CS students failing in one of the two courses was 3 : 1. 8. 30 students failed in ML.
How many non-CS students got B grade in ML?
Q10CAT 2022 · Slot 3✓ Answer verified
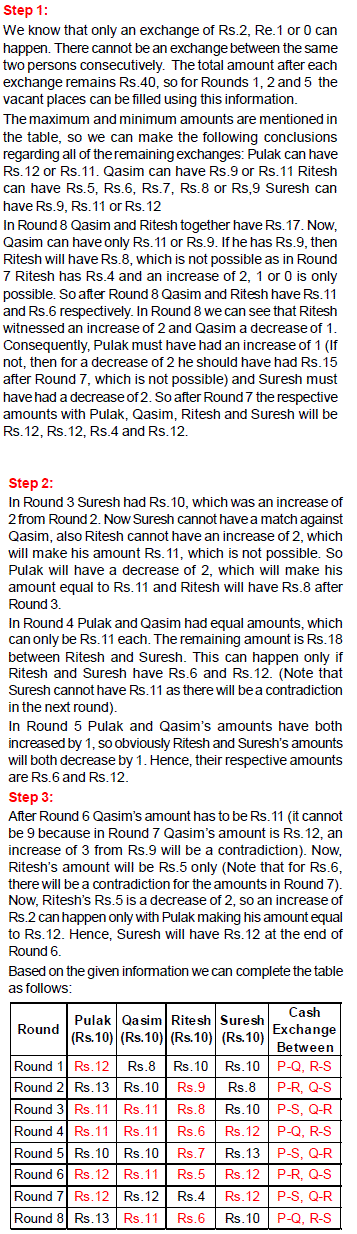
Pulak, Qasim, Ritesh, and Suresh participated in a tournament comprising of eight rounds. In each round, they formed two pairs, with each of them being in exactly one pair. The only restriction in the pairing was that the pairs would change in successive rounds. For example, if Pulak formed a pair with Qasim in the first round, then he would have to form a pair with Ritesh or Suresh in the second round. He would be free to pair with Qasim again in the third round. In each round, each pair decided whether to play the game in that round or not. If they decided not to play, then no money was exchanged between them. If they decided to play, they had to bet either Rs. 1 or Rs. 2 in that round. For example, if they chose to bet Rs. 2, then the player winning the game got Rs. 2 from the one losing the game. At the beginning of the tournament, the players had Rs. 10 each. The following table shows partial information about the amounts that the players had at the end of each of the eight rounds. It shows every time a player had Rs. 10 at the end of a round, as well as every time, at the end of a round, a player had either the minimum or the maximum amount that he would have had across the eight rounds. For example, Suresh had Rs.10 at the end of Rounds 1, 3, and 8 and not after any of the other rounds. The maximum amount that he had at the end of any round was Rs. 13 (at the end of Round 5), and the minimum amount he had at the end of any round was Rs. 8 (at the end of Round 2). At the end of all other rounds, he must have had either Rs. 9, Rs. 11, or Rs. 12. It was also known that Pulak and Qasim had the same amount of money with them at the end of Round 4.
What BEST can be said about the amount of money that Ritesh had with him at the end of Round 8?
Q11CAT 2022 · Slot 3✓ Answer verified
Pulak, Qasim, Ritesh, and Suresh participated in a tournament comprising of eight rounds. In each round, they formed two pairs, with each of them being in exactly one pair. The only restriction in the pairing was that the pairs would change in successive rounds. For example, if Pulak formed a pair with Qasim in the first round, then he would have to form a pair with Ritesh or Suresh in the second round. He would be free to pair with Qasim again in the third round. In each round, each pair decided whether to play the game in that round or not. If they decided not to play, then no money was exchanged between them. If they decided to play, they had to bet either Rs. 1 or Rs. 2 in that round. For example, if they chose to bet Rs. 2, then the player winning the game got Rs. 2 from the one losing the game. At the beginning of the tournament, the players had Rs. 10 each. The following table shows partial information about the amounts that the players had at the end of each of the eight rounds. It shows every time a player had Rs. 10 at the end of a round, as well as every time, at the end of a round, a player had either the minimum or the maximum amount that he would have had across the eight rounds. For example, Suresh had Rs.10 at the end of Rounds 1, 3, and 8 and not after any of the other rounds. The maximum amount that he had at the end of any round was Rs. 13 (at the end of Round 5), and the minimum amount he had at the end of any round was Rs. 8 (at the end of Round 2). At the end of all other rounds, he must have had either Rs. 9, Rs. 11, or Rs. 12. It was also known that Pulak and Qasim had the same amount of money with them at the end of Round 4.
What BEST can be said about the amount of money that Pulak had with him at the end of Round 6?
Q12CAT 2022 · Slot 3 · TITA✓ Answer verified
Pulak, Qasim, Ritesh, and Suresh participated in a tournament comprising of eight rounds. In each round, they formed two pairs, with each of them being in exactly one pair. The only restriction in the pairing was that the pairs would change in successive rounds. For example, if Pulak formed a pair with Qasim in the first round, then he would have to form a pair with Ritesh or Suresh in the second round. He would be free to pair with Qasim again in the third round. In each round, each pair decided whether to play the game in that round or not. If they decided not to play, then no money was exchanged between them. If they decided to play, they had to bet either Rs. 1 or Rs. 2 in that round. For example, if they chose to bet Rs. 2, then the player winning the game got Rs. 2 from the one losing the game. At the beginning of the tournament, the players had Rs. 10 each. The following table shows partial information about the amounts that the players had at the end of each of the eight rounds. It shows every time a player had Rs. 10 at the end of a round, as well as every time, at the end of a round, a player had either the minimum or the maximum amount that he would have had across the eight rounds. For example, Suresh had Rs.10 at the end of Rounds 1, 3, and 8 and not after any of the other rounds. The maximum amount that he had at the end of any round was Rs. 13 (at the end of Round 5), and the minimum amount he had at the end of any round was Rs. 8 (at the end of Round 2). At the end of all other rounds, he must have had either Rs. 9, Rs. 11, or Rs. 12. It was also known that Pulak and Qasim had the same amount of money with them at the end of Round 4.
How much money (in ₹) did Ritesh have at the end of Round 4?
Q13CAT 2022 · Slot 3 · TITA✓ Answer verified
Pulak, Qasim, Ritesh, and Suresh participated in a tournament comprising of eight rounds. In each round, they formed two pairs, with each of them being in exactly one pair. The only restriction in the pairing was that the pairs would change in successive rounds. For example, if Pulak formed a pair with Qasim in the first round, then he would have to form a pair with Ritesh or Suresh in the second round. He would be free to pair with Qasim again in the third round. In each round, each pair decided whether to play the game in that round or not. If they decided not to play, then no money was exchanged between them. If they decided to play, they had to bet either Rs. 1 or Rs. 2 in that round. For example, if they chose to bet Rs. 2, then the player winning the game got Rs. 2 from the one losing the game. At the beginning of the tournament, the players had Rs. 10 each. The following table shows partial information about the amounts that the players had at the end of each of the eight rounds. It shows every time a player had Rs. 10 at the end of a round, as well as every time, at the end of a round, a player had either the minimum or the maximum amount that he would have had across the eight rounds. For example, Suresh had Rs.10 at the end of Rounds 1, 3, and 8 and not after any of the other rounds. The maximum amount that he had at the end of any round was Rs. 13 (at the end of Round 5), and the minimum amount he had at the end of any round was Rs. 8 (at the end of Round 2). At the end of all other rounds, he must have had either Rs. 9, Rs. 11, or Rs. 12. It was also known that Pulak and Qasim had the same amount of money with them at the end of Round 4.
How many games were played with a bet of ₹2?
Q14CAT 2022 · Slot 3✓ Answer verified
Pulak, Qasim, Ritesh, and Suresh participated in a tournament comprising of eight rounds. In each round, they formed two pairs, with each of them being in exactly one pair. The only restriction in the pairing was that the pairs would change in successive rounds. For example, if Pulak formed a pair with Qasim in the first round, then he would have to form a pair with Ritesh or Suresh in the second round. He would be free to pair with Qasim again in the third round. In each round, each pair decided whether to play the game in that round or not. If they decided not to play, then no money was exchanged between them. If they decided to play, they had to bet either Rs. 1 or Rs. 2 in that round. For example, if they chose to bet Rs. 2, then the player winning the game got Rs. 2 from the one losing the game. At the beginning of the tournament, the players had Rs. 10 each. The following table shows partial information about the amounts that the players had at the end of each of the eight rounds. It shows every time a player had Rs. 10 at the end of a round, as well as every time, at the end of a round, a player had either the minimum or the maximum amount that he would have had across the eight rounds. For example, Suresh had Rs.10 at the end of Rounds 1, 3, and 8 and not after any of the other rounds. The maximum amount that he had at the end of any round was Rs. 13 (at the end of Round 5), and the minimum amount he had at the end of any round was Rs. 8 (at the end of Round 2). At the end of all other rounds, he must have had either Rs. 9, Rs. 11, or Rs. 12. It was also known that Pulak and Qasim had the same amount of money with them at the end of Round 4.
Which of the following pairings was made in Round 5?
Q15CAT 2022 · Slot 3✓ Answer verified
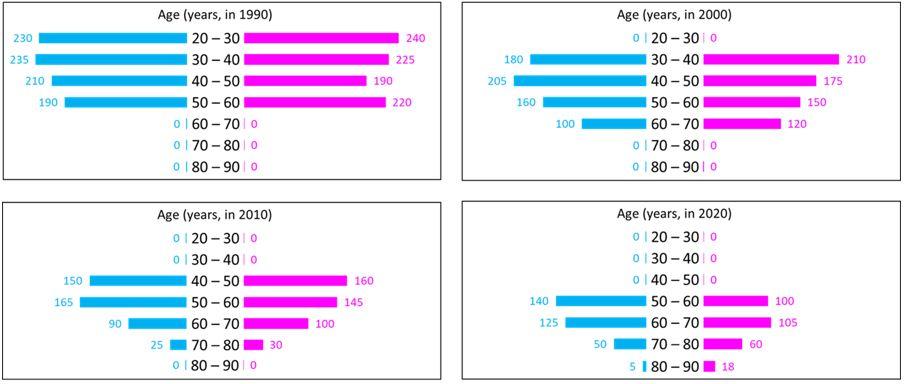
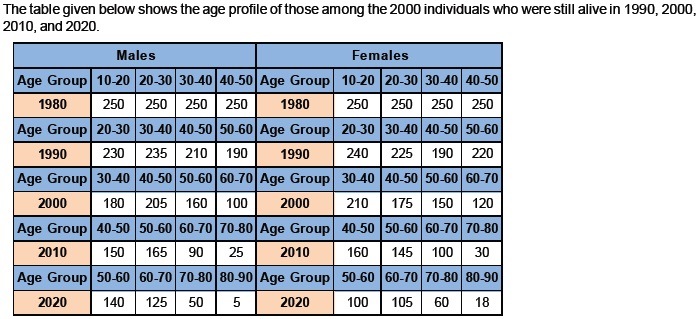
In the following, a year corresponds to 1st of January of that year. A study to determine the mortality rate for a disease began in 1980. The study chose 1000 males and 1000 females and followed them for forty years or until they died, whichever came first. The 1000 males chosen in 1980 consisted of 250 each of ages 10 to less than 20, 20 to less than 30, 30 to less than 40, and 40 to less than 50. The 1000 females chosen in 1980 also consisted of 250 each of ages 10 to less than 20, 20 to less than 30, 30 to less than 40, and 40 to less than 50. The four figures below depict the age profile of those among the 2000 individuals who were still alive in 1990, 2000, 2010, and 2020. The blue bars in each figure represent the number of males in each age group at that point in time, while the pink bars represent the number of females in each age group at that point in time. The numbers next to the bars give the exact numbers being represented by the bars. For example, we know that 230 males among those tracked and who were alive in 1990 were aged between 20 and 30.
How many individuals who were being tracked and who were less than 30 years of age in 1980 survived until 2020?
Q16CAT 2022 · Slot 3 · TITA✓ Answer verified
In the following, a year corresponds to 1st of January of that year. A study to determine the mortality rate for a disease began in 1980. The study chose 1000 males and 1000 females and followed them for forty years or until they died, whichever came first. The 1000 males chosen in 1980 consisted of 250 each of ages 10 to less than 20, 20 to less than 30, 30 to less than 40, and 40 to less than 50. The 1000 females chosen in 1980 also consisted of 250 each of ages 10 to less than 20, 20 to less than 30, 30 to less than 40, and 40 to less than 50. The four figures below depict the age profile of those among the 2000 individuals who were still alive in 1990, 2000, 2010, and 2020. The blue bars in each figure represent the number of males in each age group at that point in time, while the pink bars represent the number of females in each age group at that point in time. The numbers next to the bars give the exact numbers being represented by the bars. For example, we know that 230 males among those tracked and who were alive in 1990 were aged between 20 and 30.
How many of the males who were being tracked and who were between 20 and 30 years of age in 1980 died in the period 2000 to 2010?
Q17CAT 2022 · Slot 3 · TITA✓ Answer verified
In the following, a year corresponds to 1st of January of that year. A study to determine the mortality rate for a disease began in 1980. The study chose 1000 males and 1000 females and followed them for forty years or until they died, whichever came first. The 1000 males chosen in 1980 consisted of 250 each of ages 10 to less than 20, 20 to less than 30, 30 to less than 40, and 40 to less than 50. The 1000 females chosen in 1980 also consisted of 250 each of ages 10 to less than 20, 20 to less than 30, 30 to less than 40, and 40 to less than 50. The four figures below depict the age profile of those among the 2000 individuals who were still alive in 1990, 2000, 2010, and 2020. The blue bars in each figure represent the number of males in each age group at that point in time, while the pink bars represent the number of females in each age group at that point in time. The numbers next to the bars give the exact numbers being represented by the bars. For example, we know that 230 males among those tracked and who were alive in 1990 were aged between 20 and 30.
How many of the females who were being tracked and who were between 20 and 30 years of age in 1980 died between the ages of 50 and 60?
Q18CAT 2022 · Slot 3✓ Answer verified
In the following, a year corresponds to 1st of January of that year. A study to determine the mortality rate for a disease began in 1980. The study chose 1000 males and 1000 females and followed them for forty years or until they died, whichever came first. The 1000 males chosen in 1980 consisted of 250 each of ages 10 to less than 20, 20 to less than 30, 30 to less than 40, and 40 to less than 50. The 1000 females chosen in 1980 also consisted of 250 each of ages 10 to less than 20, 20 to less than 30, 30 to less than 40, and 40 to less than 50. The four figures below depict the age profile of those among the 2000 individuals who were still alive in 1990, 2000, 2010, and 2020. The blue bars in each figure represent the number of males in each age group at that point in time, while the pink bars represent the number of females in each age group at that point in time. The numbers next to the bars give the exact numbers being represented by the bars. For example, we know that 230 males among those tracked and who were alive in 1990 were aged between 20 and 30.
In 2000, what was the ratio of the number of dead males to dead females among those being tracked?
Q19CAT 2022 · Slot 3✓ Answer verified
In the following, a year corresponds to 1st of January of that year. A study to determine the mortality rate for a disease began in 1980. The study chose 1000 males and 1000 females and followed them for forty years or until they died, whichever came first. The 1000 males chosen in 1980 consisted of 250 each of ages 10 to less than 20, 20 to less than 30, 30 to less than 40, and 40 to less than 50. The 1000 females chosen in 1980 also consisted of 250 each of ages 10 to less than 20, 20 to less than 30, 30 to less than 40, and 40 to less than 50. The four figures below depict the age profile of those among the 2000 individuals who were still alive in 1990, 2000, 2010, and 2020. The blue bars in each figure represent the number of males in each age group at that point in time, while the pink bars represent the number of females in each age group at that point in time. The numbers next to the bars give the exact numbers being represented by the bars. For example, we know that 230 males among those tracked and who were alive in 1990 were aged between 20 and 30.
How many people who were being tracked and who were between 30 and 40 years of age in 1980 survived until 2010?
Q20CAT 2022 · Slot 3✓ Answer verified
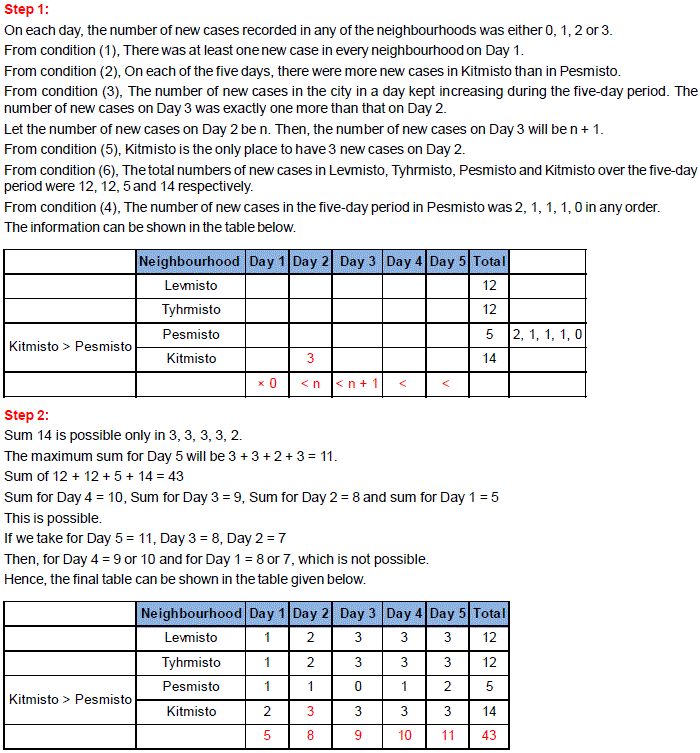
There are only four neighbourhoods in a city − Levmisto, Tyhrmisto, Pesmisto and Kitmisto. During the onset of a pandemic, the number of new cases of a disease in each of these neighbourhoods was recorded over a period of five days. On each day, the number of new cases recorded in any of the neighbourhoods was either 0, 1, 2 or 3. The following facts are also known: 1. There was at least one new case in every neighbourhood on Day 1. 2. On each of the five days, there were more new cases in Kitmisto than in Pesmisto. 3. The number of new cases in the city in a day kept increasing during the five-day period. The number of new cases on Day 3 was exactly one more than that on Day 2. 4. The maximum number of new cases in a day in Pesmisto was 2, and this happened only once during the five-day period. 5. Kitmisto is the only place to have 3 new cases on Day 2. 6. The total numbers of new cases in Levmisto, Tyhrmisto, Pesmisto and Kitmisto over the five-day period were 12, 12, 5 and 14 respectively.
What BEST can be concluded about the total number of new cases in the city on Day 2?
Q21CAT 2022 · Slot 3✓ Answer verified
There are only four neighbourhoods in a city − Levmisto, Tyhrmisto, Pesmisto and Kitmisto. During the onset of a pandemic, the number of new cases of a disease in each of these neighbourhoods was recorded over a period of five days. On each day, the number of new cases recorded in any of the neighbourhoods was either 0, 1, 2 or 3. The following facts are also known: 1. There was at least one new case in every neighbourhood on Day 1. 2. On each of the five days, there were more new cases in Kitmisto than in Pesmisto. 3. The number of new cases in the city in a day kept increasing during the five-day period. The number of new cases on Day 3 was exactly one more than that on Day 2. 4. The maximum number of new cases in a day in Pesmisto was 2, and this happened only once during the five-day period. 5. Kitmisto is the only place to have 3 new cases on Day 2. 6. The total numbers of new cases in Levmisto, Tyhrmisto, Pesmisto and Kitmisto over the five-day period were 12, 12, 5 and 14 respectively.
What BEST can be concluded about the number of new cases in Levmisto on Day 3?
Q22CAT 2022 · Slot 3✓ Answer verified
There are only four neighbourhoods in a city − Levmisto, Tyhrmisto, Pesmisto and Kitmisto. During the onset of a pandemic, the number of new cases of a disease in each of these neighbourhoods was recorded over a period of five days. On each day, the number of new cases recorded in any of the neighbourhoods was either 0, 1, 2 or 3. The following facts are also known: 1. There was at least one new case in every neighbourhood on Day 1. 2. On each of the five days, there were more new cases in Kitmisto than in Pesmisto. 3. The number of new cases in the city in a day kept increasing during the five-day period. The number of new cases on Day 3 was exactly one more than that on Day 2. 4. The maximum number of new cases in a day in Pesmisto was 2, and this happened only once during the five-day period. 5. Kitmisto is the only place to have 3 new cases on Day 2. 6. The total numbers of new cases in Levmisto, Tyhrmisto, Pesmisto and Kitmisto over the five-day period were 12, 12, 5 and 14 respectively.
On which day(s) did Pesmisto not have any new case?
Q23CAT 2022 · Slot 3✓ Answer verified
There are only four neighbourhoods in a city − Levmisto, Tyhrmisto, Pesmisto and Kitmisto. During the onset of a pandemic, the number of new cases of a disease in each of these neighbourhoods was recorded over a period of five days. On each day, the number of new cases recorded in any of the neighbourhoods was either 0, 1, 2 or 3. The following facts are also known: 1. There was at least one new case in every neighbourhood on Day 1. 2. On each of the five days, there were more new cases in Kitmisto than in Pesmisto. 3. The number of new cases in the city in a day kept increasing during the five-day period. The number of new cases on Day 3 was exactly one more than that on Day 2. 4. The maximum number of new cases in a day in Pesmisto was 2, and this happened only once during the five-day period. 5. Kitmisto is the only place to have 3 new cases on Day 2. 6. The total numbers of new cases in Levmisto, Tyhrmisto, Pesmisto and Kitmisto over the five-day period were 12, 12, 5 and 14 respectively.
Which of the two statements below is/are necessarily false? Statement A: There were 2 new cases in Tyhrmisto on Day 3. Statement B: There were no new cases in Pesmisto on Day 2.
Q24CAT 2022 · Slot 3✓ Answer verified
There are only four neighbourhoods in a city − Levmisto, Tyhrmisto, Pesmisto and Kitmisto. During the onset of a pandemic, the number of new cases of a disease in each of these neighbourhoods was recorded over a period of five days. On each day, the number of new cases recorded in any of the neighbourhoods was either 0, 1, 2 or 3. The following facts are also known: 1. There was at least one new case in every neighbourhood on Day 1. 2. On each of the five days, there were more new cases in Kitmisto than in Pesmisto. 3. The number of new cases in the city in a day kept increasing during the five-day period. The number of new cases on Day 3 was exactly one more than that on Day 2. 4. The maximum number of new cases in a day in Pesmisto was 2, and this happened only once during the five-day period. 5. Kitmisto is the only place to have 3 new cases on Day 2. 6. The total numbers of new cases in Levmisto, Tyhrmisto, Pesmisto and Kitmisto over the five-day period were 12, 12, 5 and 14 respectively.
On how many days did Levmisto and Tyhrmisto have the same number of new cases?
Q25CAT 2020✓ Answer verified
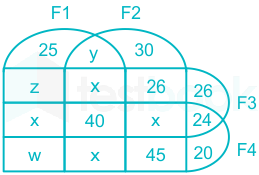
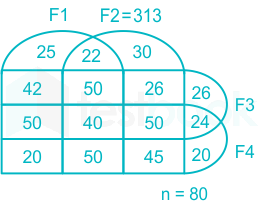
A survey of 600 schools in India was conducted to gather information about their online teaching learning processes (OTLP). The following four facilities were studied. F1: Own software for OTLP F2: Trained teachers for OTLP F3: Training materials for OTLP F4: All students having Laptops The following observations were summarized from the survey. 1. 80 schools did not have any of the four facilities – F1, F2, F3, F4. 2. 40 schools had all four facilities. 3. The number of schools with only F1, only F2, only F3, and only F4 was 25, 30, 26 and 20 respectively. 4. The number of schools with exactly three of the facilities was the same irrespective of which three were considered. 5. 313 schools had F2. 6. 26 schools had only F2 and F3 (but neither F1 nor F4). 7. Among the schools having F4, 24 had only F3, and 45 had only F2. 8. 162 schools had both F1 and F2. 9. The number of schools having F1 was the same as the number of schools having F4.
Q.1 What was the total number of schools having exactly three of the four facilities?
Q26CAT 2020✓ Answer verified
A survey of 600 schools in India was conducted to gather information about their online teaching learning processes (OTLP). The following four facilities were studied. F1: Own software for OTLP F2: Trained teachers for OTLP F3: Training materials for OTLP F4: All students having Laptops The following observations were summarized from the survey. 1. 80 schools did not have any of the four facilities – F1, F2, F3, F4. 2. 40 schools had all four facilities. 3. The number of schools with only F1, only F2, only F3, and only F4 was 25, 30, 26 and 20 respectively. 4. The number of schools with exactly three of the facilities was the same irrespective of which three were considered. 5. 313 schools had F2. 6. 26 schools had only F2 and F3 (but neither F1 nor F4). 7. Among the schools having F4, 24 had only F3, and 45 had only F2. 8. 162 schools had both F1 and F2. 9. The number of schools having F1 was the same as the number of schools having F4.
Q.2 What was the number of schools having facilities F2 and F4?
Q27CAT 2020 · TITA✓ Answer verified
A survey of 600 schools in India was conducted to gather information about their online teaching learning processes (OTLP). The following four facilities were studied. F1: Own software for OTLP F2: Trained teachers for OTLP F3: Training materials for OTLP F4: All students having Laptops The following observations were summarized from the survey. 1. 80 schools did not have any of the four facilities – F1, F2, F3, F4. 2. 40 schools had all four facilities. 3. The number of schools with only F1, only F2, only F3, and only F4 was 25, 30, 26 and 20 respectively. 4. The number of schools with exactly three of the facilities was the same irrespective of which three were considered. 5. 313 schools had F2. 6. 26 schools had only F2 and F3 (but neither F1 nor F4). 7. Among the schools having F4, 24 had only F3, and 45 had only F2. 8. 162 schools had both F1 and F2. 9. The number of schools having F1 was the same as the number of schools having F4.
Q.3 What was the number of schools having only facilities F1 and F3?
Q28CAT 2020 · TITA✓ Answer verified
A survey of 600 schools in India was conducted to gather information about their online teaching learning processes (OTLP). The following four facilities were studied. F1: Own software for OTLP F2: Trained teachers for OTLP F3: Training materials for OTLP F4: All students having Laptops The following observations were summarized from the survey. 1. 80 schools did not have any of the four facilities – F1, F2, F3, F4. 2. 40 schools had all four facilities. 3. The number of schools with only F1, only F2, only F3, and only F4 was 25, 30, 26 and 20 respectively. 4. The number of schools with exactly three of the facilities was the same irrespective of which three were considered. 5. 313 schools had F2. 6. 26 schools had only F2 and F3 (but neither F1 nor F4). 7. Among the schools having F4, 24 had only F3, and 45 had only F2. 8. 162 schools had both F1 and F2. 9. The number of schools having F1 was the same as the number of schools having F4.
Q.4 What was the number of schools having only facilities F1 and F4?
Q29CAT 2019 · Slot 2 · TITA
Set 3 : Students & Proposals
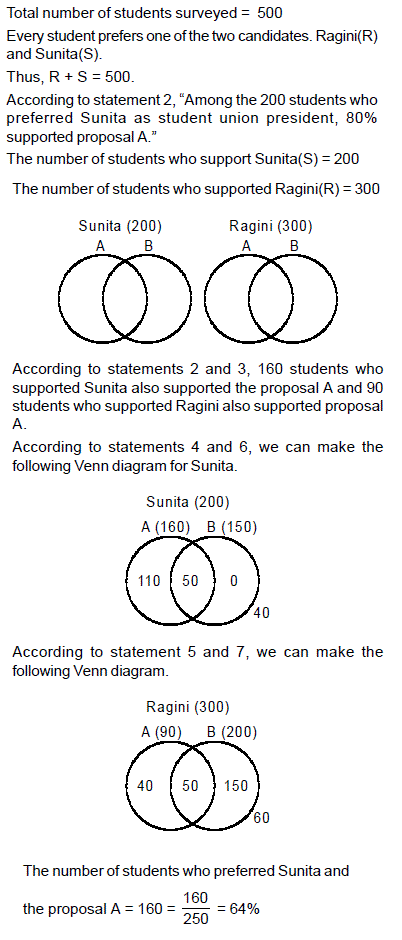
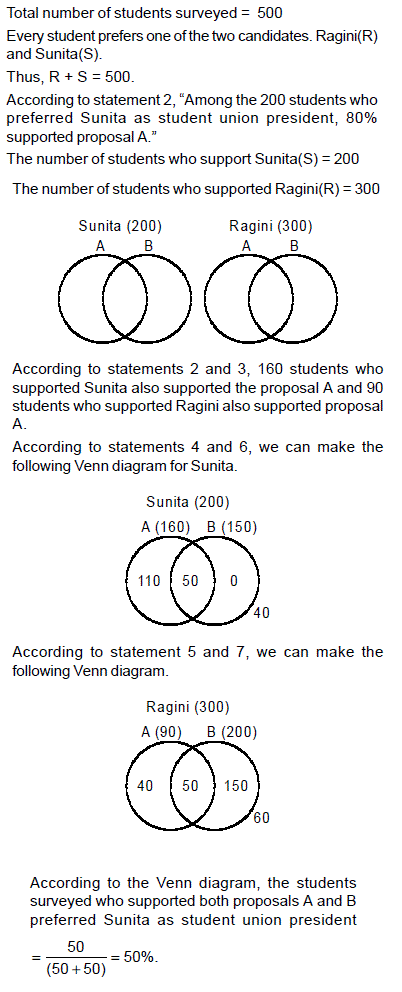
Students in a college are discussing two proposals -- A: a proposal by the authorities to introduce dress code on campus, and B: a proposal by the students to allow multinational food franchises to set up outlets on college campus. A student does not necessarily support either of the two proposals. In an upcoming election for student union president, there are two candidates in fray: Sunita and Ragini. Every student prefers one of the two candidates. A survey was conducted among the students by picking a sample of 500 students. The following information was noted from this survey. 1) 250 students supported proposal A and 250 students supported proposal B. 2) Among the 200 students who preferred Sunita as student union president, 80% supported proposal A. 3) Among those who preferred Ragini, 30% supported proposal A. 4) 20% of those who supported proposal B preferred Sunita. 5) 40% of those who did not support proposal B preferred Ragini. 6) Every student who preferred Sunita and supported proposal B also supported proposal A. 7) Among those who preferred Ragini, 20% did not support any of the proposals.
Among the students surveyed who supported proposal A, what percentage preferred Sunita for student union president? [TITA]
Q30CAT 2019 · Slot 2 · TITA
Set 3 : Students & Proposals
Students in a college are discussing two proposals -- A: a proposal by the authorities to introduce dress code on campus, and B: a proposal by the students to allow multinational food franchises to set up outlets on college campus. A student does not necessarily support either of the two proposals. In an upcoming election for student union president, there are two candidates in fray: Sunita and Ragini. Every student prefers one of the two candidates. A survey was conducted among the students by picking a sample of 500 students. The following information was noted from this survey. 1) 250 students supported proposal A and 250 students supported proposal B. 2) Among the 200 students who preferred Sunita as student union president, 80% supported proposal A. 3) Among those who preferred Ragini, 30% supported proposal A. 4) 20% of those who supported proposal B preferred Sunita. 5) 40% of those who did not support proposal B preferred Ragini. 6) Every student who preferred Sunita and supported proposal B also supported proposal A. 7) Among those who preferred Ragini, 20% did not support any of the proposals.
What percentage of the students surveyed who did not support proposal A preferred Ragini as student union president? [TITA]
Q31CAT 2019 · Slot 2✓ Answer verified
Set 3 : Students & Proposals
Students in a college are discussing two proposals -- A: a proposal by the authorities to introduce dress code on campus, and B: a proposal by the students to allow multinational food franchises to set up outlets on college campus. A student does not necessarily support either of the two proposals. In an upcoming election for student union president, there are two candidates in fray: Sunita and Ragini. Every student prefers one of the two candidates. A survey was conducted among the students by picking a sample of 500 students. The following information was noted from this survey. 1) 250 students supported proposal A and 250 students supported proposal B. 2) Among the 200 students who preferred Sunita as student union president, 80% supported proposal A. 3) Among those who preferred Ragini, 30% supported proposal A. 4) 20% of those who supported proposal B preferred Sunita. 5) 40% of those who did not support proposal B preferred Ragini. 6) Every student who preferred Sunita and supported proposal B also supported proposal A. 7) Among those who preferred Ragini, 20% did not support any of the proposals.
percentage of the students surveyed who supported both proposals A and B preferred Sunita as student union president?
Q32CAT 2019 · Slot 2✓ Answer verified
Set 3 : Students & Proposals
Students in a college are discussing two proposals -- A: a proposal by the authorities to introduce dress code on campus, and B: a proposal by the students to allow multinational food franchises to set up outlets on college campus. A student does not necessarily support either of the two proposals. In an upcoming election for student union president, there are two candidates in fray: Sunita and Ragini. Every student prefers one of the two candidates. A survey was conducted among the students by picking a sample of 500 students. The following information was noted from this survey. 1) 250 students supported proposal A and 250 students supported proposal B. 2) Among the 200 students who preferred Sunita as student union president, 80% supported proposal A. 3) Among those who preferred Ragini, 30% supported proposal A. 4) 20% of those who supported proposal B preferred Sunita. 5) 40% of those who did not support proposal B preferred Ragini. 6) Every student who preferred Sunita and supported proposal B also supported proposal A. 7) Among those who preferred Ragini, 20% did not support any of the proposals.
How many of the students surveyed supported proposal B, did not support proposal A and preferred Ragini as student union president?
Q33CAT 2019 · TITA✓ Answer verified
Proposals
Students in a college are discussing two proposals -- A: a proposal by the authorities to introduce dress code on campus, and B: a proposal by the students to allow multinational food franchises to set up outlets on college campus. A student does not necessarily support either of the two proposals. In an upcoming election for student union president, there are two candidates in fray: Sunita and Ragini. Every student prefers one of the two candidates. A survey was conducted among the students by picking a sample of 500 students. The following information was noted from this survey. 1. 250 students supported proposal A and 250 students supported proposal B. 2. Among the 200 students who preferred Sunita as student union president, 80% supported proposal A. 3. Among those who preferred Ragini, 30% supported proposal A. 4. 20% of those who supported proposal B preferred Sunita. 5. 40% of those who did not support proposal B preferred Ragini. 6. Every student who preferred Sunita and supported proposal B also supported proposal A. 7. Among those who preferred Ragini, 20% did not support any of the proposals.
Among the students surveyed who supported proposal A, what percentage preferred Sunita for student union president?
Q34CAT 2019 · TITA✓ Answer verified
Proposals
Students in a college are discussing two proposals -- A: a proposal by the authorities to introduce dress code on campus, and B: a proposal by the students to allow multinational food franchises to set up outlets on college campus. A student does not necessarily support either of the two proposals. In an upcoming election for student union president, there are two candidates in fray: Sunita and Ragini. Every student prefers one of the two candidates. A survey was conducted among the students by picking a sample of 500 students. The following information was noted from this survey. 1. 250 students supported proposal A and 250 students supported proposal B. 2. Among the 200 students who preferred Sunita as student union president, 80% supported proposal A. 3. Among those who preferred Ragini, 30% supported proposal A. 4. 20% of those who supported proposal B preferred Sunita. 5. 40% of those who did not support proposal B preferred Ragini. 6. Every student who preferred Sunita and supported proposal B also supported proposal A. 7. Among those who preferred Ragini, 20% did not support any of the proposals.
What percentage of the students surveyed who did not support proposal A preferred Ragini as student union president?
Q35CAT 2019✓ Answer verified
Proposals
Students in a college are discussing two proposals -- A: a proposal by the authorities to introduce dress code on campus, and B: a proposal by the students to allow multinational food franchises to set up outlets on college campus. A student does not necessarily support either of the two proposals. In an upcoming election for student union president, there are two candidates in fray: Sunita and Ragini. Every student prefers one of the two candidates. A survey was conducted among the students by picking a sample of 500 students. The following information was noted from this survey. 1. 250 students supported proposal A and 250 students supported proposal B. 2. Among the 200 students who preferred Sunita as student union president, 80% supported proposal A. 3. Among those who preferred Ragini, 30% supported proposal A. 4. 20% of those who supported proposal B preferred Sunita. 5. 40% of those who did not support proposal B preferred Ragini. 6. Every student who preferred Sunita and supported proposal B also supported proposal A. 7. Among those who preferred Ragini, 20% did not support any of the proposals.
What percentage of the students surveyed who supported both proposals A and B preferred Sunita as student union president?
Q36CAT 2019✓ Answer verified
Proposals
Students in a college are discussing two proposals -- A: a proposal by the authorities to introduce dress code on campus, and B: a proposal by the students to allow multinational food franchises to set up outlets on college campus. A student does not necessarily support either of the two proposals. In an upcoming election for student union president, there are two candidates in fray: Sunita and Ragini. Every student prefers one of the two candidates. A survey was conducted among the students by picking a sample of 500 students. The following information was noted from this survey. 1. 250 students supported proposal A and 250 students supported proposal B. 2. Among the 200 students who preferred Sunita as student union president, 80% supported proposal A. 3. Among those who preferred Ragini, 30% supported proposal A. 4. 20% of those who supported proposal B preferred Sunita. 5. 40% of those who did not support proposal B preferred Ragini. 6. Every student who preferred Sunita and supported proposal B also supported proposal A. 7. Among those who preferred Ragini, 20% did not support any of the proposals.
How many of the students surveyed supported proposal B, did not support proposal A and preferred Ragini as student union president?
Q37CAT 2018 · Slot 2 · TITA✓ Answer verified
Set 3 : Fun Sports Club
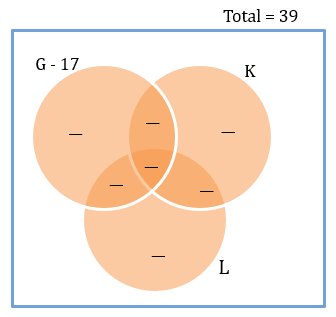
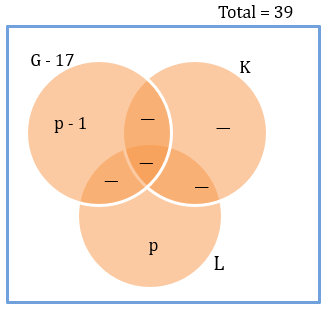
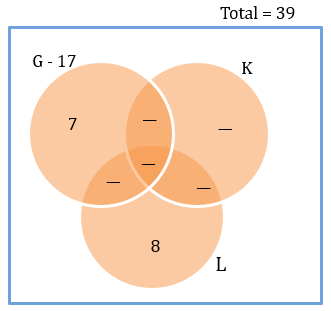
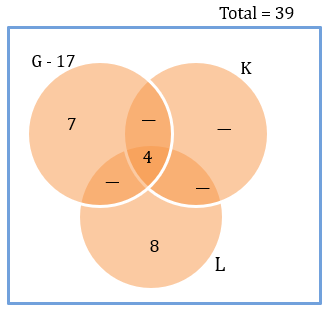
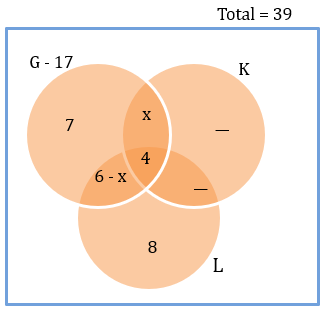
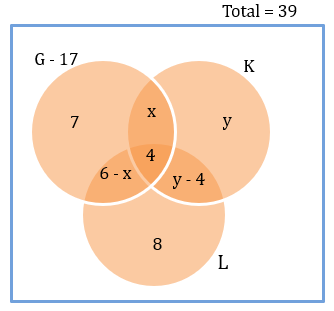
Fun Sports (FS) provides training in three sports − Gilli-danda (G), Kho-Kho (K), and Ludo (L). Currently it has an enrollment of 39 students each of whom is enrolled in at least one of the three sports. The following details are known: 1. The number of students enrolled only in L is double the number of students enrolled in all the three sports. 2. There are a total of 17 students enrolled in G. 3. The number of students enrolled only in G is one less than the number of students enrolled only in L. 4. The number of students enrolled only in K is equal to the number of students who are enrolled in both K and L. 5. The maximum student enrollment is in L. 6. Ten students enrolled in G are also enrolled in at least one more sport.
What is the minimum number of students enrolled in both G and L but not in K? [TITA]
Q38CAT 2018 · Slot 2✓ Answer verified
Set 3 : Fun Sports Club
Fun Sports (FS) provides training in three sports − Gilli-danda (G), Kho-Kho (K), and Ludo (L). Currently it has an enrollment of 39 students each of whom is enrolled in at least one of the three sports. The following details are known: 1. The number of students enrolled only in L is double the number of students enrolled in all the three sports. 2. There are a total of 17 students enrolled in G. 3. The number of students enrolled only in G is one less than the number of students enrolled only in L. 4. The number of students enrolled only in K is equal to the number of students who are enrolled in both K and L. 5. The maximum student enrollment is in L. 6. Ten students enrolled in G are also enrolled in at least one more sport.
If the numbers of students enrolled in K and L are in the ratio 19:22, then what is the number of students enrolled in L?
Q39CAT 2018 · Slot 2 · TITA✓ Answer verified
Set 3 : Fun Sports Club
Fun Sports (FS) provides training in three sports − Gilli-danda (G), Kho-Kho (K), and Ludo (L). Currently it has an enrollment of 39 students each of whom is enrolled in at least one of the three sports. The following details are known: 1. The number of students enrolled only in L is double the number of students enrolled in all the three sports. 2. There are a total of 17 students enrolled in G. 3. The number of students enrolled only in G is one less than the number of students enrolled only in L. 4. The number of students enrolled only in K is equal to the number of students who are enrolled in both K and L. 5. The maximum student enrollment is in L. 6. Ten students enrolled in G are also enrolled in at least one more sport.
Due to academic pressure, students who were enrolled in all three sports were asked to withdraw from one of the three sports. After the withdrawal, the number of students enrolled in G was six less than the number of students enrolled in L, while the number of students enrolled in K went down by one.After the withdrawal, how many students were enrolled in both G and K? [TITA]
Q40CAT 2018 · Slot 1✓ Answer verified
Set 2 : Satellites
1600 satellites were sent up by a country for several purposes. The purposes are classified as broadcasting (B), communication (C), surveillance (S), and others (O). A satellite can serve multiple purposes; however a satellite serving either B, or C, or S does not serve O. The following facts are known about the satellites: 1.The numbers of satellites serving B, C, and S (though may be not exclusively) are in the ratio 2:1:1. 2.The number of satellites serving all three of B, C, and S is 100. 3.The number of satellites exclusively serving C is the same as the number of satellites exclusively serving S. This number is 30% of the number of satellites exclusively serving B. 4.The number of satellites serving O is the same as the number of satellites serving both C and S but not B.
What best can be said about the number of satellites serving C?
Q41CAT 2018 · Slot 1✓ Answer verified
Set 2 : Satellites
1600 satellites were sent up by a country for several purposes. The purposes are classified as broadcasting (B), communication (C), surveillance (S), and others (O). A satellite can serve multiple purposes; however a satellite serving either B, or C, or S does not serve O. The following facts are known about the satellites: 1.The numbers of satellites serving B, C, and S (though may be not exclusively) are in the ratio 2:1:1. 2.The number of satellites serving all three of B, C, and S is 100. 3.The number of satellites exclusively serving C is the same as the number of satellites exclusively serving S. This number is 30% of the number of satellites exclusively serving B. 4.The number of satellites serving O is the same as the number of satellites serving both C and S but not B.
What is the minimum possible number of satellites serving B exclusively?
Q42CAT 2018 · Slot 1✓ Answer verified
Set 2 : Satellites
1600 satellites were sent up by a country for several purposes. The purposes are classified as broadcasting (B), communication (C), surveillance (S), and others (O). A satellite can serve multiple purposes; however a satellite serving either B, or C, or S does not serve O. The following facts are known about the satellites: 1.The numbers of satellites serving B, C, and S (though may be not exclusively) are in the ratio 2:1:1. 2.The number of satellites serving all three of B, C, and S is 100. 3.The number of satellites exclusively serving C is the same as the number of satellites exclusively serving S. This number is 30% of the number of satellites exclusively serving B. 4.The number of satellites serving O is the same as the number of satellites serving both C and S but not B.
If at least 100 of the 1600 satellites were serving O, what can be said about the number of satellites serving S?
Q43CAT 2018 · Slot 1✓ Answer verified
Set 2 : Satellites
1600 satellites were sent up by a country for several purposes. The purposes are classified as broadcasting (B), communication (C), surveillance (S), and others (O). A satellite can serve multiple purposes; however a satellite serving either B, or C, or S does not serve O. The following facts are known about the satellites: 1.The numbers of satellites serving B, C, and S (though may be not exclusively) are in the ratio 2:1:1. 2.The number of satellites serving all three of B, C, and S is 100. 3.The number of satellites exclusively serving C is the same as the number of satellites exclusively serving S. This number is 30% of the number of satellites exclusively serving B. 4.The number of satellites serving O is the same as the number of satellites serving both C and S but not B.
If the number of satellites serving at least two among B, C, and S is 1200, which of the following MUST be FALSE?
Q44CAT 2018 · Slot 1✓ Answer verified
Set 8 : Committees
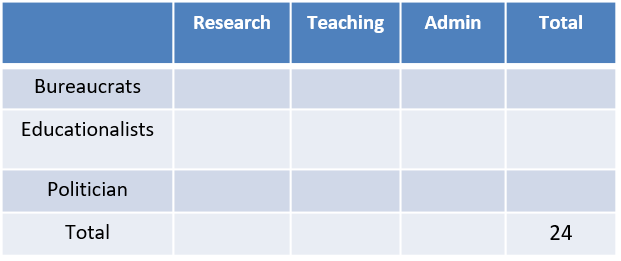
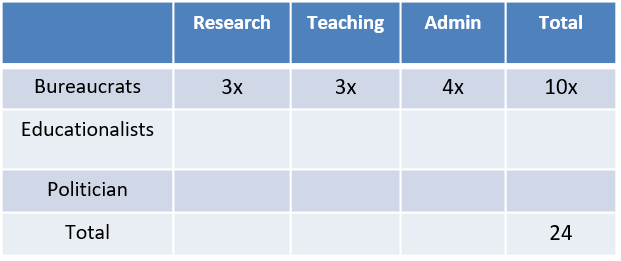
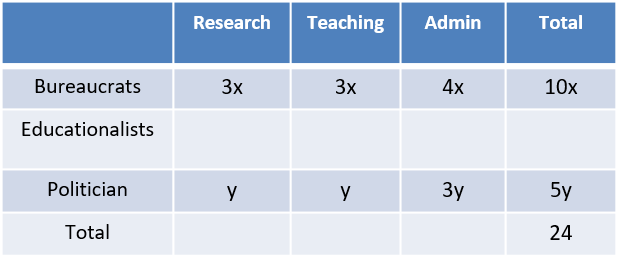
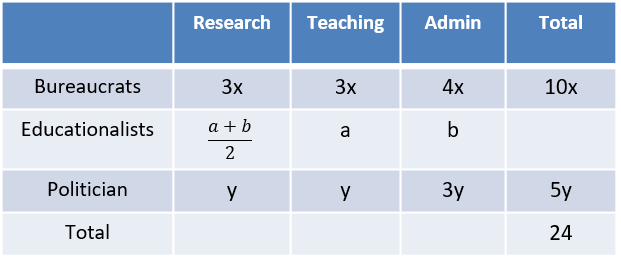
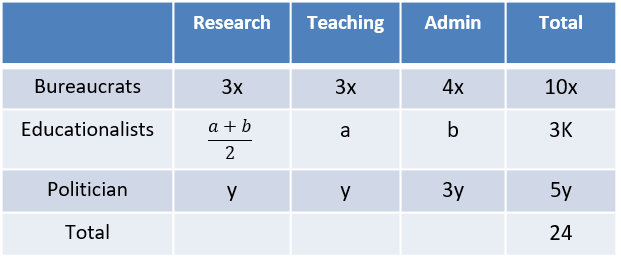
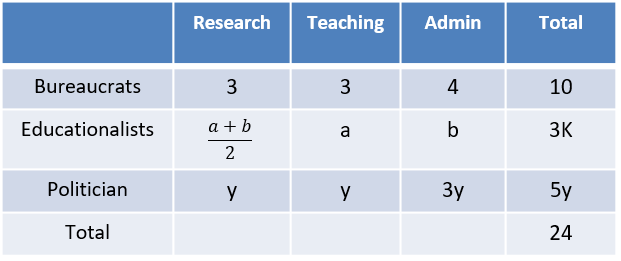
Twenty four people are part of three committees which are to look at research, teaching, and administration respectively. No two committees have any member in common. No two committees are of the same size. Each committee has three types of people: bureaucrats, educationalists, and politicians, with at least one from each of the three types in each committee. The following facts are also known about the committees: 1. The numbers of bureaucrats in the research and teaching committees are equal, while the number of bureaucrats in the research committee is 75% of the number of bureaucrats in the administration committee. 2. The number of educationalists in the teaching committee is less than the number of educationalists in the research committee. The number of educationalists in the research committee is the average of the numbers of educationalists in the other two committees. 3. 60% of the politicians are in the administration committee, and 20% are in the teaching committee.
Based on the given information, which of the following statements MUST be FALSE?
Q45CAT 2018 · Slot 1 · TITA✓ Answer verified
Set 8 : Committees
Twenty four people are part of three committees which are to look at research, teaching, and administration respectively. No two committees have any member in common. No two committees are of the same size. Each committee has three types of people: bureaucrats, educationalists, and politicians, with at least one from each of the three types in each committee. The following facts are also known about the committees: 1. The numbers of bureaucrats in the research and teaching committees are equal, while the number of bureaucrats in the research committee is 75% of the number of bureaucrats in the administration committee. 2. The number of educationalists in the teaching committee is less than the number of educationalists in the research committee. The number of educationalists in the research committee is the average of the numbers of educationalists in the other two committees. 3. 60% of the politicians are in the administration committee, and 20% are in the teaching committee.
What is the number of bureaucrats in the administration committee? (TITA)
Q46CAT 2018 · Slot 1 · TITA✓ Answer verified
Set 8 : Committees
Twenty four people are part of three committees which are to look at research, teaching, and administration respectively. No two committees have any member in common. No two committees are of the same size. Each committee has three types of people: bureaucrats, educationalists, and politicians, with at least one from each of the three types in each committee. The following facts are also known about the committees: 1. The numbers of bureaucrats in the research and teaching committees are equal, while the number of bureaucrats in the research committee is 75% of the number of bureaucrats in the administration committee. 2. The number of educationalists in the teaching committee is less than the number of educationalists in the research committee. The number of educationalists in the research committee is the average of the numbers of educationalists in the other two committees. 3. 60% of the politicians are in the administration committee, and 20% are in the teaching committee.
What is the number of educationalists in the research committee? (TITA)
Q47CAT 2018 · Slot 1✓ Answer verified
Set 8 : Committees
Twenty four people are part of three committees which are to look at research, teaching, and administration respectively. No two committees have any member in common. No two committees are of the same size. Each committee has three types of people: bureaucrats, educationalists, and politicians, with at least one from each of the three types in each committee. The following facts are also known about the committees: 1. The numbers of bureaucrats in the research and teaching committees are equal, while the number of bureaucrats in the research committee is 75% of the number of bureaucrats in the administration committee. 2. The number of educationalists in the teaching committee is less than the number of educationalists in the research committee. The number of educationalists in the research committee is the average of the numbers of educationalists in the other two committees. 3. 60% of the politicians are in the administration committee, and 20% are in the teaching committee.
Which of the following CANNOT be determined uniquely based on the given information?
Every question here appeared in an actual CAT paper. For the full paper, open its page from the question's year and slot, or browse another topic from the list. Also on IIMking.com.