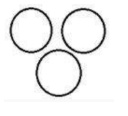
Choose the Venn diagram that best illustrates the relation between the following classes.
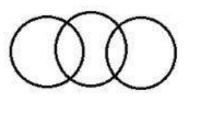
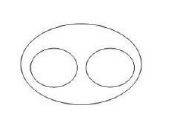
Passengers, Airplane, Taxi
- A
- B
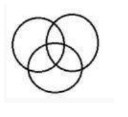
- C
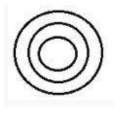
- D
- E
Show answerHide answer
Official CET key: D · Cetking's answer: A — see why below
Approach: Venn diagram classification — check which pairs overlap and which are disjoint.
Solution:
Passengers and Airplane: some passengers travel by airplane → overlap.
Passengers and Taxi: some passengers travel by taxi → overlap.
Airplane and Taxi: two different vehicles, no common member → disjoint.
So Passengers is a middle circle overlapping both, while the end circles do not touch: three circles in a chain.
Figure D shows exactly this.
Why the other options are wrong:
A: three separate circles — ignores the passenger overlaps.
B: three mutually overlapping circles — would need something that is both airplane and taxi.
C: concentric circles — would mean one class wholly contains another.
E: two disjoint sets inside one big set — would mean all airplanes and taxis are passengers.
Cetking shortcut: Two unrelated items + one item linked to both = chain diagram.
Answer: D
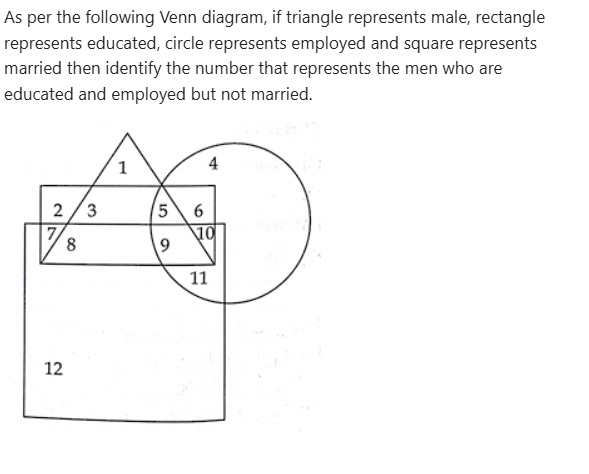
Data read from diagram:
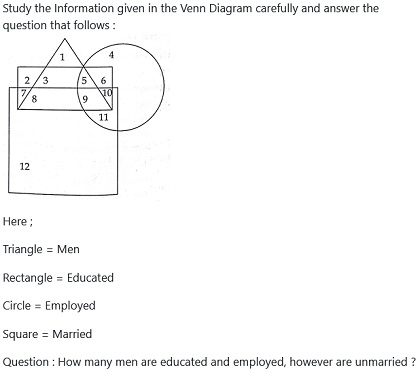
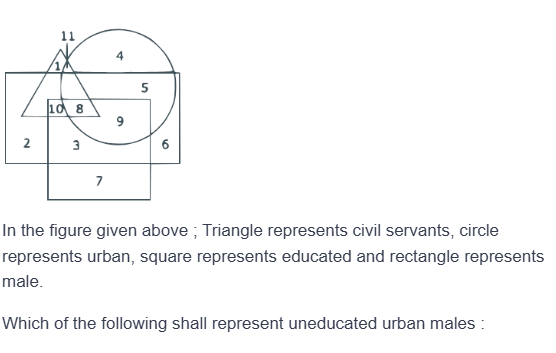
- Shapes: triangle = male, rectangle (horizontal band) = educated, circle = employed (at right), square (large box at bottom) = married.
- 1: triangle only
- 2: rectangle only
- 3: triangle + rectangle
- 4: circle only
- 5: triangle + rectangle + circle
- 6: rectangle + circle
- 7: rectangle + square
- 8: triangle + rectangle + square
- 9: triangle + rectangle + circle + square
- 10: rectangle + circle + square
- 11: circle + square
- 12: square only
As per the following Venn diagram, if triangle represents male, rectangle represents educated, circle represents employed and square represents married then identify the number that represents the men who are educated and employed but not married.
- A3
- B9
- C5
- D8
- E11
Show answerHide answer
Official CET key: C · Cetking's answer: A — see why below
Approach: Venn diagram region reading — inside the required shapes, outside the excluded one.
Solution:
Men educated and employed but not married = inside Triangle AND Rectangle AND Circle, but outside Square.
Regions in Triangle + Rectangle + Circle: 5 and 9.
Region 9 is also inside the Square (married); region 5 lies above the square's top edge.
So the required region is 5.
Why the other options are wrong:
A: 3 is triangle + rectangle only — not employed.
B: 9 is in all four shapes — married.
D: 8 is triangle + rectangle + square — married and not employed.
E: 11 is circle + square only — neither male nor educated.
Cetking shortcut: List the regions common to the three 'yes' shapes first (5, 9), then strike the one inside the 'no' shape.
Answer: C
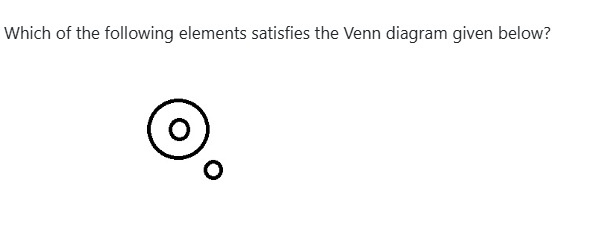
Data read from diagram: two concentric circles (a small circle inside a larger circle) and one separate small circle outside the larger circle, not touching it.
Which of the following elements satisfies the Venn diagram given below?
- AJudge, Thief, Criminal
- BFather, Mother, Parents
- CTeacher, College, Students
- DPolygons, Rectangles, Squares
- EAnimal, Birds, Living Things
Show answerHide answer
Official CET key: A · Cetking's answer: E — see why below
Approach: Match the diagram: one class inside another + one completely separate class.
Solution:
Diagram: a small circle wholly inside a bigger circle, and a third circle outside both.
A: every Thief is a Criminal (Thief inside Criminal); a Judge is neither, so Judge is separate. ✓
So Judge, Thief, Criminal fits the diagram.
Why the other options are wrong:
B: Father and Mother are two separate classes both inside Parents.
C: Teacher, College, Students are different kinds of things with no subset pattern matching.
D: Squares ⊂ Rectangles ⊂ Polygons — three nested circles, no separate one.
E: Birds ⊂ Animals ⊂ Living Things — again three nested circles.
Cetking shortcut: Look for exactly one subset pair plus one unrelated item — only A has an outsider.
Answer: A
Consider the following information and answer the question based on it.
Out of 60 people in a colony, 10 speak only Bengali, 5 speak only Assamese, 10 speak both Hindi and Odia, 12 speak both Marathi and Hindi, 13 speak English, Tamil and Marathi, 5 speak both Assamese and Hindi and the remaining speak both Bengali and Hindi.
What is the ratio of people who speak Bengali to those who speak Marathi ?
- A15/32
- B1/2
- C3/4
- D3/5
- E5/3
Show answerHide answer
Official CET key: D · Cetking's answer: B — see why below
Approach: Group counting — add every group containing the language.
Solution:
Stated groups: 10 + 5 + 10 + 12 + 13 + 5 = 55.
Remaining (Bengali and Hindi) = 60 − 55 = 5.
Bengali speakers = only Bengali 10 + Bengali & Hindi 5 = 15.
Marathi speakers = Marathi & Hindi 12 + English, Tamil & Marathi 13 = 25.
Ratio = 15 : 25 = 3/5.
Why the other options are wrong:
A: 15/32 adds the wrong groups to Marathi.
B, C: wrong group totals.
E: 5/3 is the ratio inverted.
Cetking shortcut: Find the 'remaining' group first — it is the only missing number.
Answer: D
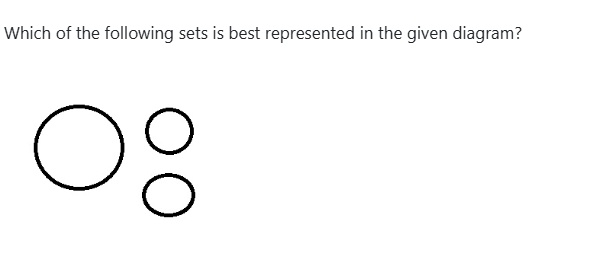
Which of the following sets is best represented in the given diagram?
Data read from diagram: one larger circle and two smaller circles, all three separate (no overlap).
- AVegetables, Potato, Cabbage
- BAnimals, Males, Females and Hermaphrodites
- CTable, Chair, Furniture
- DCountry, States, Districts
- EAnxiety, Intelligence, Strength
Show answerHide answer
Official CET key: E · Cetking's answer: A — see why below
Approach: Venn diagram: read the relationship between the circles, not their sizes.
Solution:
The figure shows three circles (one larger, two smaller) with no overlap and none inside another ⇒ three completely unrelated sets.
Anxiety, Intelligence and Strength are three different, unrelated qualities: no one is a part of another and none is a type of another ⇒ three separate circles.
Circle size in such questions does not show a 'bigger class'; only enclosure or overlap shows a relation.
Why the other options are wrong:
A: Potato and Cabbage are vegetables ⇒ two small circles inside a big one.
B: Males, Females, Hermaphrodites are all inside Animals ⇒ nested.
C: Table and Chair are inside Furniture ⇒ nested.
D: Districts inside States inside Country ⇒ concentric circles.
Cetking shortcut: Separate circles = 'no relation at all'. Any option with a 'type of' link (vegetable, furniture, animal, country) needs enclosure and is out.
Answer: E
Read the scenario given below carefully and answer the question that follows :
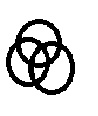
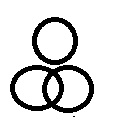
Some of the cricket players are tennis players, some tennis players are hockey players, no cricket player is a hockey player.
In this case, which of the following diagrams correctly represents the above statement ?
- A
- B
- C
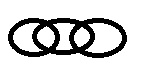
- D
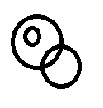
- E
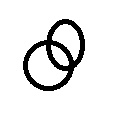
Show answerHide answer
Official CET key: C · Cetking's answer: A — see why below
Approach: Venn diagram from statements: draw pairwise relations.
Solution:
Some cricket players are tennis players ⇒ Cricket and Tennis overlap.
Some tennis players are hockey players ⇒ Tennis and Hockey overlap.
No cricket player is a hockey player ⇒ Cricket and Hockey do not touch.
So Tennis is the middle circle overlapping both sides, while Cricket and Hockey stay apart ⇒ a chain of three circles in a row: Figure C.
Why the other options are wrong:
A: all three circles overlap ⇒ some cricket players would be hockey players.
B: one circle is separate from the overlapping pair ⇒ one 'some' relation missing.
D: one circle sits inside another ⇒ suggests 'all', not 'some'.
E: only two circles.
Cetking shortcut: 'A some B, B some C, A no C' is always the three-circle chain with B in the middle.
Answer: C
Passage / data for this question
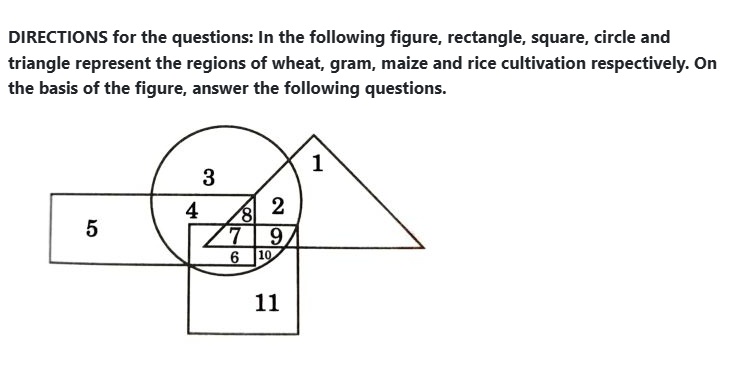
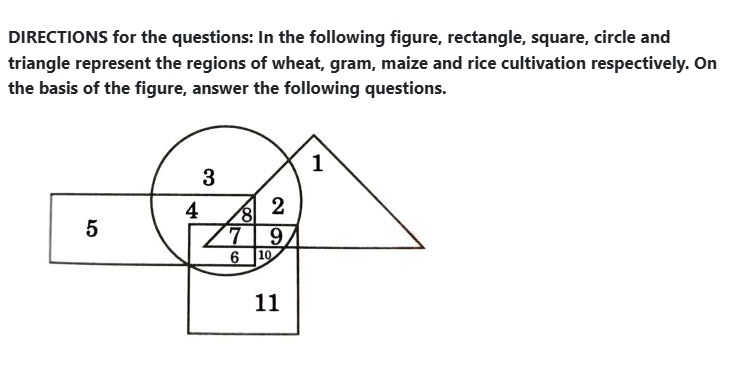
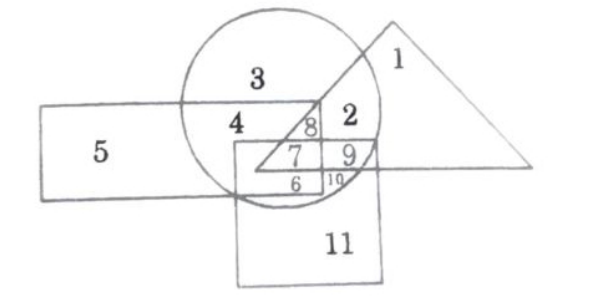
DIRECTIONS for the questions: In the following figure, rectangle, square, circle and triangle represent the regions of wheat, gram, maize and rice cultivation respectively. On the basis of the figure, answer the following questions.
Which area is cultivated by all four commodities?
- A7
- B8
- C9
- D2
- E1
Show answerHide answer
Answer: A ✓ official key
Approach: Rectangle = wheat, square = gram, circle = maize, triangle = rice; check which shapes enclose each region.
Solution:
Region map: 1 = rice only; 2 = maize + rice; 3 = maize only; 4 = wheat + maize; 5 = wheat only; 6 = wheat + maize + gram; 7 = all four; 8 = wheat + maize + rice; 9 = maize + gram + rice; 10 = maize + gram; 11 = gram only.
Region 7 lies inside the rectangle, the square, the circle and the triangle → 7.
Why the other options are wrong:
B 8: above the square (no gram).
C 9: right of the rectangle edge (no wheat).
D 2: maize + rice only.
E 1: rice only.
Cetking shortcut: Look for the region that is inside the square AND left of the rectangle's right edge AND above the triangle's base.
Answer: A
Passage / data for this question
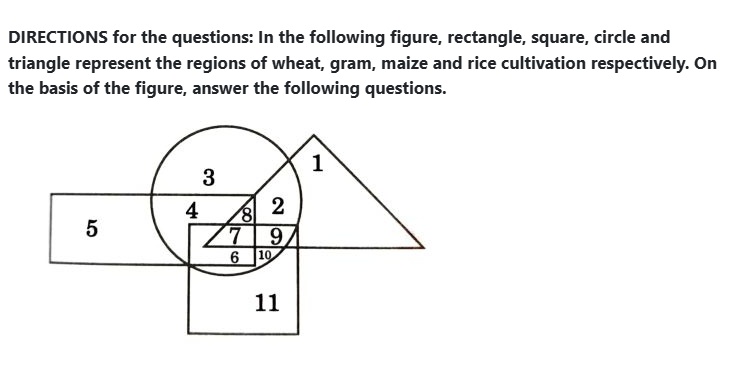
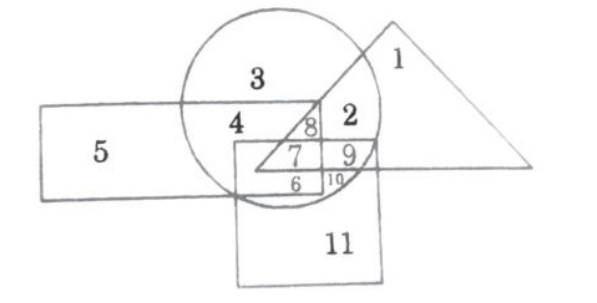
DIRECTIONS for the questions: In the following figure, rectangle, square, circle and triangle represent the regions of wheat, gram, maize and rice cultivation respectively. On the basis of the figure, answer the following questions.
Which area is cultivated by wheat and maize only?
- A8
- B6
- C5
- D4
- E3
Show answerHide answer
Answer: D ✓ official key
Approach: Rectangle = wheat, square = gram, circle = maize, triangle = rice; check which shapes enclose each region.
Solution:
Region map: 1 = rice only; 2 = maize + rice; 3 = maize only; 4 = wheat + maize; 5 = wheat only; 6 = wheat + maize + gram; 7 = all four; 8 = wheat + maize + rice; 9 = maize + gram + rice; 10 = maize + gram; 11 = gram only.
Region 4 is inside the rectangle and the circle only → 4.
Why the other options are wrong:
A 8: also rice.
B 6: also gram.
C 5: wheat only.
E 3: maize only.
Answer: D
Passage / data for this question
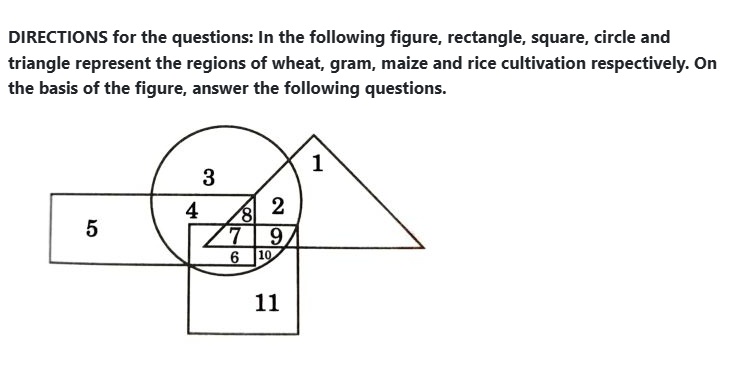
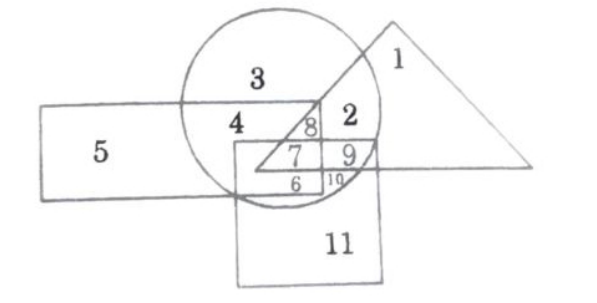
DIRECTIONS for the questions: In the following figure, rectangle, square, circle and triangle represent the regions of wheat, gram, maize and rice cultivation respectively. On the basis of the figure, answer the following questions.
Which area is cultivated by rice only?
- A5
- B1
- C2
- D11
- E3
Show answerHide answer
Answer: B ✓ official key
Approach: Rectangle = wheat, square = gram, circle = maize, triangle = rice; check which shapes enclose each region.
Solution:
Region map: 1 = rice only; 2 = maize + rice; 3 = maize only; 4 = wheat + maize; 5 = wheat only; 6 = wheat + maize + gram; 7 = all four; 8 = wheat + maize + rice; 9 = maize + gram + rice; 10 = maize + gram; 11 = gram only.
Region 1 is the tip of the triangle outside every other shape → 1.
Why the other options are wrong:
A 5: wheat only.
C 2: rice + maize.
D 11: gram only.
E 3: maize only.
Answer: B
Passage / data for this question
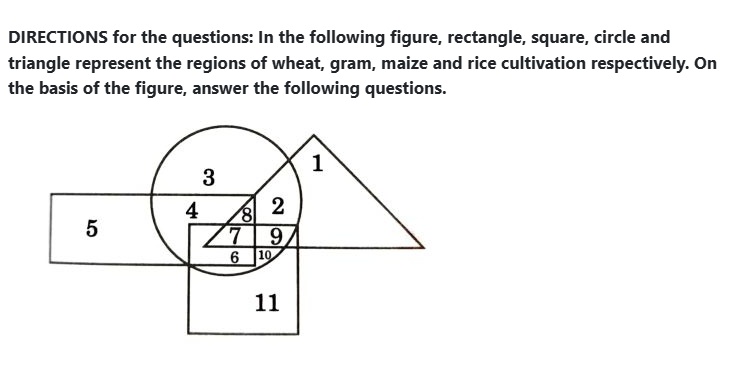
DIRECTIONS for the questions: In the following figure, rectangle, square, circle and triangle represent the regions of wheat, gram, maize and rice cultivation respectively. On the basis of the figure, answer the following questions.
Which area is cultivated by maize only?
- A10
- B2
- C3
- D4
- E11
Show answerHide answer
Answer: C ✓ official key
Approach: Rectangle = wheat, square = gram, circle = maize, triangle = rice; check which shapes enclose each region.
Solution:
Region map: 1 = rice only; 2 = maize + rice; 3 = maize only; 4 = wheat + maize; 5 = wheat only; 6 = wheat + maize + gram; 7 = all four; 8 = wheat + maize + rice; 9 = maize + gram + rice; 10 = maize + gram; 11 = gram only.
Region 3 is inside the circle only → 3.
Why the other options are wrong:
A 10: maize + gram.
B 2: maize + rice.
D 4: maize + wheat.
E 11: gram only.
Answer: C
Passage / data for this question
DIRECTIONS for the questions: In the following figure, rectangle, square, circle and triangle represent the regions of wheat, gram, maize and rice cultivation respectively. On the basis of the figure, answer the following questions.
Which area is cultivated by rice and maize and nothing else?
- A9
- B8
- C2
- D7
- E5
Show answerHide answer
Answer: C ✓ official key
Approach: Rectangle = wheat, square = gram, circle = maize, triangle = rice; check which shapes enclose each region.
Solution:
Region map: 1 = rice only; 2 = maize + rice; 3 = maize only; 4 = wheat + maize; 5 = wheat only; 6 = wheat + maize + gram; 7 = all four; 8 = wheat + maize + rice; 9 = maize + gram + rice; 10 = maize + gram; 11 = gram only.
Region 2 is inside the circle and the triangle only → 2.
Why the other options are wrong:
A 9: also gram.
B 8: also wheat.
D 7: all four.
E 5: wheat only.
Answer: C
Passage / data for this question
DIRECTION for the question: Study the following information carefully and answer the question given below.
Data on 450 candidates, who took an examination in Social Sciences, Mathematics and Science, is given below:
| Category | Number of candidates |
|---|
| Passed in all the subjects | 167 |
| Failed in all the subjects | 60 |
| Failed in Social Sciences | 175 |
| Failed in Mathematics | 199 |
| Failed in Science | 191 |
| Passed in Social Sciences only | 62 |
| Passed in Mathematics only | 48 |
| Passed in Science only | 52 |
How many failed in social science only?
- A15
- B21
- C30
- D42
- E199
Show answerHide answer
Answer: A ✓ official key
Approach: Work in 'passed' regions; failed only in SS = passed in Maths and Science only.
Setting up (common to the set): Total 450. Pass all 3 = 167, fail all 3 = 60. Pass only SS = 62, only Maths = 48, only Science = 52. Let x = pass SS & Maths only, y = pass SS & Sci only, z = pass Maths & Sci only.
Failed SS (175) = 60 + 48 + 52 + z → z = 15.
Failed Maths (199) = 60 + 62 + 52 + y → y = 25.
Failed Science (191) = 60 + 62 + 48 + x → x = 21.
Check: 167 + 60 + 62 + 48 + 52 + 21 + 25 + 15 = 450 ✓
Solution: Failed in Social Sciences only = passed Maths & Science only = z = 15.
Why the other options are wrong:
B 21 = x (failed Science only).
C 30, D 42: no region equals these.
E 199: total failed in Maths.
Cetking shortcut: Failed in X = fail-all + 'passed only' in the other two + passed both others → one subtraction gives each 'exactly two passed' region.
Answer: A
Passage / data for this question
DIRECTION for the question: Study the following information carefully and answer the question given below.
Data on 450 candidates, who took an examination in Social Sciences, Mathematics and Science, is given below:
| Category | Number of candidates |
|---|
| Passed in all the subjects | 167 |
| Failed in all the subjects | 60 |
| Failed in Social Sciences | 175 |
| Failed in Mathematics | 199 |
| Failed in Science | 191 |
| Passed in Social Sciences only | 62 |
| Passed in Mathematics only | 48 |
| Passed in Science only | 52 |
How many failed in one subject only?
- A152
- B144
- C61
- D56
- E191
Show answerHide answer
Answer: C ✓ official key
Approach: Failed exactly one ⇔ passed exactly two.
Setting up (common to the set): Total 450. Pass all 3 = 167, fail all 3 = 60. Pass only SS = 62, only Maths = 48, only Science = 52. Let x = pass SS & Maths only, y = pass SS & Sci only, z = pass Maths & Sci only.
Failed SS (175) = 60 + 48 + 52 + z → z = 15.
Failed Maths (199) = 60 + 62 + 52 + y → y = 25.
Failed Science (191) = 60 + 62 + 48 + x → x = 21.
Check: 167 + 60 + 62 + 48 + 52 + 21 + 25 + 15 = 450 ✓
Solution: x + y + z = 21 + 25 + 15 = 61.
(Also 450 − 167 − 60 − 162 = 61.)
Why the other options are wrong:
A 152 / B 144 / D 56: partial sums or wrong regions.
E 191: total failed in Science.
Answer: C
Passage / data for this question
DIRECTION for the question: Study the following information carefully and answer the question given below.
Data on 450 candidates, who took an examination in Social Sciences, Mathematics and Science, is given below:
| Category | Number of candidates |
|---|
| Passed in all the subjects | 167 |
| Failed in all the subjects | 60 |
| Failed in Social Sciences | 175 |
| Failed in Mathematics | 199 |
| Failed in Science | 191 |
| Passed in Social Sciences only | 62 |
| Passed in Mathematics only | 48 |
| Passed in Science only | 52 |
How many passed in Mathematics and at least one more subject?
- A210
- B203
- C170
- D94
- E52
Show answerHide answer
Answer: B ✓ official key
Approach: Add the two 'Maths + one other' regions and the 'all three' region.
Setting up (common to the set): Total 450. Pass all 3 = 167, fail all 3 = 60. Pass only SS = 62, only Maths = 48, only Science = 52. Let x = pass SS & Maths only, y = pass SS & Sci only, z = pass Maths & Sci only.
Failed SS (175) = 60 + 48 + 52 + z → z = 15.
Failed Maths (199) = 60 + 62 + 52 + y → y = 25.
Failed Science (191) = 60 + 62 + 48 + x → x = 21.
Check: 167 + 60 + 62 + 48 + 52 + 21 + 25 + 15 = 450 ✓
Solution: x + z + 167 = 21 + 15 + 167 = 203.
Check: total passed Maths = 450 − 199 = 251; minus Maths-only 48 = 203 ✓
Why the other options are wrong:
A 210: adds y instead of z.
C 170, D 94: partial sums.
E 52: Science only.
Cetking shortcut: (Total − failed in Maths) − passed Maths only = 251 − 48 = 203.
Answer: B
Passage / data for this question
DIRECTION for the question: Study the following information carefully and answer the question given below.
Data on 450 candidates, who took an examination in Social Sciences, Mathematics and Science, is given below:
| Category | Number of candidates |
|---|
| Passed in all the subjects | 167 |
| Failed in all the subjects | 60 |
| Failed in Social Sciences | 175 |
| Failed in Mathematics | 199 |
| Failed in Science | 191 |
| Passed in Social Sciences only | 62 |
| Passed in Mathematics only | 48 |
| Passed in Science only | 52 |
How many failed in two subjects only?
- A56
- B61
- C152
- D162
- E48
Show answerHide answer
Answer: D ✓ official key
Approach: Failed exactly two ⇔ passed exactly one.
Setting up (common to the set): Total 450. Pass all 3 = 167, fail all 3 = 60. Pass only SS = 62, only Maths = 48, only Science = 52. Let x = pass SS & Maths only, y = pass SS & Sci only, z = pass Maths & Sci only.
Failed SS (175) = 60 + 48 + 52 + z → z = 15.
Failed Maths (199) = 60 + 62 + 52 + y → y = 25.
Failed Science (191) = 60 + 62 + 48 + x → x = 21.
Check: 167 + 60 + 62 + 48 + 52 + 21 + 25 + 15 = 450 ✓
Solution: 62 + 48 + 52 = 162.
Why the other options are wrong:
A 56 / C 152 / E 48: partial sums or a single region.
B 61: failed in exactly one subject.
Answer: D
Passage / data for this question
DIRECTION for the question: Study the following information carefully and answer the question given below.
Data on 450 candidates, who took an examination in Social Sciences, Mathematics and Science, is given below:
| Category | Number of candidates |
|---|
| Passed in all the subjects | 167 |
| Failed in all the subjects | 60 |
| Failed in Social Sciences | 175 |
| Failed in Mathematics | 199 |
| Failed in Science | 191 |
| Passed in Social Sciences only | 62 |
| Passed in Mathematics only | 48 |
| Passed in Science only | 52 |
How many passed in at least in one subject?
- A450
- B390
- C304
- D167
- E60
Show answerHide answer
Answer: B ✓ official key
Approach: 'At least one' is the complement of 'none'.
Solution: 450 − 60 (failed all) = 390.
Why the other options are wrong:
A 450: includes those who failed all.
C 304: wrong sum.
D 167: passed all three.
E 60: failed all three.
Answer: B
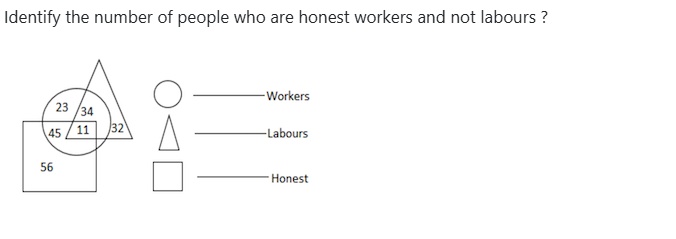
Data read from diagram:
Circle = Workers, Triangle = Labours, Square = Honest.
- Workers only: 23
- Workers and Labours, not Honest: 34
- Workers and Honest, not Labours: 45
- Workers, Labours and Honest: 11
- Labours only: 32
- Honest only: 56
Identify the number of people who are honest workers and not labours ?
- A56
- B101
- C23
- D45
- E11
Show answerHide answer
Answer: D ✓ official key
Approach: Find the region inside Circle (Workers) and Square (Honest) but outside Triangle (Labours).
Solution: Workers ∩ Honest, not Labours = 45.
Why the other options are wrong:
A 56: honest only.
B 101: 45 + 56 (adds non-workers).
C 23: workers only.
E 11: in all three (they are labours).
Answer: D
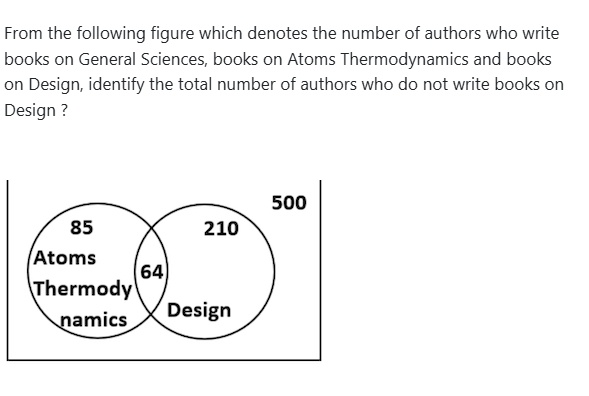
Data read from diagram:
Universal set (General Sciences) = 500. Left circle = Atoms Thermodynamics, right circle = Design.
- Atoms Thermodynamics only: 85
- Both Atoms Thermodynamics and Design: 64
- Design only: 210
- Total (outer box): 500
From the following figure which denotes the number of authors who write books on General Sciences, books on Atoms Thermodynamics and books on Design, identify the total number of authors who do not write books on Design ?
- A500
- B295
- C226
- D210
- E149
Show answerHide answer
Answer: C ✓ official key
Approach: Subtract the whole Design circle from the total.
Solution:
Design circle = 64 (both) + 210 (Design only) = 274.
Not Design = 500 − 274 = 226.
(= 85 Atoms-only + 141 in neither.)
Why the other options are wrong:
A 500: the total.
B 295: 85 + 210.
D 210: Design only.
E 149: the Atoms Thermodynamics circle.
Answer: C
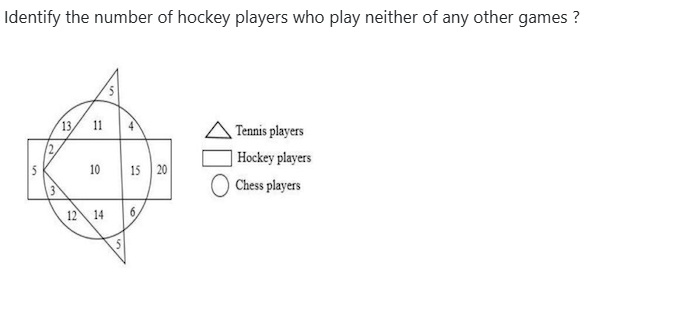
Data read from diagram:
Triangle = Tennis players, Rectangle = Hockey players, Circle = Chess players.
- Tennis only: 5 (top) and 5 (bottom)
- Chess only: 13, 4, 12, 6
- Tennis and Chess, not Hockey: 11 (upper), 14 (lower)
- Chess and Hockey, not Tennis: 2, 3, 15
- Tennis, Chess and Hockey: 10
- Hockey only: 5 (left), 20 (right)
Identify the number of hockey players who play neither of any other games ?
- A5
- B20
- C28
- D23
- E25
Show answerHide answer
Answer: E ✓ official key
Approach: Find every piece of the Rectangle (Hockey) that lies outside both the Triangle (Tennis) and the Circle (Chess).
Solution: Hockey-only pieces: 5 (left) + 20 (right) = 25.
Why the other options are wrong:
A 5 / B 20: only one of the two pieces.
C 28 / D 23: add or drop a shared region by mistake.
Answer: E
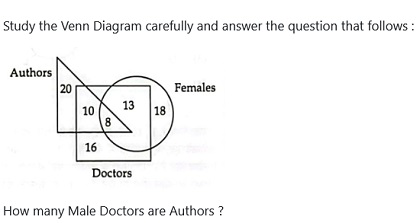
Study the Venn Diagram carefully and answer the question that follows :
How many Male Doctors are Authors ?
- A5
- B6
- C8
- D4
- E10
Show answerHide answer
Answer: E ✓ official key
Approach: Pick the region inside Authors and Doctors but outside Females.
Solution:
Triangle = Authors, Rectangle = Doctors, Circle = Females.
Male Doctors who are Authors → inside triangle ∩ rectangle, outside circle.
That region holds 10.
(8 is in all three — female author-doctors; 13 is female doctors who are not authors.)
Why the other options are wrong:
C) 8 — those are females.
A), B), D) — no such region value.
Answer: E
Study the Information given in the Venn Diagram carefully and answer the question that follows :
Here ;
Triangle = Men
Rectangle = Educated
Circle = Employed
Square = Married
Question : How many men are educated and employed, however are unmarried ?
- A7
- B10
- C9
- D5
- E4
Show answerHide answer
Answer: D ✓ official key
Approach: Region inside Triangle, Rectangle and Circle but outside the Square.
Solution:
Men (triangle) ∩ Educated (rectangle) ∩ Employed (circle), not Married (square).
Region 5 lies in the triangle, rectangle and circle and above the square → 5.
(Region 9 is the same set but inside the square — married.)
Why the other options are wrong:
C) 9 — married.
B) 10 — lies outside the triangle (not men).
A) 7 — not a man and not employed (outside the triangle and the circle).
E) 4 — employed only, not men or educated.
Answer: D
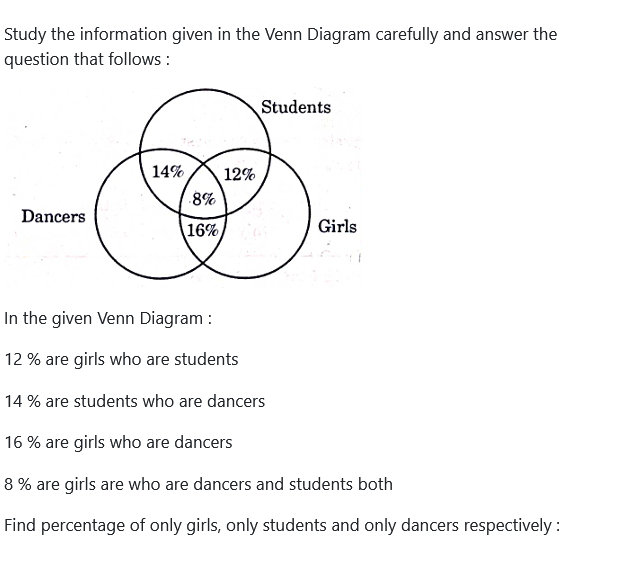
Study the information given in the Venn Diagram carefully and answer the question that follows :
In the given Venn Diagram :
12 % are girls who are students
14 % are students who are dancers
16 % are girls who are dancers
8 % are girls who are dancers and students both
Find percentage of only girls, only students and only dancers respectively :
- A72, 74, 70
- B74, 70, 72
- C64, 66, 70
- D80, 78, 76
- E64, 72, 70
Show answerHide answer
Answer: A ✓ official key
Approach: Take each group as 100% and remove the overlap shares shown for it.
Solution:
Only girls = 100 − 12 − 16 = 72
Only students = 100 − 12 − 14 = 74
Only dancers = 100 − 14 − 16 = 70
→ 72, 74, 70
Answer: A
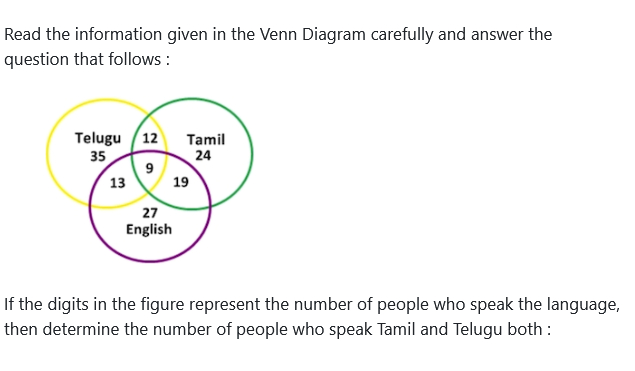
Read the information given in the Venn Diagram carefully and answer the question that follows :
If the digits in the figure represent the number of people who speak the language, then determine the number of people who speak Tamil and Telugu both :
- A9
- B12
- C21
- D13
- E40
Show answerHide answer
Answer: C ✓ official key
Approach: Add every region common to Telugu and Tamil.
Solution:
Telugu ∩ Tamil (only these two) = 12
Telugu ∩ Tamil ∩ English = 9
Speak Tamil and Telugu both = 12 + 9 = 21
Why the other options are wrong:
A) 9 — only the all-three region.
B) 12 — misses the 9 who also speak English.
D) 13 — Telugu–English region.
E) 40 — wrong addition.
Answer: C
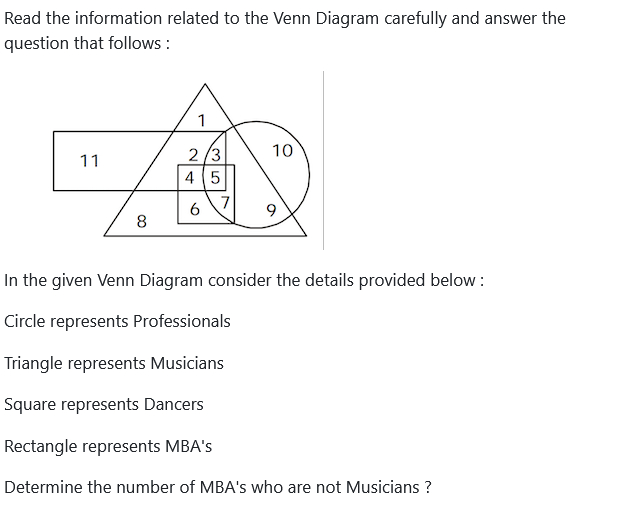
Read the information related to the Venn Diagram carefully and answer the question that follows :
In the given Venn Diagram consider the details provided below :
Circle represents Professionals
Triangle represents Musicians
Square represents Dancers
Rectangle represents MBA's
Determine the number of MBA's who are not Musicians ?
- A10
- B7
- C12
- D11
- E13
Show answerHide answer
Answer: D ✓ official key
Approach: Regions inside the Rectangle (MBAs) but outside the Triangle (Musicians).
Solution:
The rectangle contains regions 11, 2, 3, 4 and 5.
Regions 2, 3, 4 and 5 all lie inside the triangle (musicians).
Only region 11 is outside the triangle → 11 MBAs are not musicians.
Why the other options are wrong:
A) 10 — professionals only, not MBAs.
B) 7 — not inside the rectangle.
C) 12 matches no region; E) 13 = 11 + 2 wrongly adds a musician region.
Answer: D
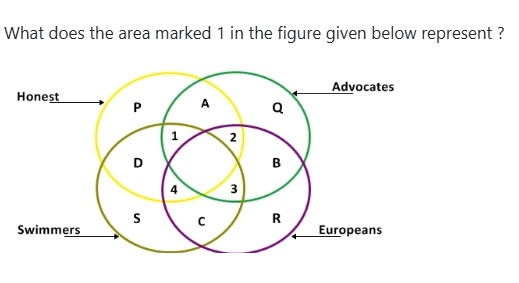
What does the area marked 1 in the figure given below represent ?
Figure: Venn diagram of four overlapping circles labelled Honest, Advocates, Swimmers and Europeans, with regions marked P, A, Q, 1, 2, B, D, 4, 3, S, C, R.
- AAll Honest European swimmers
- BAll honest advocates who are swimmers
- CAll non- European advocates who are honest swimmers
- DAll non- Europeans who are honest swimmers
- EAll Honest European advocates who are swimmers
Show answerHide answer
Official CET key: C · Cetking's answer: E — see why below
Approach: Read which circles contain the region and which do not.
Solution:
Region 1 lies inside the Honest (yellow), Advocates (green) and Swimmers (olive) circles.
It lies just left of the Europeans (purple) circle — outside it (region 2 is the one inside all four).
So region 1 = honest advocates who are swimmers and NOT European.
Why the other options are wrong:
A: says European and omits advocates.
B: does not exclude Europeans (that covers regions 1 and 2).
D: omits advocates.
E: European advocates who are honest swimmers = region 2.
Cetking shortcut: For any region, list IN-circles and OUT-circles; the right option names both.
Answer: C
There are 200 students in a particular class. 50% students play cricket, 20% students play football and 10% students play both the games. What is the number of students who play neither cricket nor football?
- A150
- B130
- C80
- D135
- E140
Show answerHide answer
Answer: C ✓ official key
Approach: Two-set inclusion–exclusion.
Solution:
Cricket = 50% of 200 = 100; Football = 20% = 40; Both = 10% = 20.
At least one = 100 + 40 − 20 = 120.
Neither = 200 − 120 = 80.
Cetking shortcut: Work in %: 50 + 20 − 10 = 60% play some game → 40% of 200 = 80.
Answer: C
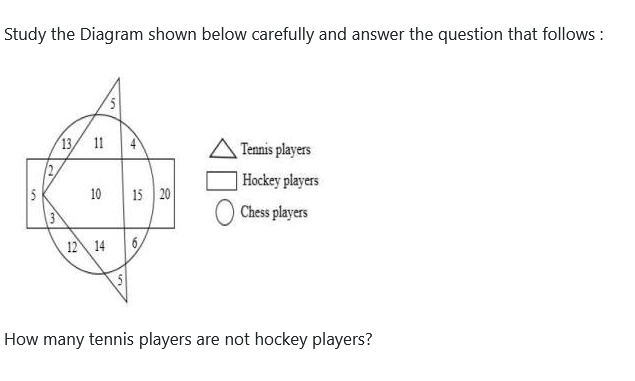
Study the Diagram shown below carefully and answer the question that follows :
Legend: triangle = Tennis players; rectangle = Hockey players; circle = Chess players.
Data read from diagram:
| Region | Number |
|---|
| Tennis only (top) | 5 |
| Tennis only (bottom) | 5 |
| Tennis ∩ Chess, not Hockey (upper) | 11 |
| Tennis ∩ Chess, not Hockey (lower) | 14 |
| Tennis ∩ Hockey ∩ Chess | 10 |
| Chess only | 13, 4, 12, 6 |
| Hockey ∩ Chess, not Tennis | 2, 3, 15 |
| Hockey only | 5, 20 |
How many tennis players are not hockey players?
- A35
- B56
- C37
- D29
- E45
Show answerHide answer
Answer: A ✓ official key
Approach: Read the Venn figure: Tennis (triangle) regions that lie outside the Hockey rectangle.
Solution:
Tennis regions outside the rectangle: top tip 5, Tennis ∩ Chess above the rectangle 11, Tennis ∩ Chess below the rectangle 14, bottom tip 5.
Tennis not Hockey = 5 + 11 + 14 + 5 = 35.
(10 lies in all three shapes, so it is excluded.)
Why the other options are wrong:
- B 56 / E 45 – include hockey regions (10 etc.).
- C 37 / D 29 – miss or wrongly add a region.
Cetking shortcut: Shade the triangle, then strike out everything inside the rectangle – add what is left.
Answer: A
From a supermarket, 15 customers bought orange, 15 bought watermelon, 20 bought blueberry, 2 bought all the three fruits and 8 bought at least two of these. How many bought at least one fruit from the supermarket?
- A43
- B42
- C38
- D40
- E45
Show answerHide answer
Answer: D ✓ official key
Approach: Three-set union with 'at least two' and 'all three'.
Solution:
Sum of individual counts = 15 + 15 + 20 = 50.
At least two = 8, all three = 2 → exactly two = 8 − 2 = 6.
Union = Σ − (exactly two) − 2 × (all three) = 50 − 6 − 2 × 2 = 40.
Cetking shortcut: Σ counts exactly-two buyers twice and all-three buyers thrice – subtract the extras: 6 × 1 + 2 × 2 = 10.
Answer: D
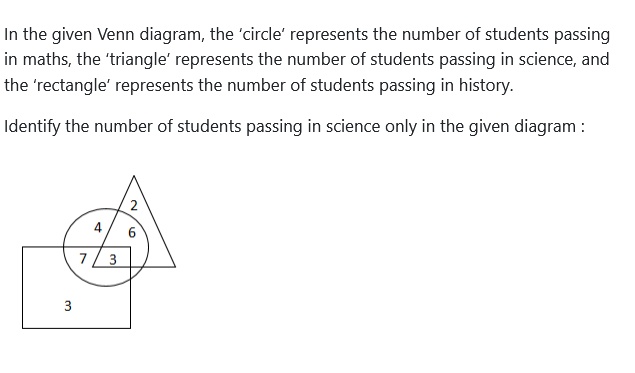
In the given Venn diagram, the ‘circle’ represents the number of students passing in maths, the ‘triangle’ represents the number of students passing in science, and the ‘rectangle’ represents the number of students passing in history.
Data read from diagram:
| Region | Number |
|---|
| Science only (triangle only) | 2 |
| Maths only (circle only) | 4 |
| Maths ∩ Science, not History | 6 |
| Maths ∩ History, not Science | 7 |
| Maths ∩ Science ∩ History | 3 |
| History only (rectangle only) | 3 |
Identify the number of students passing in science only in the given diagram :
- A6
- B2
- C3
- D7
- E4
Show answerHide answer
Answer: B ✓ official key
Approach: Read the region inside only the triangle.
Solution:
Triangle (Science) regions: 2 (outside circle and rectangle), 6 (with Maths), 3 (with Maths and History).
Science only = region in the triangle alone = 2.
Why the other options are wrong:
- A 6 – Maths and Science.
- C 3 – all three subjects (or History only).
- D 7 – Maths and History.
- E 4 – Maths only.
Answer: B
Out of the 100 players, 20 people love only football, 30 people love both football and hockey, 15 people love only cricket, 25 people love only hockey, 5 people love both football and cricket and the remaining love only basketball. How many players like football?
- A35
- B20
- C25
- D55
- E60
Show answerHide answer
Answer: D ✓ official key
Approach: Add every region that contains football.
Solution:
Football only = 20; Football & Hockey = 30; Football & Cricket = 5.
Football lovers = 20 + 30 + 5 = 55.
(Check: only basketball = 100 − 20 − 30 − 15 − 25 − 5 = 5.)
Why the other options are wrong:
- B 20 – football only.
- A 35 / C 25 – miss one overlap.
Answer: D
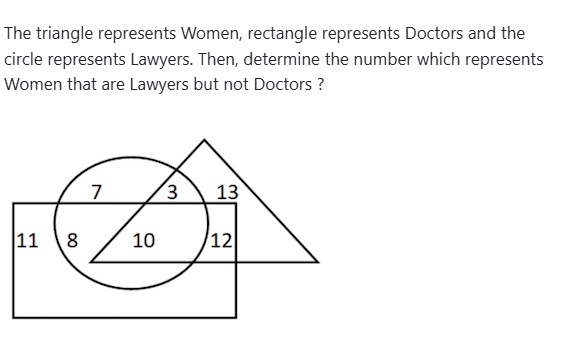
The triangle represents Women, rectangle represents Doctors and the circle represents Lawyers. Then, determine the number which represents Women that are Lawyers but not Doctors ?
- A8
- B3
- C12
- D10
- E2
Show answerHide answer
Answer: B ✓ official key
Approach: Find the region inside the triangle and the circle but outside the rectangle.
Solution:
Triangle = Women, Circle = Lawyers, Rectangle = Doctors.
Region 3 lies inside the triangle and the circle, above the rectangle's top edge → women lawyers who are not doctors.
Why the other options are wrong:
10 – inside all three (women lawyers who are doctors).
12 – triangle and rectangle, outside the circle (women doctors, not lawyers).
8 – circle and rectangle only (male lawyer-doctors).
2 – not a region in the figure.
Answer: B
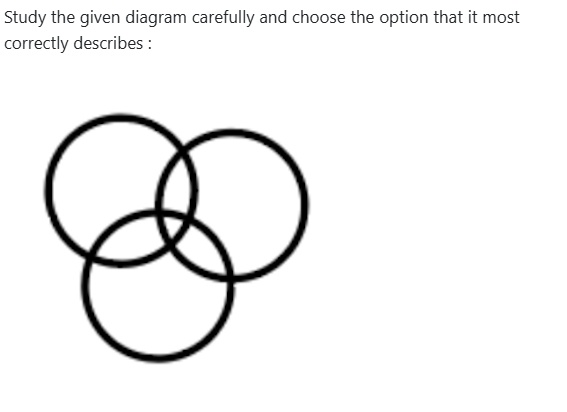
Study the given diagram carefully and choose the option that it most correctly describes :
- AStationery, Pens, Pigeons
- BDoctors, Mothers, Sons-in-law
- CBureaucrats, Men, Women
- DBalls, Wickets, Aliens
- EExtroverts, Women, Tall
Show answerHide answer
Official CET key: E · Cetking's answer: B — see why below
Approach: Three mutually overlapping circles need every pair and all three together to be able to overlap.
Solution:
Extroverts, Women, Tall: a person can be any combination — an extrovert, a woman and tall, or any two, or one — so all three sets overlap, exactly as drawn.
Why the other options are wrong:
A – Pens are inside Stationery; Pigeons are separate.
B – Mothers (female) and Sons-in-law (male) cannot overlap.
C – Men and Women do not overlap.
D – Balls, Wickets, Aliens are three separate things.
Answer: E
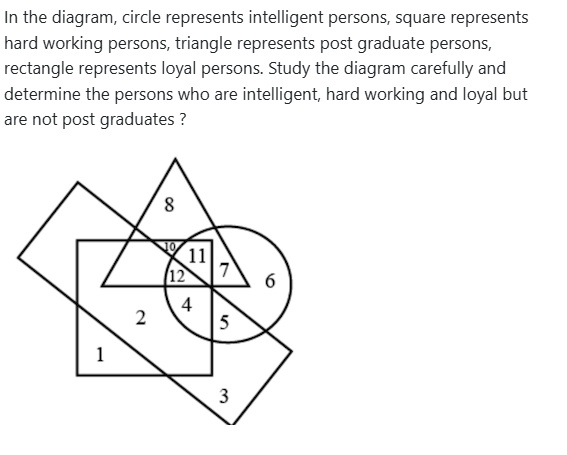
In the diagram, circle represents intelligent persons, square represents hard working persons, triangle represents post graduate persons, rectangle represents loyal persons. Study the diagram carefully and determine the persons who are intelligent, hard working and loyal but are not post graduates ?
- A5
- B4
- C9
- D6
- E11
Show answerHide answer
Official CET key: B · Cetking's answer: D — see why below
Approach: Pick the region inside circle, square and rectangle but outside the triangle.
Solution:
Circle = intelligent, Square = hard working, Rectangle (tilted) = loyal, Triangle = post graduate.
Region 4 lies inside the circle, inside the square and inside the tilted rectangle, and below the triangle's base → intelligent, hard working, loyal, not post graduate.
Why the other options are wrong:
5 – circle and rectangle but outside the square (not hard working).
6 – circle only.
9 – no such region in the figure.
11 – inside the triangle (post graduate).
Answer: B
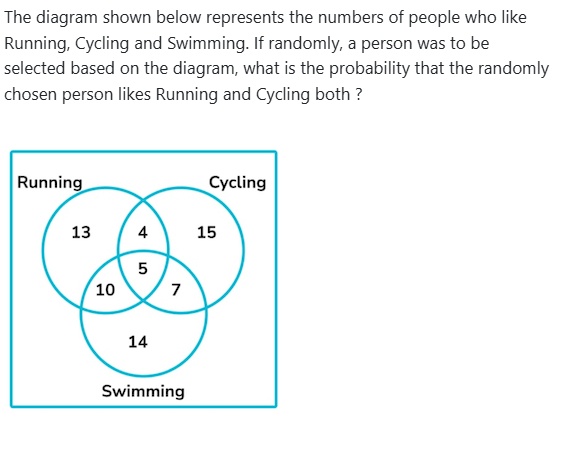
Data read from diagram: Running only 13; Running and Cycling only 4; Cycling only 15; Running and Swimming only 10; all three 5; Cycling and Swimming only 7; Swimming only 14.
The diagram shown below represents the numbers of people who like Running, Cycling and Swimming. If randomly, a person was to be selected based on the diagram, what is the probability that the randomly chosen person likes Running and Cycling both ?
- A2 : 5
- B1 : 3
- C9 : 68
- D1 : 20
- E4 : 13
Show answerHide answer
Answer: C ✓ official key
Approach: Venn diagram probability — favourable region ÷ total of all regions.
Solution:
Regions from the figure: Running only 13, Cycling only 15, Swimming only 14, Running∩Cycling only 4, Running∩Swimming only 10, Cycling∩Swimming only 7, all three 5.
Total people = 13 + 15 + 14 + 4 + 10 + 7 + 5 = 68.
Likes Running AND Cycling = (R∩C only) + (all three) = 4 + 5 = 9.
Probability = 9/68, i.e. 9 : 68 as written in the options.
Why the other options are wrong:
A (2 : 5), B (1 : 3), D (1 : 20), E (4 : 13): none has denominator 68 — the total of the diagram.
Taking only the '4' region (4/68 = 1 : 17) forgets the centre region, which also likes both.
Cetking shortcut: The denominator must be the full total (68); only option C has it.
Answer: C
There are 80 students admitted to a music school. Some students can play only violin, and some can play only harmonium. 20 children can play both violin and harmonium. If the number of students who can play violin is 30, then how many students can play harmonium? Also, how many students can play only harmonium and how many can play only violin?
- A70, 50 and 10 respectively
- B60, 45 and 12 respectively
- C65, 50 and 15 respectively
- D68, 48 and 10 respectively
- E72, 45 and 11 respectively
Show answerHide answer
Answer: A
Approach: Two-set Venn: Total = only V + only H + both (everyone plays at least one).
Solution:
Violin total = 30, both = 20 → only violin = 30 − 20 = 10.
Only harmonium = 80 − 10 − 20 = 50.
Harmonium total = 50 + 20 = 70.
So: 70, 50 and 10.
Cetking shortcut: Only option A ends with 10 for only-violin (30 − 20) — the rest can be eliminated instantly.
Answer: A
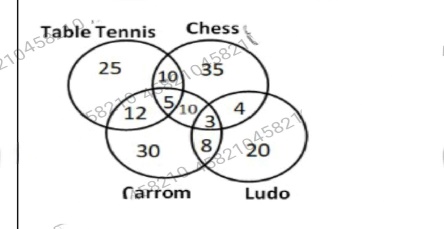
The following diagram shows the number of people who play table tennis,Chess, Carrom and Ludo.
If the total number of people is 600 Then what is the number of people who play Chess and Ludo but not carom.
- A3
- B4
- C10
- D8
- E5
Show answerHide answer
Answer: B
Approach: Read the exact Venn region.
Solution:
Chess ∩ Ludo regions: 4 (outside Carrom) and 3 (inside Carrom).
'Chess and Ludo but not Carrom' = the region inside Chess and Ludo but outside Carrom (and outside Table Tennis) = 4.
The total of 600 is not needed.
Why the other options are wrong:
A: 3 is Chess ∩ Ludo ∩ Carrom.
C: 10 is Table Tennis ∩ Chess (or Chess ∩ Carrom).
D: 8 is Carrom ∩ Ludo only.
E: 5 is TT ∩ Chess ∩ Carrom.
Answer: B
A club has 256 members, of whom 144 can play football, 123 can play tennis, and 132 can play cricket. Moreover, 58 members can play both football and tennis, 25 can play both cricket and tennis, while 63 can play both football and cricket. If every member can play at least one game, then the number of members who can play only tennis is
- A48
- B43
- C45
- D52
- E50
Show answerHide answer
Answer: B
Approach: Three-set inclusion–exclusion, everyone in at least one set.
Solution: Total = F + T + C − (F∩T + T∩C + F∩C) + (F∩T∩C)
256 = 144 + 123 + 132 − (58 + 25 + 63) + x = 399 − 146 + x = 253 + x → x = 3.
Only tennis = T − F∩T − T∩C + x = 123 − 58 − 25 + 3 = 43.
Cetking shortcut: Only-T = T − (pairs touching T) + all-three; find x from the total first.
Answer: B
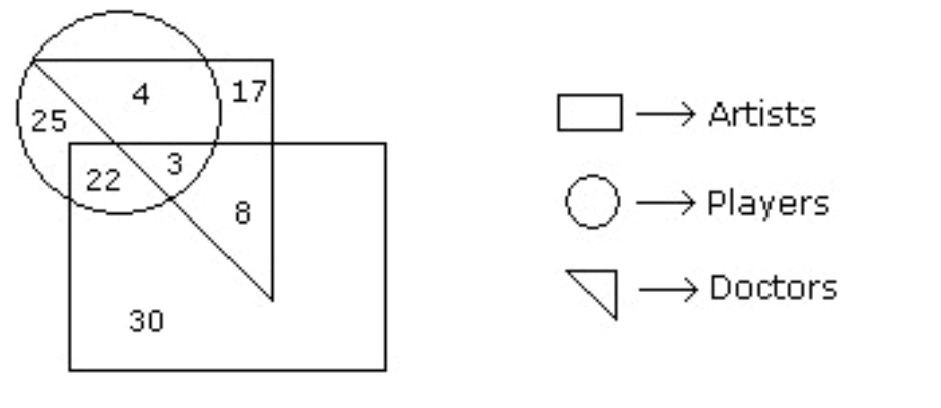
Study the following figure and answer the questions given below.
How many artists are players?
- A32
- B15
- C25
- D17
- E12
Show answerHide answer
Answer: C
Approach: Venn figure — read the overlap of the two named shapes.
Solution: Artists = rectangle, players = circle.
Regions inside both the circle and the rectangle: 22 (artist-players, not doctors) and 3 (artist-players who are also doctors).
Artists who are players = 22 + 3 = 25.
Why the other options are wrong:
A 32 — adds wrong regions.
B 15 — no such combination.
D 17 — triangle-only (doctors only) region.
E 12 — no such combination.
Cetking shortcut: Include every region inside both shapes, whatever third shape also covers it — the 3 sitting under the triangle line is the usual miss.
Answer: C
Passage / data for this question
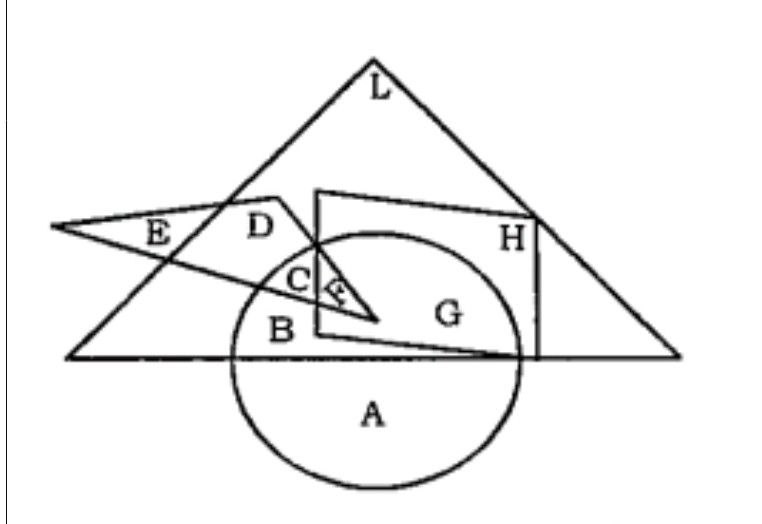
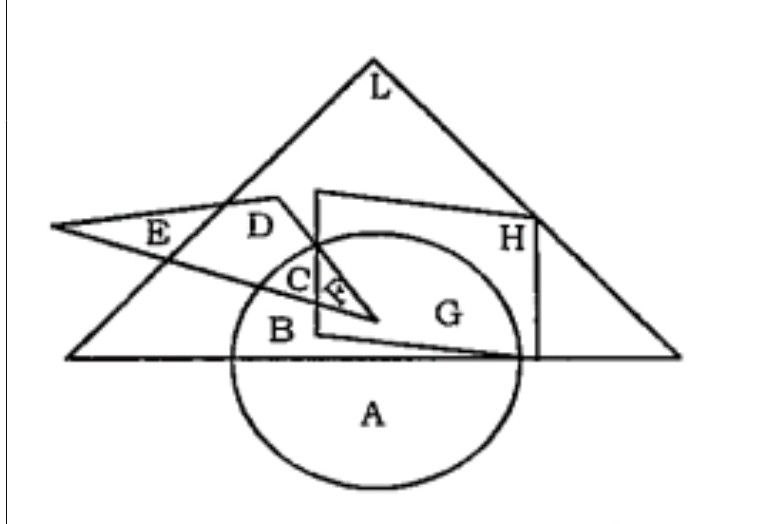
In the following figure, the smaller triangle represents the teachers, the big triangle, the politicians, the circle, the graduates and the rectangle, the members of Parliament. Different regions are represented by the letters of the English alphabet.
On the basis of the above diagram, answer the following questions:
Which among the following regions represents the graduates or teachers, but not politicians?
- AB G
- BG H
- CA E
- DE F
- EA C
Show answerHide answer
Answer: C
Approach: Venn regions — (graduates OR teachers) AND NOT politicians.
Solution: Reading the figure (big triangle = politicians, small triangle = teachers, circle = graduates, rectangle = MPs):
E = teacher only; D = teacher + politician; C = teacher + graduate + politician; F = teacher + graduate + politician + MP;
B = graduate + politician; G = graduate + politician + MP; A = graduate only; H = politician + MP; L = politician only.
Regions outside the big triangle that lie in the small triangle or the circle: E (teacher only) and A (graduate only).
Why the other options are wrong:
A B, G — inside the politicians' triangle.
B G, H — inside the politicians' triangle (H is not a graduate or teacher either).
D E, F — F is a politician.
E A, C — C is a politician.
Cetking shortcut: Only two letters lie outside the big triangle and inside another shape — E and A.
Answer: C
Passage / data for this question
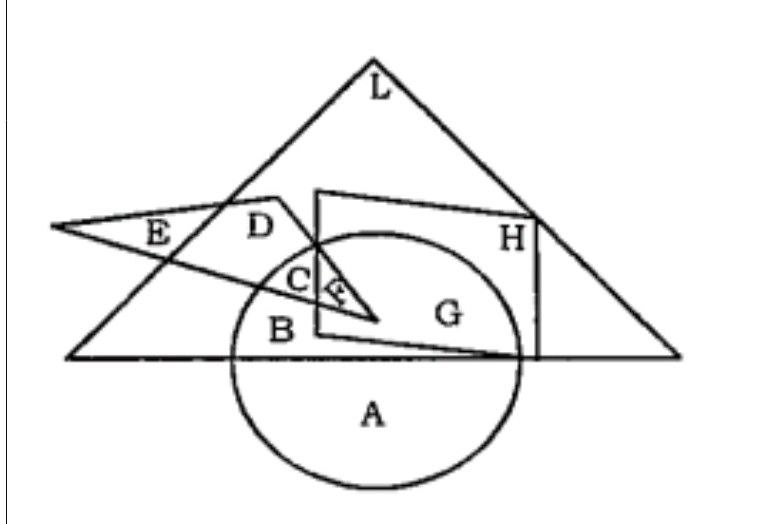
In the following figure, the smaller triangle represents the teachers, the big triangle, the politicians, the circle, the graduates and the rectangle, the members of Parliament. Different regions are represented by the letters of the English alphabet.
On the basis of the above diagram, answer the following questions:
Which among the following regions represents the graduate politicians, but not the members of parliament?
- AB, C
- BL, B
- CD, H
- DD, L
- EL, H
Show answerHide answer
Answer: A
Approach: Venn regions — graduates AND politicians AND NOT MPs.
Solution: Reading the figure (big triangle = politicians, small triangle = teachers, circle = graduates, rectangle = MPs):
E = teacher only; D = teacher + politician; C = teacher + graduate + politician; F = teacher + graduate + politician + MP;
B = graduate + politician; G = graduate + politician + MP; A = graduate only; H = politician + MP; L = politician only.
Graduate politicians (circle ∩ big triangle) = B, C, F, G.
Remove those inside the rectangle (MPs): F and G.
Left: B, C.
Why the other options are wrong:
B L, B — L is not a graduate.
C D, H — neither is a graduate.
D D, L — neither is a graduate.
E L, H — neither is a graduate; H is an MP.
Cetking shortcut: Every option except A contains a non-graduate letter (L, D or H) — eliminate on sight.
Answer: A
Passage / data for this question
In the following figure, the smaller triangle represents the teachers, the big triangle, the politicians, the circle, the graduates and the rectangle, the members of Parliament. Different regions are represented by the letters of the English alphabet.
On the basis of the above diagram, answer the following questions:
Which among the following regions represents the politicians who are neither graduates nor teachers?
- AE, F
- BD, E
- CL, H
- DC, D
- EC, L
Show answerHide answer
Answer: C
Approach: Venn regions — politicians AND NOT graduates AND NOT teachers.
Solution: Reading the figure (big triangle = politicians, small triangle = teachers, circle = graduates, rectangle = MPs):
E = teacher only; D = teacher + politician; C = teacher + graduate + politician; F = teacher + graduate + politician + MP;
B = graduate + politician; G = graduate + politician + MP; A = graduate only; H = politician + MP; L = politician only.
Inside the big triangle but outside both the circle and the small triangle: L (politician only) and H (politician + MP).
Being an MP does not matter for this condition.
Why the other options are wrong:
A E, F — E is not a politician; F is a teacher and graduate.
B D, E — D is a teacher; E is not a politician.
D C, D — both are teachers.
E C, L — C is a teacher and graduate.
Answer: C
Passage / data for this question
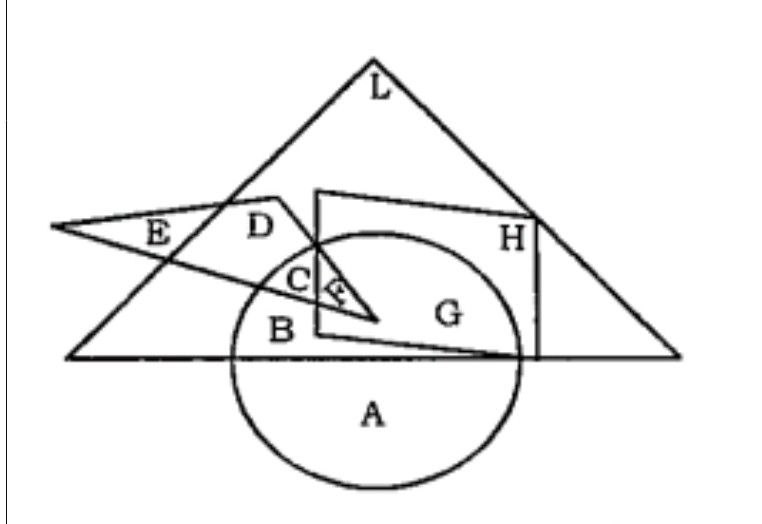
In the following figure, the smaller triangle represents the teachers, the big triangle, the politicians, the circle, the graduates and the rectangle, the members of Parliament. Different regions are represented by the letters of the English alphabet.
On the basis of the above diagram, answer the following questions:
Which of the following regions represent the members of parliament who are graduate as well as teachers?
- AG
- BH
- CF
- DC
- EB
Show answerHide answer
Answer: C
Approach: Venn regions — MPs AND graduates AND teachers.
Solution: Reading the figure (big triangle = politicians, small triangle = teachers, circle = graduates, rectangle = MPs):
E = teacher only; D = teacher + politician; C = teacher + graduate + politician; F = teacher + graduate + politician + MP;
B = graduate + politician; G = graduate + politician + MP; A = graduate only; H = politician + MP; L = politician only.
The only region common to the rectangle, the circle and the small triangle is F.
Why the other options are wrong:
A G — not a teacher.
B H — not a graduate or teacher.
D C — not an MP.
E B — not an MP or teacher.
Answer: C
In a club of 30 people, all of them belong to at least one group - Chess, Drama and Art. 6 people belong only to the Art group. 5 people belong to all three groups. 2 people have joined the Chess and the Art group but not the Drama group. 15 people belong to the Art group. 2 people have joined only the Chess group. 3 people have joined only the Drama group.
How many people belong to exactly one group?
- A11
- B9
- C15
- D14
- E13
Show answerHide answer
Answer: A
Approach: Three-set Venn diagram — 'exactly one group' = sum of the 'only' regions.
Solution:
Only Art = 6, only Chess = 2, only Drama = 3.
All three = 5; Chess & Art only = 2.
Check with Art total 15: 6 + 5 + 2 + (Drama & Art only) = 15 → Drama & Art only = 2.
Check with total 30: 6 + 2 + 3 + 5 + 2 + 2 + (Chess & Drama only) = 30 → Chess & Drama only = 10. Data is consistent.
Exactly one group = 6 + 2 + 3 = 11.
Why the other options are wrong:
B (9), D (14), E (13): add or drop one of the 'only' regions.
C (15): is the Art total, not 'exactly one'.
Cetking shortcut: 'Exactly one' needs only the three 'only' numbers — they are given directly.
Answer: A
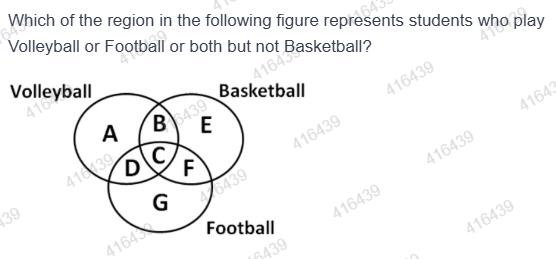
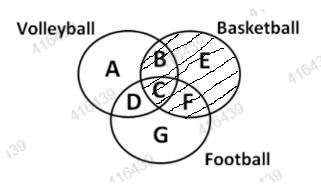
Which of the region in the following figure represents students who play Volleyball or Football or both but not Basketball?
[Venn diagram of Volleyball, Basketball, Football with regions A–G: see figure]
- AA+G
- BA+D+G
- CC+D
- DA+C+D
- EA+G+D
Show answerHide answer
Answer: B
Approach: Venn diagram: take the union of two circles and remove everything inside the third.
Solution:
Volleyball circle = A, B, C, D; Football circle = D, C, F, G; Basketball circle = B, C, E, F.
Volleyball or Football (or both) = A, B, C, D, F, G.
Remove every region inside Basketball (B, C, F): left with A, D, G.
Required region = A + D + G.
Why the other options are wrong:
A (A+G): misses D, students who play both Volleyball and Football but not Basketball.
C (C+D) and D (A+C+D): include C, which lies inside Basketball, and miss G.
E (A+G+D) lists the same three regions as B; B is the keyed option.
Cetking shortcut: Shade the "NOT" circle first, then read the unshaded parts of the other two circles.
Answer: B
Passage / data for this question
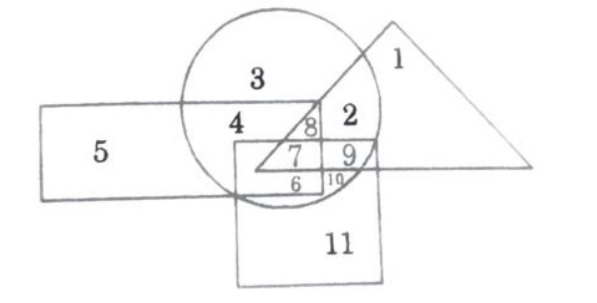
DIRECTIONS for the question: In the following figure, rectangle, square, circle, and triangle represent the region of wheat, gram, maize and rice cultivation respectively. On the basis the figure, answer the following questions.
[IMG:https://suqcijtpfeaystltekfn.supabase.co/storage/v1/object/public/cet-papers/mba-cet/2025/slot-3/CET2025-S3-Q011_q00.png]
Which area is cultivated by all four commodities?
- A7
- B8
- C9
- D2
- E1
Show answerHide answer
Answer: A
Approach: Venn diagram: find the region common to all four shapes.
Solution:
Rectangle = wheat, square = gram, circle = maize, triangle = rice. Read each numbered region by asking: inside which shapes is it?
Region 7 lies inside the rectangle, the square, the circle and the triangle at the same time.
So all four crops are grown in region 7.
Why the other options are wrong:
B 8: inside rectangle, circle, triangle but above the square — gram missing.
C 9: inside square, circle, triangle but right of the rectangle — wheat missing.
D 2: circle and triangle only.
E 1: triangle only.
Cetking shortcut: The all-shape region is always the innermost cell where the most boundaries cross — here the small cell 7.
Answer: A
Passage / data for this question
DIRECTIONS for the question: In the following figure, rectangle, square, circle, and triangle represent the region of wheat, gram, maize and rice cultivation respectively. On the basis the figure, answer the following questions.
[IMG:https://suqcijtpfeaystltekfn.supabase.co/storage/v1/object/public/cet-papers/mba-cet/2025/slot-3/CET2025-S3-Q012_q00.png]
Which area is cultivated by wheat and maize only?
- A8
- B6
- C5
- D4
- E3
Show answerHide answer
Answer: D
Approach: Venn diagram: region inside exactly two named shapes.
Solution:
Rectangle = wheat, square = gram, circle = maize, triangle = rice. Read each numbered region by asking: inside which shapes is it?
Wheat and maize only = inside rectangle and circle, outside square and triangle.
Region 4 is in the rectangle and circle, above the square and left of the triangle → 4.
Why the other options are wrong:
A 8: also inside the triangle (rice).
B 6: also inside the square (gram).
C 5: rectangle only.
E 3: circle only.
Answer: D
Passage / data for this question
DIRECTIONS for the question: In the following figure, rectangle, square, circle, and triangle represent the region of wheat, gram, maize and rice cultivation respectively. On the basis the figure, answer the following questions.
[IMG:https://suqcijtpfeaystltekfn.supabase.co/storage/v1/object/public/cet-papers/mba-cet/2025/slot-3/CET2025-S3-Q013_q00.png]
Which area is cultivated by rice only?
- A5
- B1
- C2
- D11
- E7
Show answerHide answer
Answer: B
Approach: Venn diagram: region inside one shape only.
Solution:
Rectangle = wheat, square = gram, circle = maize, triangle = rice. Read each numbered region by asking: inside which shapes is it?
Rice only = inside the triangle and outside rectangle, square and circle.
Region 1 (the tip of the triangle outside the circle) → 1.
Why the other options are wrong:
A 5: rectangle only (wheat).
C 2: triangle and circle.
D 11: square only (gram).
E 7: all four.
Answer: B
Passage / data for this question
DIRECTIONS for the question: In the following figure, rectangle, square, circle, and triangle represent the region of wheat, gram, maize and rice cultivation respectively. On the basis the figure, answer the following questions.
[IMG:https://suqcijtpfeaystltekfn.supabase.co/storage/v1/object/public/cet-papers/mba-cet/2025/slot-3/CET2025-S3-Q014_q00.png]
Which area is cultivated by maize only?
- A10
- B2
- C3
- D4
- E11
Show answerHide answer
Answer: C
Approach: Venn diagram: region inside one shape only.
Solution:
Rectangle = wheat, square = gram, circle = maize, triangle = rice. Read each numbered region by asking: inside which shapes is it?
Maize only = inside the circle, outside rectangle, square and triangle.
Region 3 (top of the circle) → 3.
Why the other options are wrong:
A 10: also inside the square (gram).
B 2: circle and triangle.
D 4: circle and rectangle.
E 11: square only.
Answer: C
In a town, 65% of people watched the news on television, 40% read a newspaper and 25% read a newspaper and watched the news on television also. What percent of people neither watched the news on television nor read a newspaper?
- A5
- B10
- C15
- D20
- E25
Show answerHide answer
Answer: D
Approach: Two-set Venn diagram: n(A ∪ B) = n(A) + n(B) − n(A ∩ B).
Solution:
TV = 65%, newspaper = 40%, both = 25%.
At least one = 65 + 40 − 25 = 80%.
Neither = 100 − 80 = 20%.
Why the other options are wrong:
A (5%): this is 105 − 100 with the overlap left out.
E (25%): this is the 'both' value.
B (10%), C (15%): these are arithmetic slips.
Cetking shortcut: Neither = 100 − (A + B − both) = 100 − 80 = 20.
Answer: D
In a group of 15 people, 7 read French, 8 read English while 3 of them read none of these two. How many of them read French and English both?
- A0
- B3
- C4
- D5
- E6
Show answerHide answer
Answer: B
Approach: Two-set Venn diagram: n(F ∪ E) = n(F) + n(E) − n(F ∩ E).
Solution:
People who read at least one = 15 − 3 = 12.
12 = 7 + 8 − both, so both = 3.
Why the other options are wrong:
A (0): this assumes no overlap, but 7 + 8 = 15 > 12.
C, D, E: these do not fit 7 + 8 − x = 12.
Cetking shortcut: Both = (F + E) − (Total − Neither) = 15 − 12 = 3.
Answer: B